Feeling uncertain about what to expect in your upcoming interview? We’ve got you covered! This blog highlights the most important Policy Impact Analysis interview questions and provides actionable advice to help you stand out as the ideal candidate. Let’s pave the way for your success.
Questions Asked in Policy Impact Analysis Interview
Q 1. Describe your experience conducting cost-benefit analyses of policy proposals.
Cost-benefit analysis (CBA) is a crucial tool in policy impact analysis, helping us determine whether the benefits of a policy outweigh its costs. My experience involves systematically quantifying both monetary and non-monetary impacts. This often includes identifying all relevant costs (e.g., implementation costs, administrative overhead, opportunity costs) and benefits (e.g., improved health outcomes, increased economic activity, reduced environmental damage).
For example, in assessing a proposed public transportation project, I would quantify the cost of construction, maintenance, and operation. On the benefit side, I’d consider factors like reduced traffic congestion (translated into saved time and fuel costs), improved air quality (valued using health impact assessments), and increased property values near transit stations. I utilize various techniques, including discounted cash flow analysis, to account for the time value of money, ensuring a fair comparison between costs and benefits across different time periods. The final CBA report would present a clear summary of costs and benefits, along with a sensitivity analysis to explore the impact of uncertainties in cost and benefit estimations. This provides decision-makers with a robust understanding of the project’s financial viability.
Q 2. Explain the difference between qualitative and quantitative methods in policy impact analysis.
Qualitative and quantitative methods are complementary approaches in policy impact analysis. Quantitative methods focus on numerical data and statistical analysis to measure the magnitude of policy impacts. Think of surveys with numerical scales, economic data, or epidemiological studies measuring disease rates. These methods allow for precise measurement and statistical testing of hypotheses. For example, a regression analysis could estimate the impact of a minimum wage increase on employment levels.
In contrast, qualitative methods delve into the ‘why’ behind the observed impacts. They rely on non-numerical data such as interviews, focus groups, case studies, and document analysis to explore experiences, perspectives, and underlying mechanisms. For example, qualitative research could help uncover the lived experiences of individuals affected by a new housing policy or explore the unintended consequences of a specific regulation. A mixed-methods approach, combining both qualitative and quantitative data, often provides a richer and more nuanced understanding of policy impacts.
Q 3. How do you assess the validity and reliability of data used in policy impact analysis?
Assessing data validity and reliability is paramount. Validity refers to whether the data measures what it intends to measure, while reliability refers to the consistency and repeatability of the measurements. My approach involves several steps:
- Data Source Evaluation: I critically examine the source of the data, its methodology, and potential biases. Government statistics may have different reliability than data from a private survey.
- Triangulation: I often use multiple data sources to corroborate findings. If different sources point to similar conclusions, it strengthens the validity and reliability.
- Statistical Tests: For quantitative data, I apply appropriate statistical tests (e.g., checking for outliers, assessing internal consistency) to ensure the data’s reliability and identify potential errors.
- Qualitative Data Verification: For qualitative data, I employ techniques like member checking (sharing findings with participants to confirm accuracy) and inter-rater reliability (multiple researchers analyzing the data to ensure consistency).
Addressing any identified inconsistencies or biases is crucial. Transparency in the data selection and analysis process is essential to build confidence in the findings.
Q 4. What are the key challenges in measuring the unintended consequences of policies?
Measuring unintended consequences is a significant challenge because, by definition, they are unforeseen. These impacts often manifest subtly and may not be immediately apparent. Several challenges arise:
- Difficulty in Anticipation: Unintended consequences are, by their nature, hard to predict. Policies often have complex interactions with multiple systems.
- Attribution Challenges: Establishing a causal link between a policy and an unintended consequence can be complex. Other factors might contribute to the observed outcome.
- Data Limitations: Collecting data on unintended consequences often requires creative approaches. Existing datasets may not capture the relevant variables.
- Long-term Effects: Some unintended consequences may only surface over the long term, requiring extensive monitoring and longitudinal studies.
To mitigate these challenges, a combination of prospective and retrospective analysis is beneficial. Prospective analysis involves designing studies to anticipate potential consequences, while retrospective analysis investigates unexpected outcomes that have already emerged. Qualitative research can be very helpful in understanding the mechanisms that link policies to their unintended consequences.
Q 5. Describe your experience with different regression techniques used in policy impact assessment.
Regression analysis is a powerful tool in policy impact assessment. I have extensive experience using various techniques, depending on the research question and data characteristics.
- Ordinary Least Squares (OLS) Regression: This is a widely used method for analyzing the relationship between a dependent variable (e.g., crime rate) and one or more independent variables (e.g., policing strategies, socioeconomic factors). I use OLS when the assumptions of linearity, independence of errors, and homoscedasticity are met.
- Instrumental Variables (IV) Regression: This addresses endogeneity issues where the independent variable is correlated with the error term. For example, if evaluating the impact of education on earnings, unobserved ability might affect both. An instrumental variable, such as proximity to a college, helps to overcome this.
- Difference-in-Differences (DID) Regression: This quasi-experimental method compares changes in an outcome variable between a treatment group (affected by the policy) and a control group (not affected). This is useful for evaluating the impact of policy changes over time.
- Panel Data Regression: This technique analyzes data collected from the same individuals or entities over multiple time periods, allowing for more robust inferences by controlling for time-invariant individual characteristics.
Choosing the appropriate regression technique requires a careful consideration of the data, the research question, and the potential biases.
Q 6. How do you handle missing data in your policy analysis?
Missing data is a common challenge in policy analysis. Ignoring it can lead to biased results. My approach involves a combination of strategies:
- Imputation: Replacing missing values with plausible estimates based on available data. This could involve mean imputation, regression imputation, or multiple imputation techniques. The choice depends on the nature and extent of missing data.
- Weighting Adjustments: Adjusting the weights given to observations to account for missing data, particularly if missingness is non-random.
- Sensitivity Analysis: Conducting analyses with and without imputed data to assess the impact of missing data on the results. If the results are highly sensitive to the imputation method, it indicates a potential problem.
- Data Collection Refinement: For future studies, I would work to minimize missing data through improved data collection methods and respondent engagement strategies.
Transparency in how missing data is handled is critical for the credibility of the analysis.
Q 7. Explain your approach to identifying and addressing bias in policy data.
Identifying and addressing bias is crucial. Bias can stem from various sources, including sampling bias, measurement error, and confounding factors. My approach involves:
- Careful Study Design: This includes ensuring representative sampling, using validated measurement instruments, and employing rigorous data collection procedures.
- Statistical Adjustments: Using techniques like regression analysis to control for confounding variables that might distort the relationship between the policy and the outcome.
- Sensitivity Analysis: Examining the robustness of results to different assumptions about the bias. This helps to understand the potential impact of any remaining bias.
- Qualitative Data Exploration: Using qualitative methods to gain a deeper understanding of potential biases and to explore the context of the data.
- Transparency and Disclosure: Clearly documenting the potential sources of bias and how they have been addressed in the analysis. This promotes the transparency and trustworthiness of the findings.
Recognizing the limitations and potential biases in the analysis is a key aspect of responsible policy analysis.
Q 8. How do you communicate complex policy analysis findings to non-technical audiences?
Communicating complex policy analysis findings to non-technical audiences requires a strategic approach that prioritizes clarity, simplicity, and relevance. I begin by identifying the key takeaways – the most important findings that need to be understood. Then, I translate technical jargon into plain language, using analogies and real-world examples to illustrate complex concepts. Visual aids, such as charts, graphs, and infographics, are crucial for conveying data effectively. For instance, instead of saying ‘the regression analysis revealed a statistically significant positive correlation between policy X and outcome Y,’ I might say, ‘Our research shows that policy X has a clear positive impact on outcome Y.’ Finally, I tailor my communication to the specific audience, considering their prior knowledge and interests. This might involve using different levels of detail for different groups, or focusing on the implications of the findings rather than the technical details of the analysis itself.
For example, when presenting findings on a proposed minimum wage increase to a group of small business owners, I would focus on the potential impact on their businesses – job creation/loss, profitability – using easily understandable data visualizations and avoiding econometric jargon. In contrast, when presenting to a group of policy makers, I could delve into the methodological details and discuss alternative interpretations of the data.
Q 9. Describe a time you had to revise your policy analysis due to new data or information.
During an analysis of a new public health program aimed at reducing smoking rates, my initial findings, based on six-month post-intervention data, showed a statistically significant decrease in smoking prevalence. However, when twelve-month follow-up data became available, the positive effect diminished significantly. This new data revealed that the program’s impact was short-lived, suggesting that participants lacked long-term support and resources. The initial report had to be revised to reflect this crucial finding and acknowledge the program’s limitations. The revised analysis included a discussion of factors that might explain the waning effect, such as lack of follow-up support, suggesting program improvements to enhance long-term impact. This experience highlighted the importance of longitudinal data collection and the need to remain flexible and adapt to new information throughout the analysis process.
Q 10. What are the ethical considerations in conducting policy impact analysis?
Ethical considerations are paramount in policy impact analysis. Transparency is crucial; the methods, data sources, and limitations of the analysis should be clearly articulated. This ensures accountability and allows others to scrutinize the findings. Objectivity is vital; analysts must avoid biases that could skew the results or conclusions. Confidentiality must be maintained, particularly when dealing with sensitive individual-level data. Conflicts of interest must be disclosed and managed to maintain the integrity of the analysis. Additionally, the analysis should consider the potential unintended consequences of a policy, and the distributional effects across different segments of the population. For example, a policy intended to help low-income families might inadvertently harm small businesses. It is the analyst’s responsibility to identify and discuss these aspects fairly. Finally, the results should be presented honestly and without exaggeration or manipulation.
Q 11. How familiar are you with different policy evaluation frameworks (e.g., logic models, realist evaluation)?
I’m very familiar with various policy evaluation frameworks. Logic models provide a visual representation of the causal pathway between a policy intervention and its intended outcomes, outlining the activities, outputs, outcomes, and impacts. They are useful for developing theories of change and identifying potential implementation challenges. Realist evaluation, in contrast, explores the mechanisms by which a policy works, recognizing context-dependent effects. It investigates ‘what works for whom, in what circumstances, and why?’ Other frameworks I use include cost-benefit analysis, which quantifies the economic costs and benefits of a policy, and randomized controlled trials (RCTs), which offer a rigorous way to assess causal impacts. The choice of framework depends on the specific policy, the available data, and the research questions.
Q 12. How do you prioritize competing policy goals in your analysis?
Prioritizing competing policy goals is a core challenge in policy analysis. There is rarely a single ‘best’ solution. I usually approach this using a multi-criteria decision analysis (MCDA) approach. This involves explicitly identifying the different goals, assigning weights reflecting their relative importance (based on stakeholder input and policy objectives), and developing metrics to measure progress towards each goal. Then, I evaluate each policy option based on its performance across these multiple dimensions, using techniques like scoring, ranking, or weighted averaging. Transparency is essential here; the weighting system and the rationale behind it should be clearly documented. Sensitivity analysis – examining how the conclusions change when the weights are varied – helps to understand the robustness of the prioritization. This structured approach allows for a more transparent and defensible decision, recognizing that trade-offs are inevitable.
Q 13. What are the limitations of using econometric models to assess policy impact?
Econometric models, while powerful tools for assessing policy impact, have limitations. One major limitation is the problem of omitted variable bias. If important variables that influence the outcome are excluded from the model, the estimated effect of the policy can be misleading. Another limitation is the challenge of establishing causality. Econometric models often rely on correlations, which do not necessarily imply causation. Endogeneity – the situation where the independent variable is correlated with the error term – can also bias the results. Furthermore, econometric models often rely on simplifying assumptions about the data and the underlying relationships, and these assumptions might not always hold in the real world. Lastly, data limitations can restrict the scope and accuracy of econometric analyses, potentially influencing the generalizability of the findings.
Q 14. How do you ensure the generalizability of your findings from a policy analysis study?
Ensuring the generalizability of policy analysis findings involves careful consideration of the study’s context and limitations. A key factor is the representativeness of the sample. The study’s participants should ideally be a representative sample of the population to which the findings will be generalized. If the study sample is not representative, the findings might not be applicable to other populations. Another critical aspect is the external validity of the study. This refers to the extent to which the findings can be generalized across different settings and contexts. Threats to external validity include factors specific to the study context that are not replicated elsewhere. Thorough documentation of the study’s methodology, including data collection procedures and analytical techniques, enables transparency and allows for an assessment of generalizability. The report should clearly discuss any limitations that might affect generalizability and suggest areas for future research to extend the findings.
Q 15. Describe your experience with stakeholder engagement in policy analysis.
Stakeholder engagement is crucial for effective policy analysis. It ensures that the analysis is relevant, credible, and ultimately, leads to better policies. My experience involves actively identifying and engaging with all relevant parties – from government officials and policymakers to community groups, businesses, and individual citizens who may be affected by the policy. This often involves a multifaceted approach.
- Workshops and Focus Groups: I facilitate interactive sessions to gather diverse perspectives and identify potential impacts. For example, in analyzing a proposed transportation policy, I’d conduct workshops with residents, businesses near proposed routes, and transportation professionals to understand their concerns and expectations.
- Surveys and Interviews: Structured and semi-structured interviews, and targeted surveys allow me to gather quantitative and qualitative data on attitudes and experiences. This can provide insights into the potential impact of a policy on specific demographic groups.
- Public Forums and Presentations: I present my findings and recommendations to broader audiences, encouraging dialogue and feedback. This step helps ensure transparency and accountability in the analysis process.
- Building Partnerships: Strong relationships are built with stakeholders throughout the process, ensuring ongoing communication and collaboration.
Ultimately, effective stakeholder engagement ensures that the analysis reflects the lived realities of those who will be impacted by the policy, leading to a more comprehensive and effective outcome.
Career Expert Tips:
- Ace those interviews! Prepare effectively by reviewing the Top 50 Most Common Interview Questions on ResumeGemini.
- Navigate your job search with confidence! Explore a wide range of Career Tips on ResumeGemini. Learn about common challenges and recommendations to overcome them.
- Craft the perfect resume! Master the Art of Resume Writing with ResumeGemini’s guide. Showcase your unique qualifications and achievements effectively.
- Don’t miss out on holiday savings! Build your dream resume with ResumeGemini’s ATS optimized templates.
Q 16. How do you incorporate feedback from stakeholders into your policy analysis?
Incorporating stakeholder feedback is not merely about collecting opinions; it’s about integrating them meaningfully into the analysis. I follow a systematic approach:
- Qualitative Coding: For qualitative data (interview transcripts, focus group notes), I use coding techniques to identify recurring themes and sentiments. This helps summarize vast amounts of data into manageable categories.
- Triangulation: I compare feedback from different stakeholders and data sources to validate findings. If feedback consistently points to a particular concern, I give it more weight in my analysis.
- Sensitivity Analysis: Where possible, I incorporate stakeholder feedback into quantitative models. For example, if stakeholders express uncertainty about a particular parameter, I conduct a sensitivity analysis to see how the results vary across a range of plausible values.
- Iterative Process: Feedback often leads to adjustments in the analysis methodology or focus. I use an iterative approach, refining the analysis based on what I learn through engagement.
- Transparency and Communication: I transparently communicate how stakeholder feedback has influenced the analysis, ensuring that the process is credible and builds trust.
For instance, if feedback reveals unexpected negative consequences of a policy, I would revise the analysis to reflect these potential downsides, even if it means modifying the initial recommendations.
Q 17. What software or tools are you proficient in using for policy analysis (e.g., R, Stata, SPSS)?
My proficiency in statistical software is essential for rigorous policy analysis. I’m highly experienced in R, a powerful and versatile tool for data manipulation, statistical modeling, and visualization. I also have considerable experience with Stata, which excels in econometrics and panel data analysis, commonly used in impact evaluations. Finally, I’m familiar with SPSS, particularly for its user-friendly interface, helpful in presenting findings to non-technical audiences.
The choice of software depends on the specific needs of the analysis. For example, R‘s flexibility is ideal for complex modeling, while Stata might be preferred for advanced regression techniques. SPSS’s strengths lie in its ease of use for descriptive statistics and basic analyses.
Q 18. How do you handle conflicting evidence or findings in policy analysis?
Conflicting evidence is a common challenge in policy analysis. It’s crucial to avoid simply dismissing contradictory findings. Instead, I employ several strategies:
- Critical Appraisal: I carefully evaluate the quality of evidence, considering the methodology, sample size, and potential biases of different studies. A systematic review is often helpful in this regard.
- Data Integration: I explore ways to integrate apparently contradictory findings. Perhaps the conflicting results are due to differences in context, populations studied, or measurement approaches. Meta-analysis can help synthesize results from multiple studies.
- Qualitative Insights: I incorporate qualitative data (interviews, case studies) to provide context and nuance to quantitative findings. Qualitative evidence can help explain why seemingly conflicting results might exist.
- Uncertainty Quantification: I acknowledge and quantify uncertainty in the findings. Instead of presenting definitive conclusions, I may describe a range of plausible scenarios, reflecting the uncertainty associated with conflicting evidence.
- Transparency: I transparently present the conflicting evidence and my rationale for how I have interpreted it in the analysis. This is vital for ensuring the credibility of my work.
For example, if two studies show conflicting effects of a job training program, I might explore whether the programs differed significantly in design or target population, or if methodological limitations explain the divergence.
Q 19. Explain your understanding of counterfactual analysis in policy evaluation.
Counterfactual analysis is a powerful technique in policy evaluation. It aims to answer the ‘what if’ question: What would have happened if the policy hadn’t been implemented? This is challenging because we can’t observe the same population both with and without the policy intervention simultaneously. Therefore, we need to construct a counterfactual – a comparison group that is as similar as possible to the treatment group (those who received the policy intervention) but didn’t receive the intervention.
Methods used to create counterfactuals include:
- Randomized Controlled Trials (RCTs): The gold standard, RCTs randomly assign individuals to treatment and control groups, making them statistically comparable.
- Regression Discontinuity Design (RDD): RDD leverages a cutoff point to create treatment and control groups. Individuals just above the cutoff receive treatment, while those just below do not.
- Matching Techniques: These techniques pair individuals in the treatment group with similar individuals in the control group based on observed characteristics.
- Difference-in-Differences (DID): DID compares changes in outcomes over time in the treatment and control groups, exploiting pre-existing trends.
The core idea is to isolate the effect of the policy by comparing outcomes in the treatment and counterfactual groups, controlling for other factors that might influence the outcome.
Q 20. Describe your experience with different types of policy impact assessments (e.g., ex-ante, ex-post)?
I have extensive experience conducting both ex-ante and ex-post policy impact assessments.
- Ex-ante assessments are conducted *before* a policy is implemented. They aim to predict the likely effects of a policy, often using models and simulations to estimate potential impacts on various outcomes. This type of assessment is crucial for informing policy design and mitigating potential unintended consequences. For example, an ex-ante assessment of a carbon tax might model its effects on greenhouse gas emissions, economic growth, and energy prices.
- Ex-post assessments are conducted *after* a policy has been implemented. They evaluate the actual effects of the policy by comparing outcomes in the period after the policy’s implementation with outcomes in a counterfactual period or group. This type of assessment helps determine whether the policy achieved its intended goals and identifies any unanticipated impacts. For instance, an ex-post evaluation of a job training program might compare employment rates of program participants with those of a control group.
Both types of assessments are valuable, with ex-ante informing policy design and ex-post evaluations providing critical feedback on policy effectiveness and informing future policy iterations. Often, I combine both to obtain a comprehensive understanding of policy impact.
Q 21. How do you measure the effectiveness of a policy intervention?
Measuring the effectiveness of a policy intervention requires a clear understanding of the policy’s goals and objectives. There’s no single metric; the appropriate measures depend heavily on the policy’s context and aims.
Methods include:
- Quantitative Indicators: These include changes in relevant outcomes such as employment rates, crime rates, pollution levels, or health indicators. Statistical analysis, such as regression models, is used to assess the impact of the policy on these outcomes, accounting for other factors.
- Qualitative Indicators: Qualitative data, such as interviews, focus groups, and case studies, can provide valuable insights into the mechanisms through which a policy has produced its effects. They can also reveal unintended consequences or aspects of impact not captured by quantitative measures.
- Cost-Benefit Analysis: This method compares the costs of implementing a policy to the benefits it generates. It allows for a comprehensive assessment of the policy’s economic efficiency.
- Process Evaluation: This examines the extent to which the policy was implemented as intended. This can identify implementation challenges that might hinder the policy’s effectiveness.
For instance, evaluating a public health campaign aimed at reducing smoking might involve tracking changes in smoking rates, measuring awareness levels using surveys, and analyzing qualitative data on perceptions and experiences of the campaign.
Q 22. Explain your understanding of causal inference in policy analysis.
Causal inference in policy analysis is about understanding the cause-and-effect relationship between a policy intervention and its outcomes. It’s not enough to simply observe a correlation; we need to determine if the policy actually caused the observed changes. This is crucial because policies are designed to achieve specific goals, and we need rigorous methods to evaluate if they’re working as intended.
Imagine a new job training program. If we see an increase in employment rates among participants, it’s tempting to conclude the program was successful. However, perhaps the economy improved during the same period, boosting employment regardless of the program. Causal inference helps us disentangle these effects. Methods like randomized controlled trials (RCTs), regression discontinuity design (RDD), instrumental variables (IV), and difference-in-differences (DID) are commonly used to isolate the causal impact of the policy.
For example, an RCT randomly assigns individuals to either a treatment group (receiving the job training) or a control group (not receiving it). By comparing outcomes between the two groups, we can more confidently attribute any differences to the training program, minimizing confounding factors like economic conditions.
Q 23. What are some common pitfalls to avoid in policy impact analysis?
Several pitfalls can undermine the validity of a policy impact analysis. One common error is selection bias, where the individuals exposed to the policy are systematically different from those who are not. For example, individuals who voluntarily participate in a program might be more motivated and thus achieve better outcomes regardless of the program’s effectiveness.
- Confounding variables: These are factors correlated with both the policy and the outcome, making it hard to isolate the policy’s true effect. For instance, a study on the impact of a new school curriculum on test scores might be confounded by factors like parental involvement or teacher quality.
- Data limitations: Insufficient data, missing data, or poor data quality can severely limit the accuracy of the analysis.
- Ignoring unintended consequences: Policies often have unforeseen side effects, both positive and negative, which a thorough analysis should address.
- Attribution errors: Overestimating or underestimating the policy’s impact due to flawed methodology or inappropriate statistical techniques.
- Lack of counterfactual: Failing to establish a credible comparison point (what would have happened without the policy) makes it difficult to attribute changes to the policy itself.
Careful study design, rigorous statistical methods, and a comprehensive understanding of the context are essential to avoid these pitfalls.
Q 24. How do you assess the political feasibility of policy recommendations?
Assessing political feasibility involves understanding the likelihood that a policy recommendation will be adopted and implemented. This requires moving beyond purely technical analysis and considering the political landscape.
My approach involves a multi-faceted assessment:
- Stakeholder analysis: Identifying key actors (e.g., government agencies, interest groups, the public) and their positions on the policy. This involves understanding their power, interests, and potential influence on the decision-making process.
- Political context analysis: Examining the prevailing political climate, including the government’s priorities, public opinion, and potential political opposition.
- Cost-benefit analysis (incorporating political costs): While traditional cost-benefit analysis focuses on economic aspects, political feasibility analysis must consider the potential political costs (e.g., negative media coverage, electoral consequences) of the policy.
- Scenario planning: Developing different scenarios based on various political outcomes to explore the potential impact of different political realities on the policy’s success.
- Communication strategy: Considering how to effectively communicate the policy’s benefits and address potential concerns to gain political support.
For example, a policy with significant public support but strong opposition from influential lobby groups might have low political feasibility, despite its potential benefits.
Q 25. Describe your experience with policy simulation modeling.
I have extensive experience with policy simulation modeling, using tools like agent-based modeling (ABM), system dynamics modeling, and microsimulation. These models allow us to explore the potential impacts of policies under different assumptions and scenarios, providing insights that are difficult to obtain through observational studies alone.
For instance, in a project evaluating the impact of a new tax policy, we used a microsimulation model to project changes in household income distribution, taking into account factors such as income levels, family size, and regional variations. This model allowed us to analyze the distributional consequences of the tax policy, identifying potential winners and losers. ABM’s can be particularly valuable for understanding complex systems with interactions between multiple actors, such as the spread of infectious disease or the effect of environmental regulations on market behavior. These models provide a powerful way to test hypotheses and understand the potential consequences of policy interventions before implementation.
Q 26. How do you determine the appropriate sample size for a policy impact study?
Determining the appropriate sample size for a policy impact study depends on several factors: the desired level of precision, the variability of the outcome measure, the statistical power needed to detect a meaningful effect, and the resources available. There isn’t a one-size-fits-all answer, but we use power analysis to determine a sample size that’s both statistically sound and practically feasible.
Power analysis involves specifying:
- Significance level (alpha): The probability of rejecting the null hypothesis when it’s true (typically 0.05).
- Power (1-beta): The probability of rejecting the null hypothesis when it’s false (typically 0.80 or higher).
- Effect size: The magnitude of the difference we expect to observe between the treatment and control groups.
Software packages and online calculators can help perform power calculations, providing the required sample size based on these parameters. For example, a study with a small expected effect size will require a larger sample size to achieve sufficient power to detect the effect. The choice of sampling method (e.g., simple random sampling, stratified sampling) is also crucial for ensuring a representative sample.
Q 27. How do you incorporate uncertainty into your policy analysis?
Incorporating uncertainty is paramount in policy analysis, as we rarely have perfect knowledge. Ignoring uncertainty can lead to misleading conclusions and ineffective policies. We address uncertainty through several methods:
- Sensitivity analysis: We systematically vary key assumptions and parameters in our model to observe how sensitive the results are to changes in these inputs. This helps identify which assumptions are most critical and where further investigation might be needed.
- Probabilistic modeling: Rather than using point estimates for parameters, we incorporate probability distributions reflecting the uncertainty in our knowledge. This leads to a range of possible outcomes, rather than a single prediction.
- Monte Carlo simulation: This involves repeatedly running our model with different randomly sampled parameter values to generate a distribution of possible outcomes. This provides a visual representation of the uncertainty surrounding our predictions.
- Bayesian methods: These methods allow us to update our beliefs about model parameters as new evidence becomes available.
For example, when analyzing the economic impact of a climate change policy, we might use probabilistic forecasting to account for uncertainty in future greenhouse gas emissions and the effectiveness of different mitigation strategies. Communicating this uncertainty transparently to policymakers is crucial for making informed decisions.
Q 28. What are your preferred methods for visualizing policy analysis findings?
Choosing effective methods for visualizing policy analysis findings is crucial for communication and impact. My preferred methods depend on the audience and the nature of the findings, but I often use a combination of techniques.
- Charts and graphs: Bar charts, line graphs, scatter plots, and maps are effective for presenting key findings concisely and visually appealingly. For example, a bar chart could clearly show the difference in unemployment rates between a treatment and control group in an evaluation of a job training program.
- Data tables: While less visually striking, tables are essential for presenting detailed quantitative information.
- Infographics: Infographics combine visuals and text to communicate complex information clearly and engagingly to a wider audience.
- Interactive dashboards: These allow users to explore the data interactively and customize visualizations to suit their specific needs.
- Narrative explanations: Always contextualize visualizations with clear, accessible explanations. Avoid relying solely on charts and graphs; it’s vital to tell a story with the data.
The goal is to present the findings in a way that’s both informative and easily understood, even by those without a strong quantitative background.
Key Topics to Learn for Policy Impact Analysis Interview
- Cost-Benefit Analysis: Understanding the theoretical framework and practical application of CBA in evaluating policy options. This includes identifying and quantifying costs and benefits, handling uncertainty, and presenting findings clearly.
- Qualitative Impact Assessment: Exploring methods to assess non-quantifiable impacts, such as social, environmental, and ethical considerations. Practice incorporating qualitative data into your analysis and effectively communicating its significance.
- Regression Analysis & Statistical Modeling: Developing a strong understanding of how statistical methods are used to establish causal relationships between policies and outcomes. Familiarize yourself with different regression techniques and their limitations.
- Scenario Planning & Forecasting: Mastering the art of exploring different possible future scenarios based on policy choices. This involves developing realistic assumptions, modeling different outcomes, and communicating uncertainty.
- Stakeholder Analysis & Engagement: Understanding how to identify key stakeholders, assess their interests, and engage them effectively throughout the policy analysis process. Practice techniques for conflict resolution and consensus building.
- Policy Evaluation Frameworks: Familiarizing yourself with various frameworks like the logic model, theory of change, and realist evaluation. Understand their strengths and weaknesses and how to choose the appropriate framework for a given context.
- Data Collection & Analysis Techniques: Gain proficiency in various data collection methods (surveys, interviews, administrative data) and analysis techniques suitable for policy impact assessment. Practice critically evaluating data quality and limitations.
- Communication & Report Writing: Mastering the art of clearly and concisely communicating complex analytical findings to diverse audiences. Practice structuring your reports logically, using visualizations effectively, and tailoring your language to your audience.
Next Steps
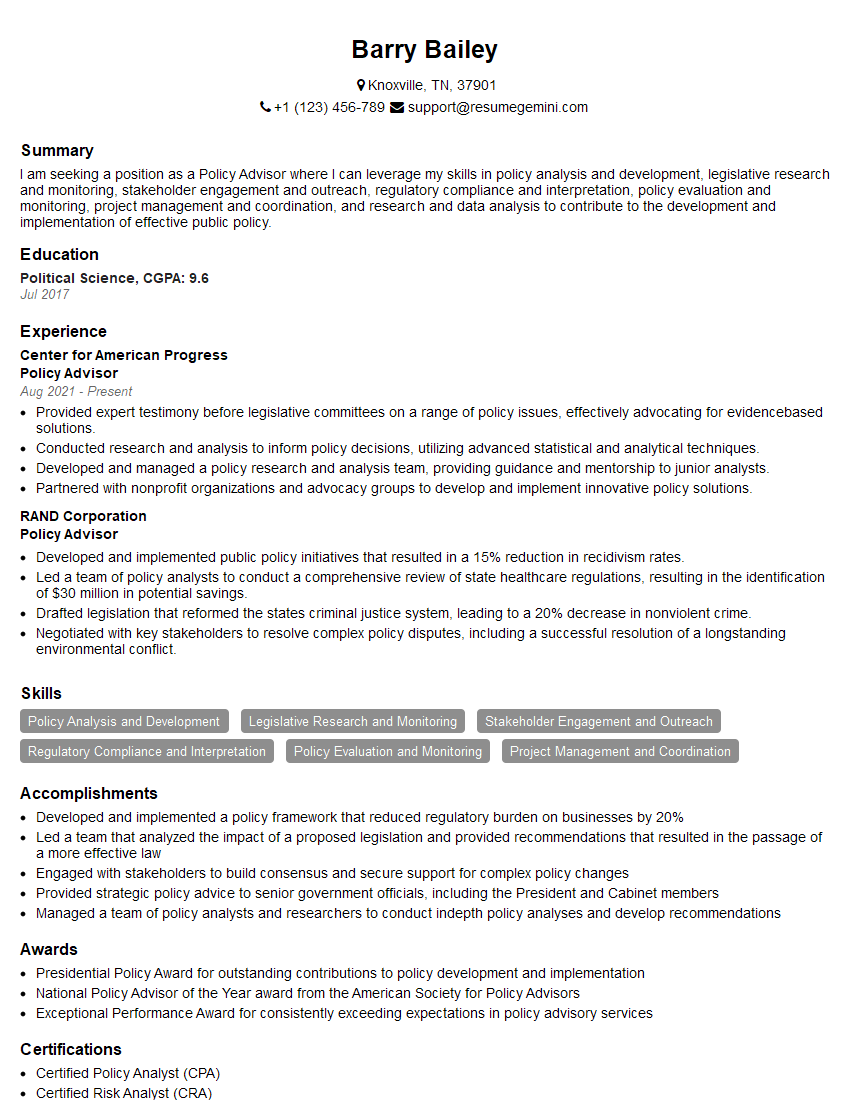
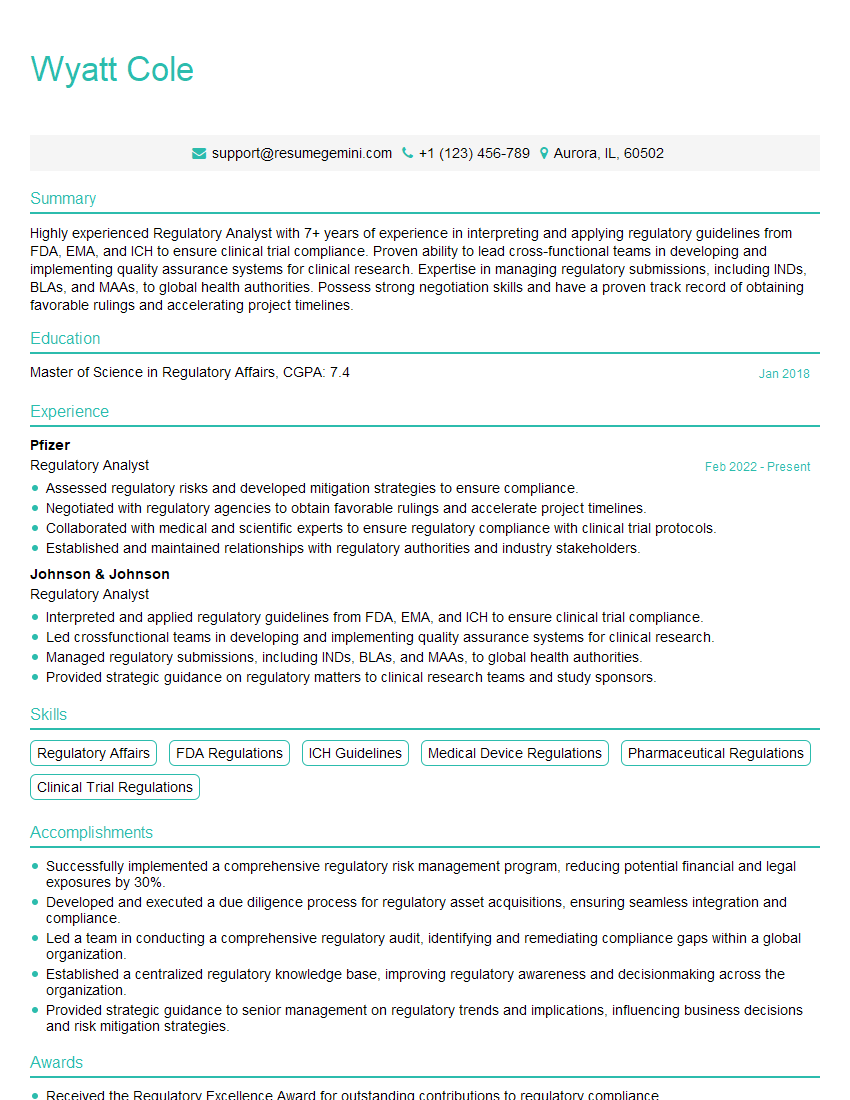
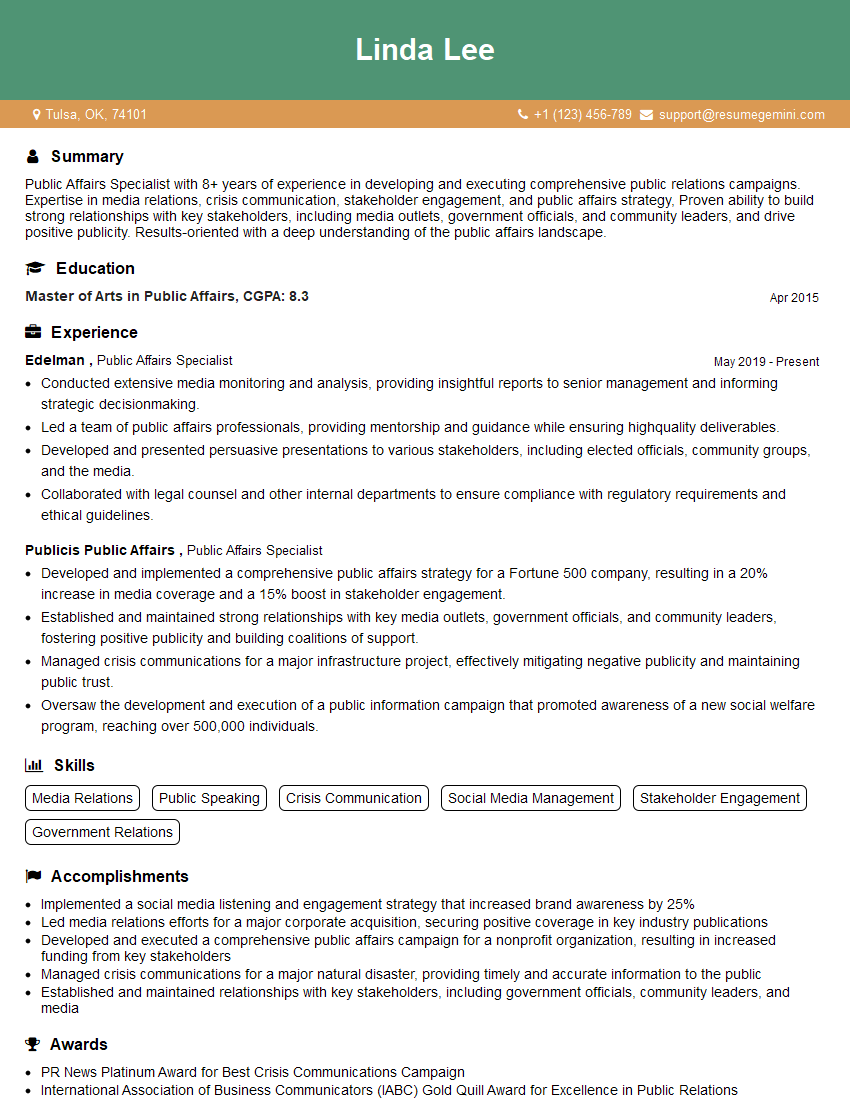
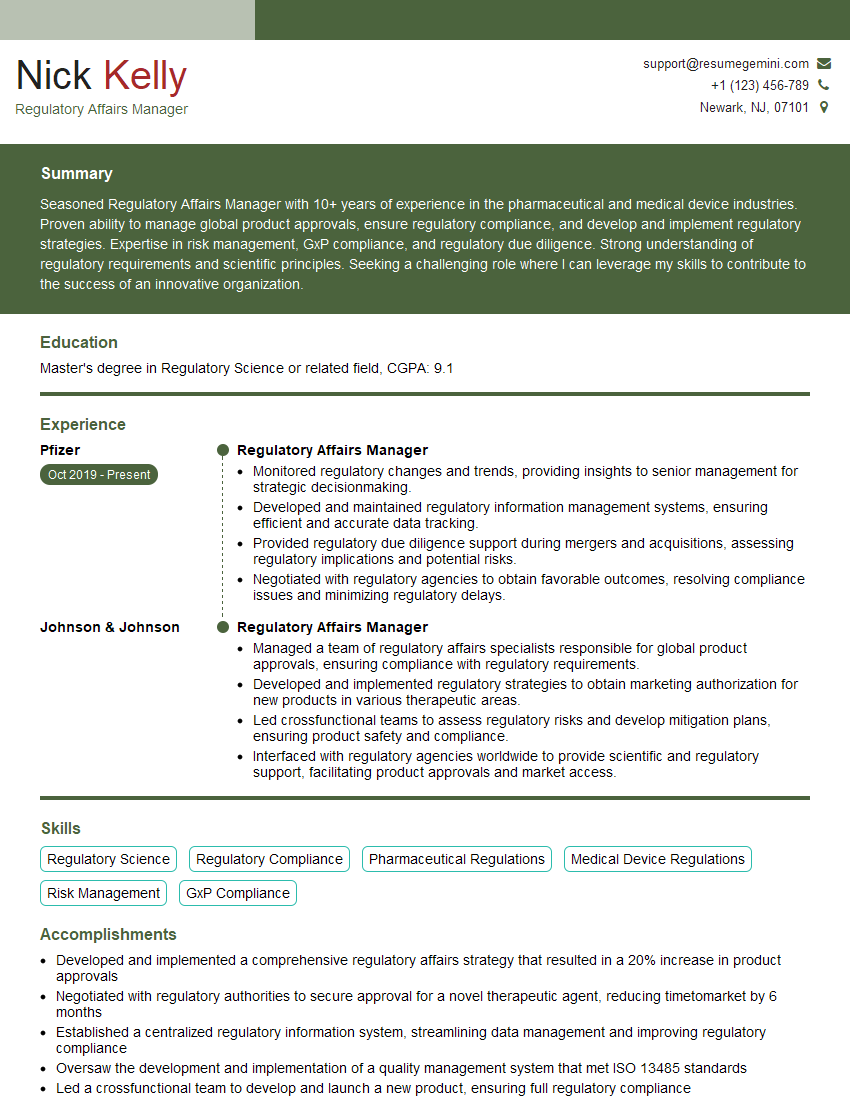
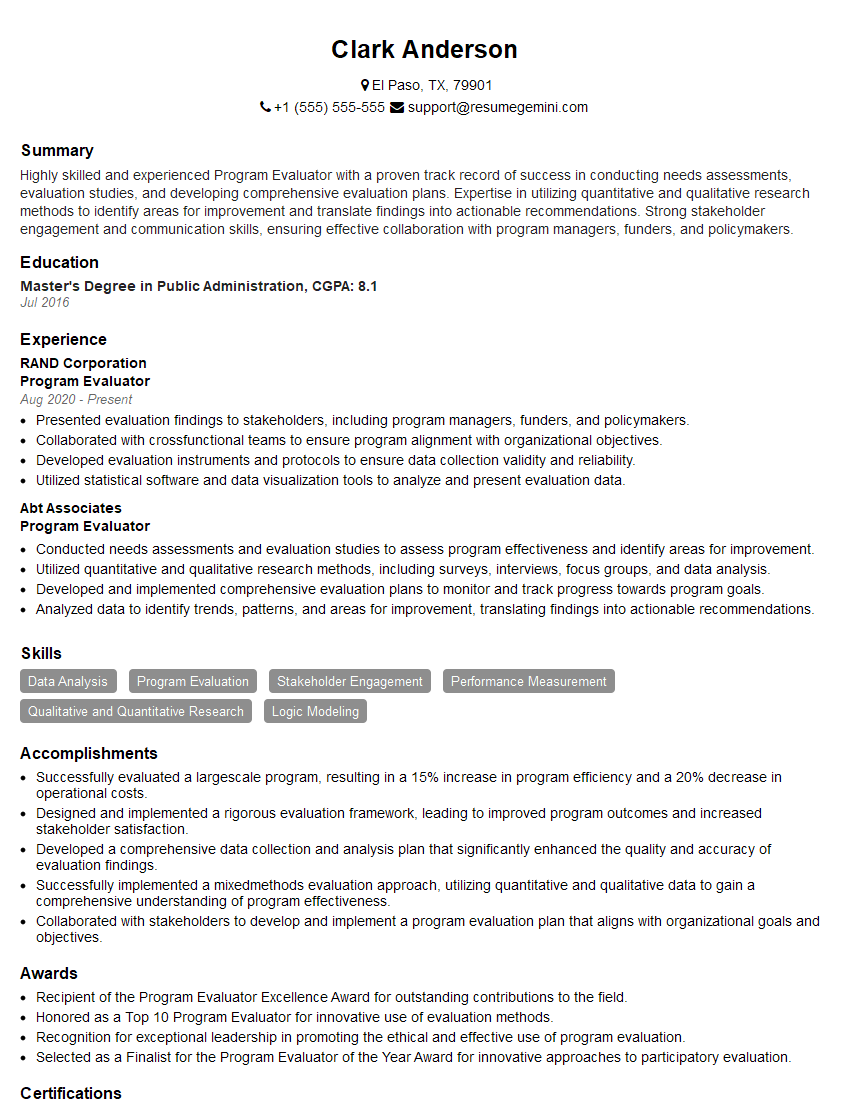
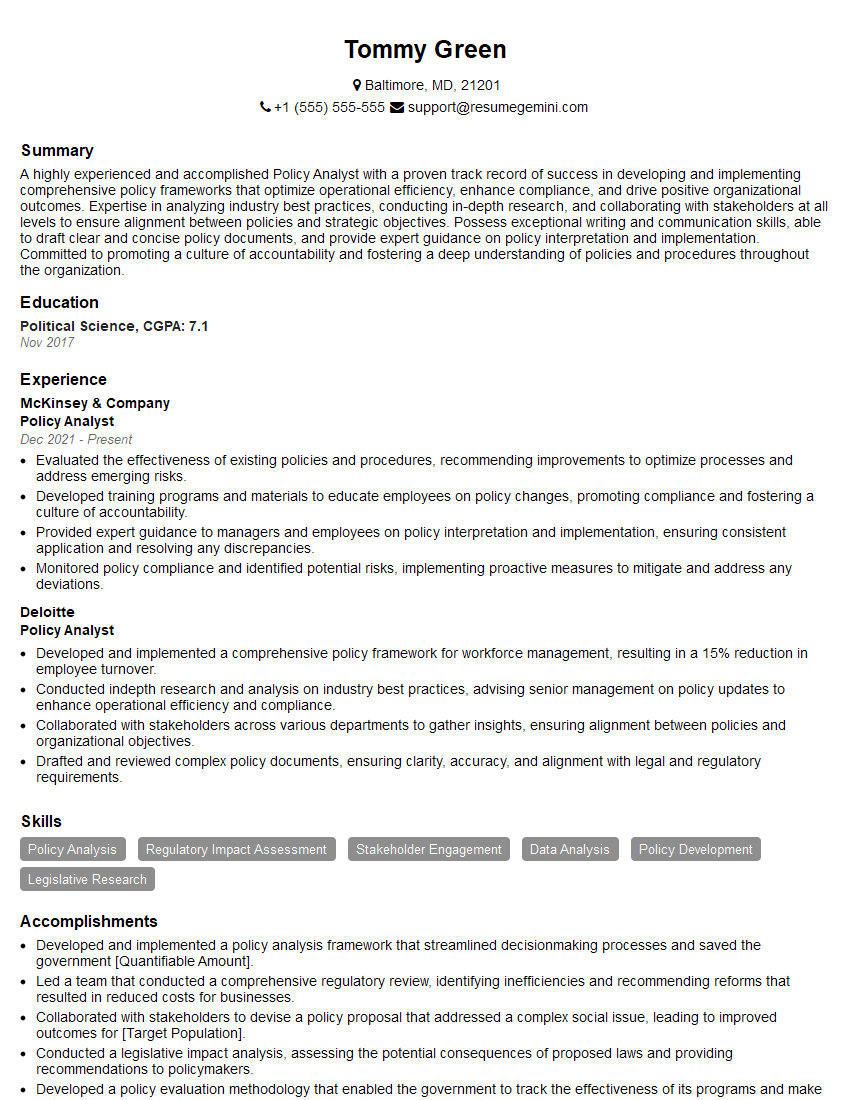
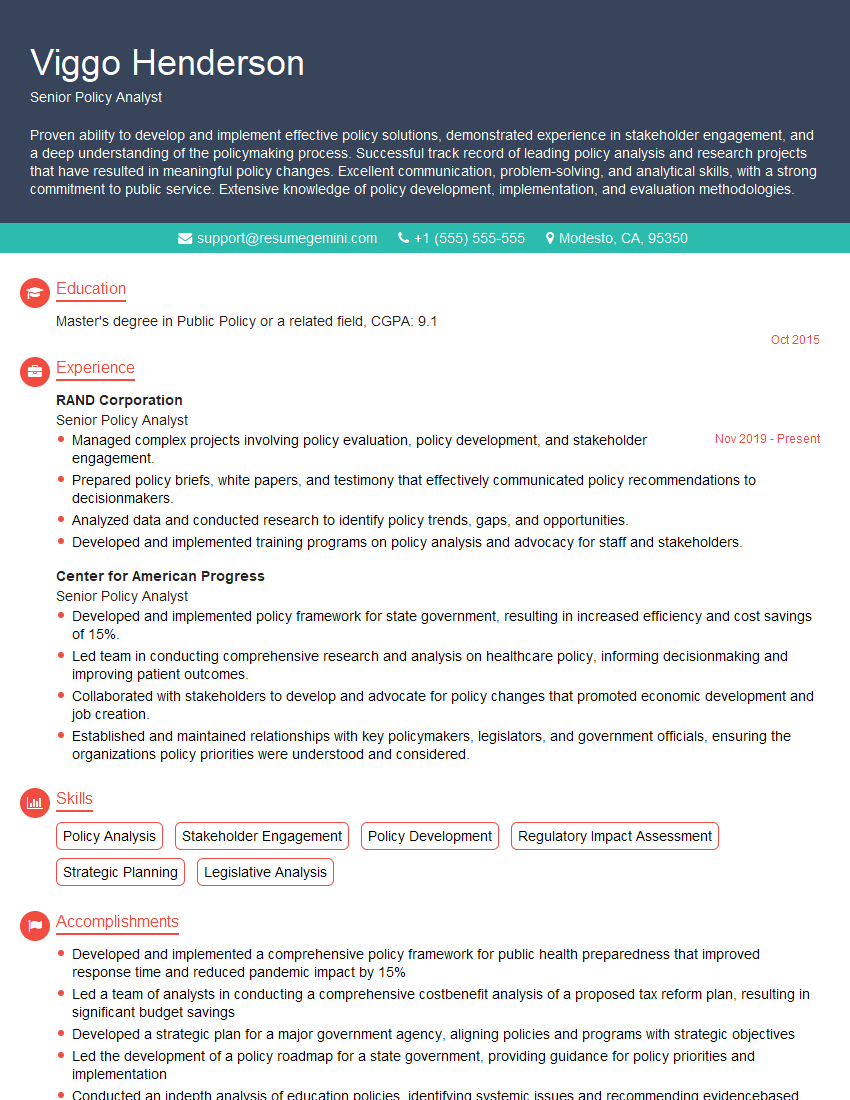
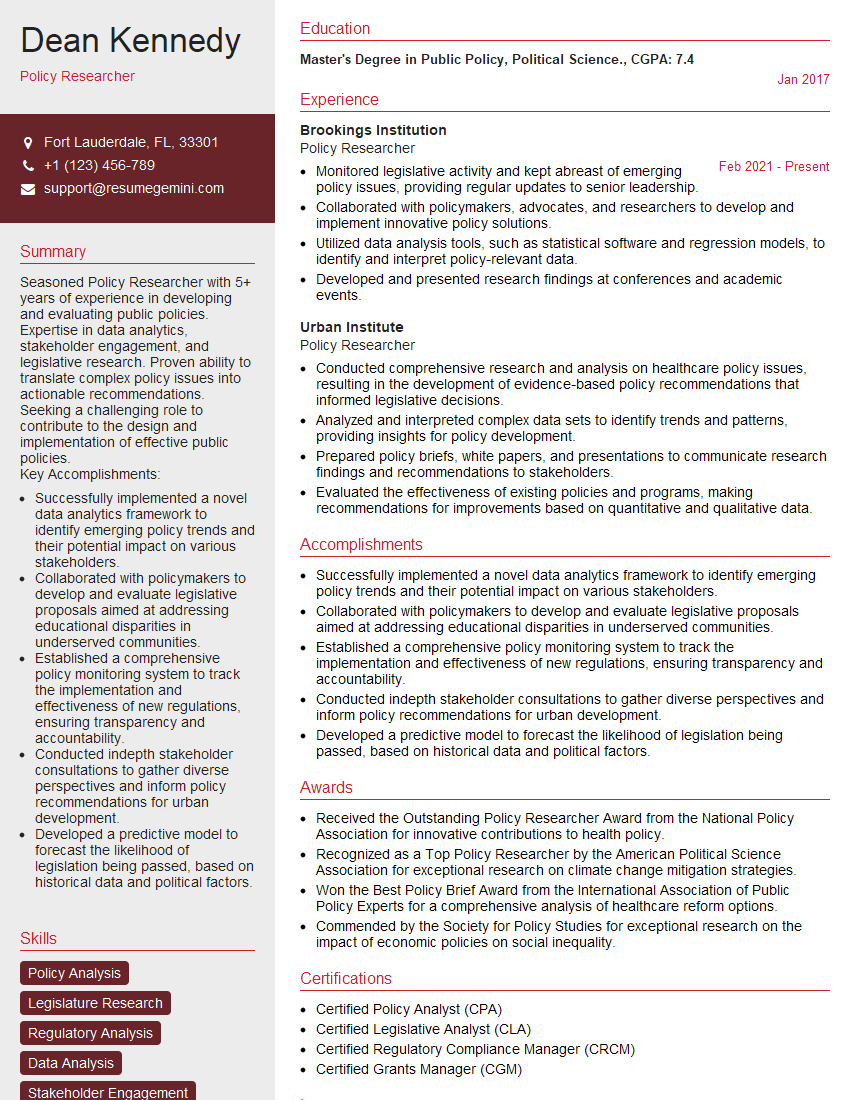
Mastering Policy Impact Analysis is crucial for a successful career in policy, research, and consulting. It demonstrates your ability to critically evaluate policy options, make data-driven recommendations, and contribute meaningfully to evidence-based decision-making. To significantly enhance your job prospects, creating an ATS-friendly resume is essential. This ensures your application is easily scanned and recognized by applicant tracking systems. We strongly encourage you to utilize ResumeGemini, a trusted resource, to build a professional and impactful resume. ResumeGemini provides examples of resumes tailored to Policy Impact Analysis to help you craft a compelling application that showcases your skills and experience effectively.
Explore more articles
Users Rating of Our Blogs
Share Your Experience
We value your feedback! Please rate our content and share your thoughts (optional).
What Readers Say About Our Blog
This was kind of a unique content I found around the specialized skills. Very helpful questions and good detailed answers.
Very Helpful blog, thank you Interviewgemini team.
