Unlock your full potential by mastering the most common Political Polling interview questions. This blog offers a deep dive into the critical topics, ensuring you’re not only prepared to answer but to excel. With these insights, you’ll approach your interview with clarity and confidence.
Questions Asked in Political Polling Interview
Q 1. Explain the difference between probability and non-probability sampling in political polling.
The core difference between probability and non-probability sampling lies in how the sample is selected. Probability sampling ensures every member of the population has a known, non-zero chance of being selected. This allows for generalizations about the entire population. In contrast, non-probability sampling doesn’t guarantee every member a chance of selection, leading to potentially biased results and limiting the ability to generalize findings to the broader population.
- Probability Sampling: Think of a lottery—each ticket has an equal chance of winning. In polling, this might involve random digit dialing for phone surveys or randomly selecting addresses from a voter registration list. Techniques include simple random sampling, stratified sampling (ensuring representation from different subgroups), and cluster sampling (sampling groups within the population).
- Non-probability Sampling: This is like choosing lottery winners based on who looks happiest. Methods include convenience sampling (e.g., surveying people at a mall), quota sampling (filling quotas for specific demographic groups), and snowball sampling (referrals from existing participants). While quicker and cheaper, these methods are susceptible to bias because the sample may not accurately reflect the population.
In political polling, probability sampling is strongly preferred for its ability to produce more accurate and generalizable results, even though it is more resource-intensive.
Q 2. Describe your experience with weighting survey data to accurately reflect the population.
Weighting survey data is crucial for ensuring the sample accurately reflects the population’s demographics. My experience involves using post-stratification weighting to adjust the sample to match known population proportions based on factors like age, gender, race, and education. This corrects for any sampling discrepancies where certain demographics might be over- or under-represented.
For example, if our sample has too few young voters compared to their actual proportion in the electorate, we assign higher weights to the responses of young voters to compensate. This process utilizes statistical software and involves iterative adjustments to minimize discrepancies and ensure the weighted sample aligns closely with the population’s demographic characteristics. I’ve also worked with raking, a more sophisticated weighting technique that iteratively adjusts weights across multiple variables simultaneously.
Proper weighting minimizes bias introduced during the sampling process, improving the accuracy and reliability of poll results and increasing their generalizability.
Q 3. How do you identify and mitigate bias in political polls?
Bias in political polls can stem from various sources, and identifying and mitigating them is critical for producing credible results. This involves a multi-faceted approach:
- Question Wording Bias: Leading questions or ambiguous phrasing can sway responses. We employ rigorous testing and pre-testing of questionnaires to ensure neutrality. For example, instead of ‘Do you agree with the President’s unpopular policies?’, we might ask, ‘What is your opinion of the President’s policies?’
- Sampling Bias: This arises when the sample doesn’t represent the population. Probability sampling, as discussed earlier, helps mitigate this, while careful attention to weighting further reduces bias.
- Interviewer Bias: The interviewer’s tone or demeanor can influence responses. Training interviewers to be neutral and objective is paramount.
- Response Bias: This occurs when respondents provide inaccurate or misleading answers (e.g., social desirability bias). Ensuring anonymity and confidentiality helps reduce this.
Addressing these biases involves careful questionnaire design, rigorous sampling methods, well-trained interviewers, and appropriate data analysis techniques, including weighting and statistical adjustments.
Q 4. What are some common sources of error in political polling, and how do you address them?
Political polling is susceptible to several sources of error, broadly categorized as sampling error and non-sampling error.
- Sampling Error: This is the inherent variability due to the fact that we’re studying a sample, not the entire population. The margin of error quantifies this. We aim to minimize it by using sufficiently large sample sizes and appropriate sampling techniques.
- Non-sampling Error: This encompasses errors not related to sampling. Examples include:
- Measurement Error: Poorly designed questions, ambiguous wording, or respondent misunderstanding can lead to inaccurate answers.
- Non-response Bias: When a significant portion of the selected sample doesn’t participate, the results may not accurately represent the population. We address this by employing follow-up methods and analyzing the characteristics of non-respondents to assess potential bias.
- Processing Error: Mistakes in data entry or analysis can distort the results. We utilize rigorous quality control procedures to minimize these errors.
Addressing these errors requires meticulous attention to every stage of the polling process—from questionnaire design and sampling to data collection, processing, and analysis. Using appropriate statistical methods helps to detect and minimize the impact of these errors on the final results.
Q 5. Explain the concept of margin of error and its significance in interpreting poll results.
The margin of error represents the uncertainty inherent in estimating a population parameter from a sample. It is expressed as a plus or minus range around the estimate (e.g., 50% ± 3%). For instance, if a poll shows 50% support for a candidate with a 3% margin of error, it means the true support likely lies between 47% and 53%. It’s crucial for interpreting results realistically and understanding that the findings are estimates, not precise figures.
The significance of the margin of error lies in its ability to express the level of confidence we have in the poll’s results. A smaller margin of error indicates greater precision and confidence in the estimate. Factors influencing margin of error include sample size (larger sample sizes yield smaller margins of error) and the variability in the population (higher variability leads to larger margins of error).
Q 6. How do you determine the appropriate sample size for a political poll?
Determining the appropriate sample size depends on several factors: the desired level of precision (margin of error), the confidence level, and the expected variability within the population. Statisticians use formulas to calculate the required sample size. A higher confidence level (e.g., 95% vs. 90%) requires a larger sample size, as does a smaller desired margin of error.
For instance, if we want a margin of error of ±3% with a 95% confidence level for a population with anticipated 50% support for a candidate, the required sample size would be around 1068. However, if we are dealing with a smaller sub-population or a more homogeneous population (less variability), then a smaller sample size could suffice. We utilize statistical software to calculate the required sample size and tailor our sampling strategy accordingly, always ensuring a balance between precision and feasibility.
Q 7. Describe your experience with different data collection methods (e.g., phone, online, in-person).
My experience encompasses various data collection methods, each with its strengths and weaknesses:
- Phone Surveys: Traditional method, but declining response rates due to caller ID and mobile phones pose challenges. Random digit dialing and careful interviewer training are crucial.
- Online Surveys: Cost-effective and scalable, but prone to sampling bias if the online population doesn’t accurately represent the target population. Careful weighting and sampling techniques are necessary.
- In-person Surveys: High response rates and allow for complex questions and visual aids, but are expensive and time-consuming, making them generally unsuitable for large-scale national polls. However, they are valuable for focus groups or smaller scale, in-depth studies.
The choice of method depends on the resources available, the target population, the complexity of the survey questions, and the desired level of accuracy. Often, a mixed-methods approach might be employed, such as using online surveys as the primary method, but supplementing it with phone interviews to ensure representation across various demographics.
Q 8. How do you analyze qualitative data from focus groups or interviews alongside quantitative poll data?
Qualitative and quantitative data are powerful complements in political polling. Think of it like this: quantitative data (from polls) tells you what people think, while qualitative data (from focus groups and interviews) tells you why they think that way. Analyzing them together paints a much richer picture.
My approach involves a triangulation method. First, I analyze the quantitative data to identify key trends and significant relationships. For example, a poll might reveal strong support for a specific policy among a particular demographic. Then, I delve into the qualitative data to uncover the underlying reasons for this support. Focus groups or interviews allow exploration of nuanced opinions, uncovering the motivations and emotional responses driving the quantitative findings. For instance, the interviews might reveal that the policy’s appeal stems from its perceived impact on job security, a factor not directly measured in the poll itself.
Finally, I integrate both datasets. Discrepancies between the two sets of data highlight areas needing further investigation. This iterative process of exploring both quantitative patterns and qualitative insights ensures a robust and comprehensive understanding of public opinion.
Q 9. What statistical software are you proficient in (e.g., R, SPSS, SAS)?
I’m highly proficient in several statistical software packages crucial for political polling analysis. My expertise includes R, SPSS, and SAS. R is my go-to for complex statistical modeling and data visualization, particularly when dealing with large datasets and advanced analyses. I use SPSS for its user-friendly interface and its strength in handling survey data and performing descriptive statistics. SAS is invaluable for its robust capabilities in data management and its extensive library of statistical procedures, particularly useful for handling large-scale, complex data analysis projects.
I leverage the strengths of each package based on the specific needs of a project. For instance, I’d likely use R for creating sophisticated visualizations and modeling voter turnout based on various socioeconomic factors. SPSS might be preferred for quickly generating summary statistics and analyzing responses to specific survey questions, providing easily understandable tables and charts for client presentations.
Q 10. Describe your experience with data visualization and presenting findings to clients or stakeholders.
Data visualization is paramount in communicating polling results effectively. I create clear, concise, and engaging visuals that translate complex data into readily digestible information for both expert and lay audiences. My repertoire includes a wide range of chart types – bar charts, pie charts, line graphs, maps, and more – strategically selected to highlight key findings. I also utilize interactive dashboards for more dynamic presentations.
For example, during a recent campaign, I used a series of interactive maps to show regional variations in candidate support, clearly demonstrating areas needing targeted outreach. These visual aids were instrumental in shaping the campaign’s strategy. I always tailor my presentation style to the audience; for academics, I might emphasize statistical significance and methodological details, while for political campaigns, the focus is on clear, actionable insights.
Q 11. How do you interpret and report poll results to different audiences (e.g., political campaign, media)?
Tailoring the message is key when reporting poll results. A political campaign needs actionable strategies, while media outlets require concise, compelling narratives.
For a political campaign, I focus on identifying key strengths and weaknesses, highlighting areas for strategic intervention. I’d present data on voter demographics, candidate favorability, and issue salience, offering concrete recommendations for campaign messaging and resource allocation. The language is direct and action-oriented, avoiding jargon.
When communicating with the media, I emphasize the ‘story’ within the data, focusing on the most newsworthy findings. I provide clear and concise summaries of key results, offering context and avoiding overly technical details. I also anticipate potential questions and prepare clear, non-biased responses, emphasizing data accuracy and limitations.
Q 12. Explain the importance of question wording and order in survey design.
Question wording and order are crucial in preventing bias and ensuring accurate responses. Even subtle changes can significantly impact results. For example, asking ‘Do you support increased taxes to fund education?’ versus ‘Do you support investing in education through increased taxes?’ can significantly alter responses due to the framing.
I use established best practices, such as pre-testing questions on a small sample to identify any ambiguity or bias. I carefully craft neutral wording, avoiding loaded language or leading questions. Order effects are also crucial; questions asked early can influence responses to subsequent questions. I carefully sequence questions to minimize potential bias, often employing randomization techniques.
Q 13. How do you ensure the confidentiality and anonymity of respondents in political polls?
Protecting respondent confidentiality and anonymity is paramount. I employ several strategies to ensure this. First, I utilize anonymous survey platforms that do not collect personally identifiable information unless explicitly consented to. Second, data are de-identified—meaning any personal identifiers are removed or replaced with unique codes before analysis. Third, all data are securely stored and accessed only by authorized personnel. Finally, I always obtain informed consent from participants before data collection, clearly outlining how their data will be handled and protected.
Maintaining ethical standards and respecting respondent privacy is not merely a legal requirement but a cornerstone of maintaining public trust in polling.
Q 14. Describe a time you had to deal with unexpected challenges during a political polling project.
During a recent gubernatorial race, we faced a significant challenge shortly before the election. A major news outlet published a seemingly contradictory poll with drastically different results from ours. This created confusion and potentially undermined our client’s confidence.
Our response involved a multi-pronged approach. First, we thoroughly reviewed our methodology, identifying any potential sources of error. We found no flaws in our sampling or data analysis. Second, we investigated the other poll’s methodology, uncovering some significant weaknesses, including a biased sample and questionable weighting techniques. Third, we transparently communicated our findings to our client, explaining our confidence in our results while acknowledging the conflicting data. We also prepared a detailed report explaining the methodological differences, helping our client navigate the conflicting information.
Ultimately, our initial poll results proved more accurate, confirming the importance of rigorous methodology and transparent communication in navigating unexpected challenges.
Q 15. How do you stay updated on the latest trends and developments in political polling methodologies?
Staying current in the dynamic field of political polling requires a multi-pronged approach. I regularly subscribe to and actively read peer-reviewed academic journals focusing on survey methodology and political science. These journals often publish cutting-edge research on new sampling techniques, weighting adjustments, and data analysis methods. Beyond academia, I follow prominent polling organizations like the Pew Research Center and Gallup, analyzing their methodologies and reports for innovative approaches and best practices. Furthermore, I attend conferences and webinars hosted by professional organizations such as the American Association for Public Opinion Research (AAPOR), where experts present their latest findings and discuss emerging challenges. Finally, I maintain a network of colleagues in the field, engaging in regular discussions and knowledge sharing to stay abreast of the latest trends and breakthroughs. This holistic strategy ensures my methodologies remain robust and relevant.
Career Expert Tips:
- Ace those interviews! Prepare effectively by reviewing the Top 50 Most Common Interview Questions on ResumeGemini.
- Navigate your job search with confidence! Explore a wide range of Career Tips on ResumeGemini. Learn about common challenges and recommendations to overcome them.
- Craft the perfect resume! Master the Art of Resume Writing with ResumeGemini’s guide. Showcase your unique qualifications and achievements effectively.
- Don’t miss out on holiday savings! Build your dream resume with ResumeGemini’s ATS optimized templates.
Q 16. Explain your understanding of different types of political polls (e.g., tracking polls, exit polls).
Political polls serve various purposes and employ different designs. Tracking polls, for instance, repeatedly survey the same population over time to monitor shifts in opinions, allowing campaigns to gauge the effectiveness of their strategies. Imagine it like taking your temperature repeatedly to monitor a fever; tracking polls provide a continuous snapshot of public sentiment. Exit polls, on the other hand, survey voters as they leave their polling places on election day. These provide immediate insights into voter demographics and candidate choices, offering a ‘quick count’ before official tallies are released. Pre-election polls are conducted in the lead-up to an election to gauge voter preferences and predict election outcomes. These can use various methodologies, such as random sampling of registered voters or specific demographics. Push polls, while controversial due to their manipulative nature, aim to influence voters under the guise of research by asking biased questions. Understanding these different types is crucial for interpreting poll results accurately and understanding their limitations.
Q 17. How do you assess the credibility and reliability of other political polls?
Assessing the credibility of a political poll involves a rigorous evaluation process. First, I examine the sampling methodology – was the sample representative of the target population? A small, biased sample will yield unreliable results. Next, I scrutinize the question wording. Subtle changes in wording can significantly impact responses. Leading or biased questions compromise the poll’s objectivity. I also look at the margin of error and sample size. Larger sample sizes generally lead to smaller margins of error, indicating higher precision. Finally, I review the pollster’s reputation and transparency. Reputable polling organizations publicly release their methodologies and data, allowing for independent verification. Considering these factors helps determine a poll’s trustworthiness and aids in avoiding misleading information. For example, a poll with a high margin of error and unclear methodology would be treated with caution.
Q 18. Describe your experience with predictive modeling in political polling.
Predictive modeling plays a significant role in my work. I utilize statistical techniques, such as regression analysis and machine learning algorithms, to build models that forecast election outcomes based on historical data, current polling data, and relevant demographic factors. For instance, I might use a logistic regression model to predict the probability of a candidate winning based on their polling numbers, fundraising totals, and past electoral performance in various regions. The accuracy of these models depends heavily on the quality and quantity of input data. Regularly refining these models, considering new variables, and accounting for potential biases is key to their effectiveness. Model validation and rigorous testing are crucial to ensure the predictions are reliable and not merely a reflection of inherent bias in the data.
Q 19. How do you incorporate demographic data into your analysis?
Demographic data is integral to political polling analysis. We use it to understand voter behavior and to identify subgroups within the population with different political preferences. By segmenting the data by age, race, ethnicity, income, education, and geographic location, we can create more precise predictions. For instance, we might find that support for a specific candidate is higher among younger voters or within certain ethnic groups. This granular analysis allows campaigns to tailor their messaging and strategies to reach specific demographic segments effectively. Weighting is often applied to adjust for over- or under-representation of specific demographic groups in the sample, ensuring a more accurate reflection of the overall population.
Q 20. What are some ethical considerations in conducting political polling?
Ethical considerations are paramount in political polling. Protecting respondent privacy is crucial; data should be anonymized and handled securely. Transparency in methodology is essential for maintaining public trust; the process should be clearly documented and made available. Avoiding biased questions is critical to ensure objective results. The phrasing of questions must be neutral and unbiased to avoid influencing respondent answers. Properly disclosing funding sources ensures transparency and minimizes the risk of conflicts of interest. Finally, avoiding the use of polls for manipulative purposes – like push polls – is ethically paramount. Adhering to these principles is not only ethically responsible but also vital for ensuring the integrity and credibility of polling results.
Q 21. How do you handle missing data in a political polling dataset?
Missing data is a common challenge in political polling. Several strategies can be used to address this. Listwise deletion is a simple approach where entire cases with missing values are removed. However, this can lead to a significant loss of data, especially if missingness is not random. Imputation methods replace missing values with estimated values. Common methods include mean/median imputation, regression imputation, or more sophisticated techniques like multiple imputation. The choice of method depends on the nature and pattern of missing data. For example, if missingness is related to other variables, multiple imputation is often preferable. Before any imputation, careful analysis is necessary to understand the mechanism behind missing data to avoid introducing bias. It’s important to document the chosen method and its potential impact on the analysis results.
Q 22. Explain your understanding of sampling techniques such as stratified sampling and cluster sampling.
Sampling techniques are crucial for obtaining representative data in political polling, as surveying an entire population is often impractical. Stratified sampling and cluster sampling are two common methods, each with its strengths and weaknesses.
Stratified Sampling: This involves dividing the population into subgroups (strata) based on relevant characteristics like age, ethnicity, or geographic location. Then, a random sample is drawn from each stratum, ensuring representation from all groups. For example, if we’re polling voter preferences in a city with a diverse population, we might stratify by ethnicity to ensure we get enough responses from each major ethnic group. The proportion of individuals sampled from each stratum should ideally reflect their proportion in the overall population.
Cluster Sampling: This method involves dividing the population into clusters (often geographic areas), randomly selecting some clusters, and then surveying all individuals within the selected clusters. Imagine polling voter opinions across a large state. Instead of trying to survey individuals randomly across the entire state, we could divide the state into counties (clusters), randomly select a few counties, and then poll every voter within those chosen counties. This method is cost-effective, but might lead to less accurate results if the selected clusters aren’t truly representative of the entire population.
The choice between stratified and cluster sampling depends on the research question, available resources, and the nature of the population being studied. Sometimes, a combination of both techniques, known as multi-stage sampling, is used for optimal results.
Q 23. How do you use statistical tests to determine the significance of your findings?
Statistical tests are vital for determining whether the observed results in a political poll are statistically significant, or simply due to chance. We use these tests to assess the level of confidence we can have in our findings. For instance, we might use a t-test to compare the average support for a candidate among two different demographic groups, or a chi-square test to analyze the relationship between voting preference and age.
The p-value is a key output of these tests. A low p-value (typically below 0.05) indicates that the observed difference or relationship is statistically significant – unlikely to have occurred by random chance. This helps us determine whether the differences we see in our poll results reflect real differences in the population, not just random variation in our sample.
Furthermore, we consider the margin of error, which quantifies the uncertainty inherent in estimating a population parameter from a sample. A smaller margin of error indicates greater precision. We always present our findings with their associated margin of error and confidence level (e.g., ‘Candidate A has 55% support, with a margin of error of +/- 3% at a 95% confidence level’).
Q 24. Describe your experience with A/B testing in the context of political communication.
A/B testing, also known as split testing, is a powerful tool in political communication. It allows us to compare the effectiveness of two different versions (A and B) of a communication message – for example, two different campaign slogans, website designs, or email subject lines. We randomly assign different segments of the target audience to receive each version and then track the responses.
In a recent campaign, we used A/B testing to compare two different versions of a campaign advertisement. Version A focused on the candidate’s experience, while Version B highlighted their policy proposals. By tracking click-through rates, engagement metrics, and ultimately, donations or volunteer sign-ups, we could determine which version resonated more effectively with the target demographic. The results informed our subsequent messaging strategy, allowing us to optimize our communication for maximum impact.
The key to successful A/B testing lies in proper randomization, a sufficiently large sample size to avoid statistically insignificant results, and careful selection of metrics to track the impact of the different versions. Ethical considerations are also important – ensuring that testing does not mislead or manipulate the audience.
Q 25. How do you manage and analyze large datasets from political polls?
Analyzing large datasets from political polls requires sophisticated tools and techniques. We typically rely on statistical software packages such as R or SPSS, along with programming languages like Python, to handle the data efficiently.
The process involves several stages: Data Cleaning (handling missing values, correcting errors, and ensuring consistency), Data Transformation (creating new variables, recoding existing ones), Exploratory Data Analysis (summarizing data, visualizing patterns, and identifying potential outliers), and Statistical Modeling (applying appropriate statistical tests to answer the research questions). We also leverage data visualization techniques to communicate findings in a clear and compelling way to both technical and non-technical audiences.
For instance, using R, we can load large polling datasets (CSV or other formats), clean and filter them, perform regressions to analyze relationships between different variables (e.g., voter age and candidate preference), and generate visualizations like bar charts, scatter plots, and maps illustrating the results.
# Example R code (simplified) # Load data data <- read.csv('poll_data.csv') # Filter data for a specific demographic subset <- subset(data, age > 35) # Perform a regression analysis model <- lm(vote ~ age + income, data = subset) # Summarize the model summary(model)Q 26. What are some key factors to consider when designing a successful political polling strategy?
Designing a successful political polling strategy requires careful consideration of several key factors:
- Clear Objectives: Define the specific information you need to obtain from the poll. What questions are you trying to answer? What decisions will be made based on the results?
- Target Population: Accurately define the population you are interested in surveying (e.g., registered voters, likely voters). This will guide your sampling strategy.
- Sampling Method: Select an appropriate sampling method (as discussed earlier) to ensure a representative sample that minimizes sampling bias.
- Questionnaire Design: Craft clear, unbiased, and easy-to-understand questions. Pilot test the questionnaire to identify any potential problems before the main survey.
- Sample Size: Determine the appropriate sample size to achieve the desired level of precision and accuracy. Larger samples generally yield more precise estimates but are more costly.
- Data Collection Method: Choose a data collection method (e.g., telephone, online, in-person) that is appropriate for your target population and budget.
- Data Analysis Plan: Develop a plan for analyzing the data, including the statistical tests you will use to answer your research questions.
- Budget and Timeline: Establish a realistic budget and timeline for all aspects of the polling process.
Failing to consider any of these factors can compromise the validity and reliability of the poll results, leading to potentially misleading conclusions.
Q 27. How do you interpret and explain complex statistical concepts to non-technical audiences?
Communicating complex statistical concepts to non-technical audiences requires clear and concise language, avoiding jargon as much as possible. I use analogies, visuals, and storytelling to make the information relatable and easy to grasp. For example, instead of saying 'the p-value was 0.03,' I might explain it as: 'There's only a 3% chance that the results we saw were due to random chance; it's very likely that the trend is real.'
Visual aids such as charts and graphs are invaluable. A simple bar chart showing the percentage of support for different candidates is much more accessible than a table of raw data. I also use storytelling to illustrate the findings, connecting the data to real-world implications and the lives of the people affected. For instance, explaining how a particular policy preference might impact someone’s access to healthcare or education.
Furthermore, it’s crucial to focus on the 'so what?' – the practical implications of the findings and how they inform decision-making. By emphasizing the relevance of the results to the audience's interests and concerns, I ensure that the complex statistical concepts are not only understood but also appreciated.
Key Topics to Learn for Political Polling Interview
- Public Opinion and Survey Methodology: Understanding sampling techniques, questionnaire design, and data collection methods crucial for accurate polling.
- Data Analysis and Interpretation: Practical application of statistical analysis to interpret polling data, identifying trends and drawing meaningful conclusions. This includes understanding margins of error and confidence intervals.
- Political Communication and Messaging: Analyzing how different messages resonate with various demographics and crafting effective communication strategies based on polling data.
- Campaign Strategy and Targeting: Utilizing polling data to inform campaign decisions, such as resource allocation, message tailoring, and identifying key voter segments.
- Predictive Modeling and Forecasting: Exploring advanced statistical techniques to predict election outcomes and assess the impact of different factors.
- Ethical Considerations in Polling: Understanding the ethical implications of polling practices, including bias avoidance and responsible data handling.
- Technological Proficiency: Familiarity with relevant software and tools used in data analysis and visualization within the field.
Next Steps
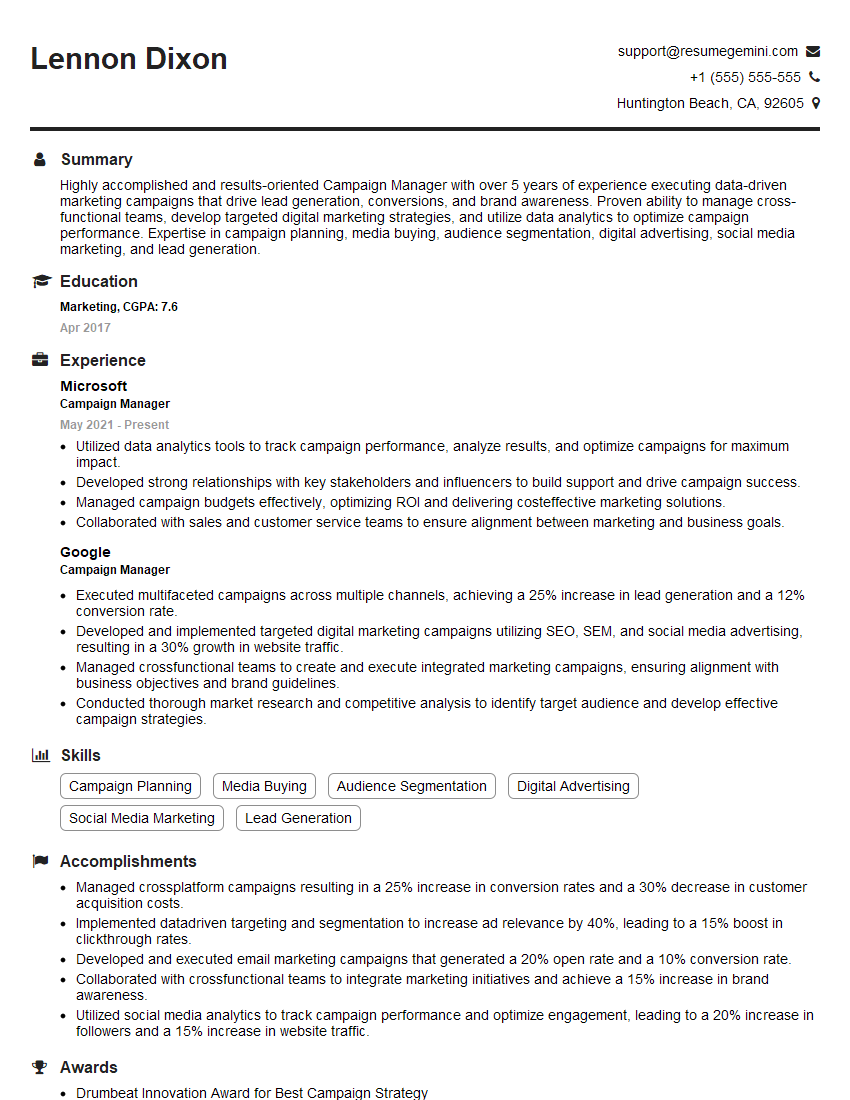
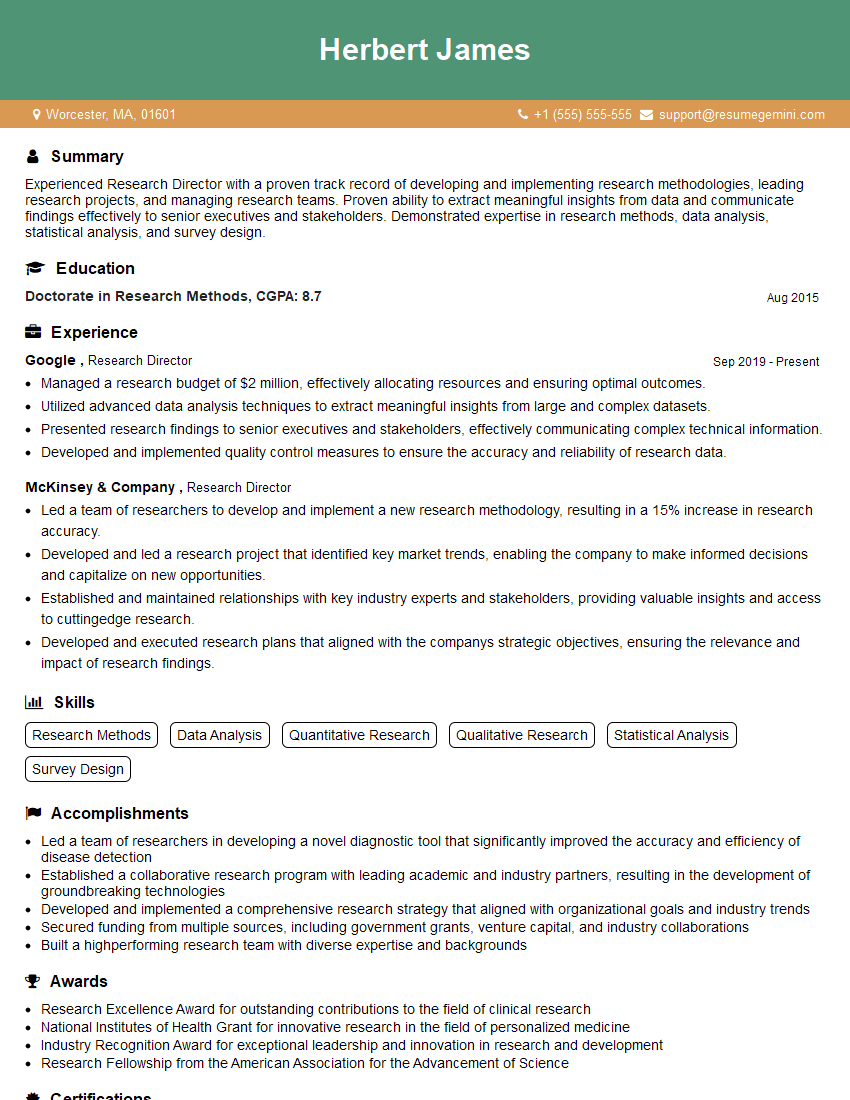
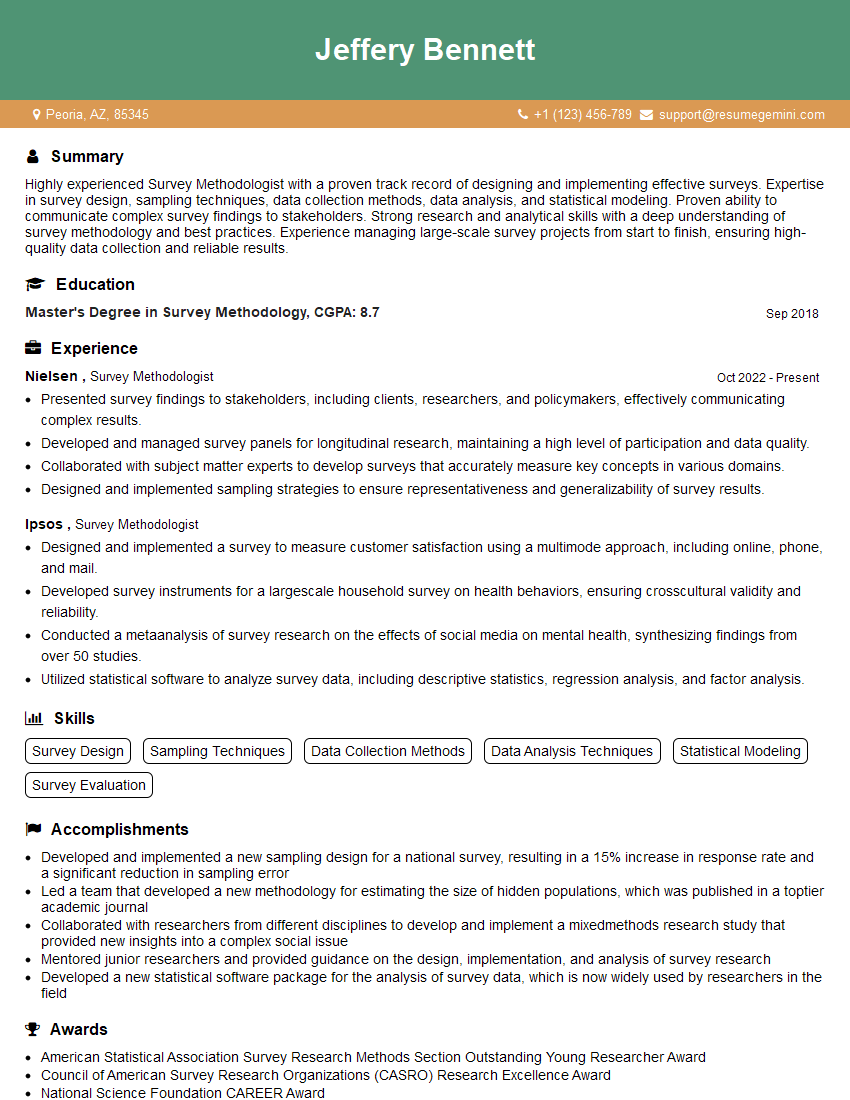
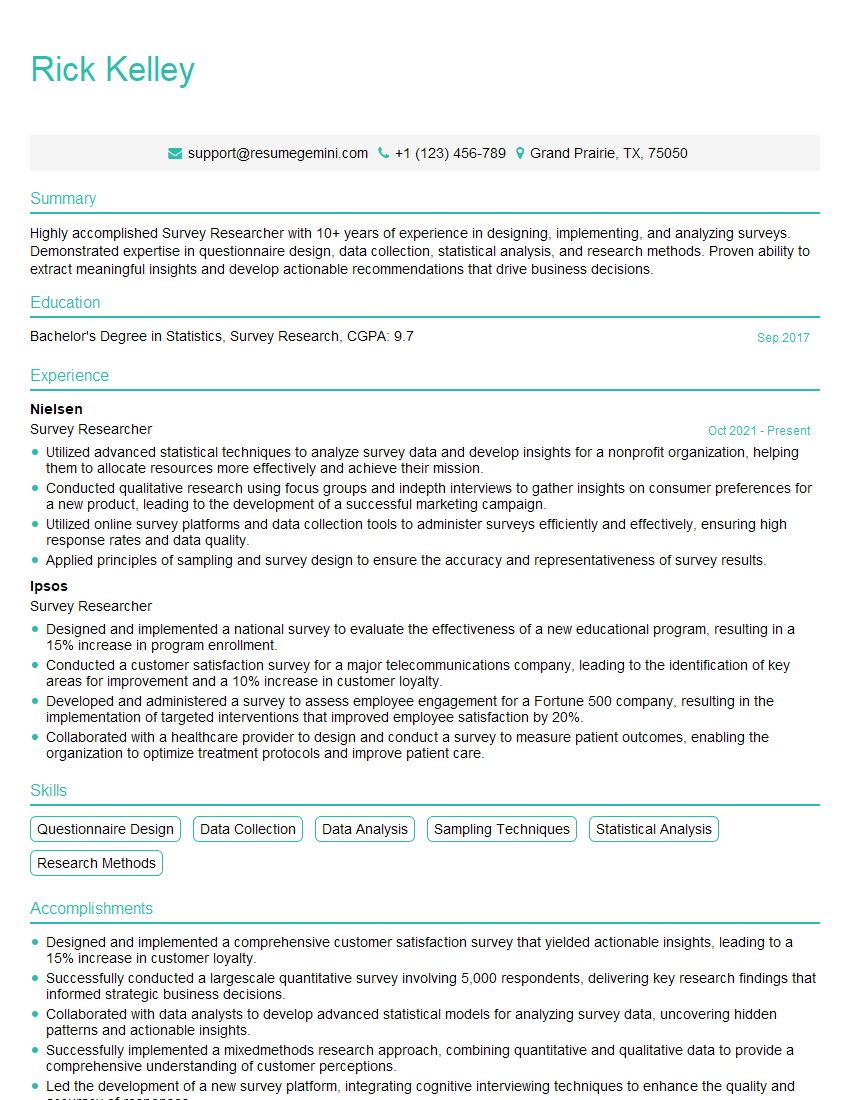
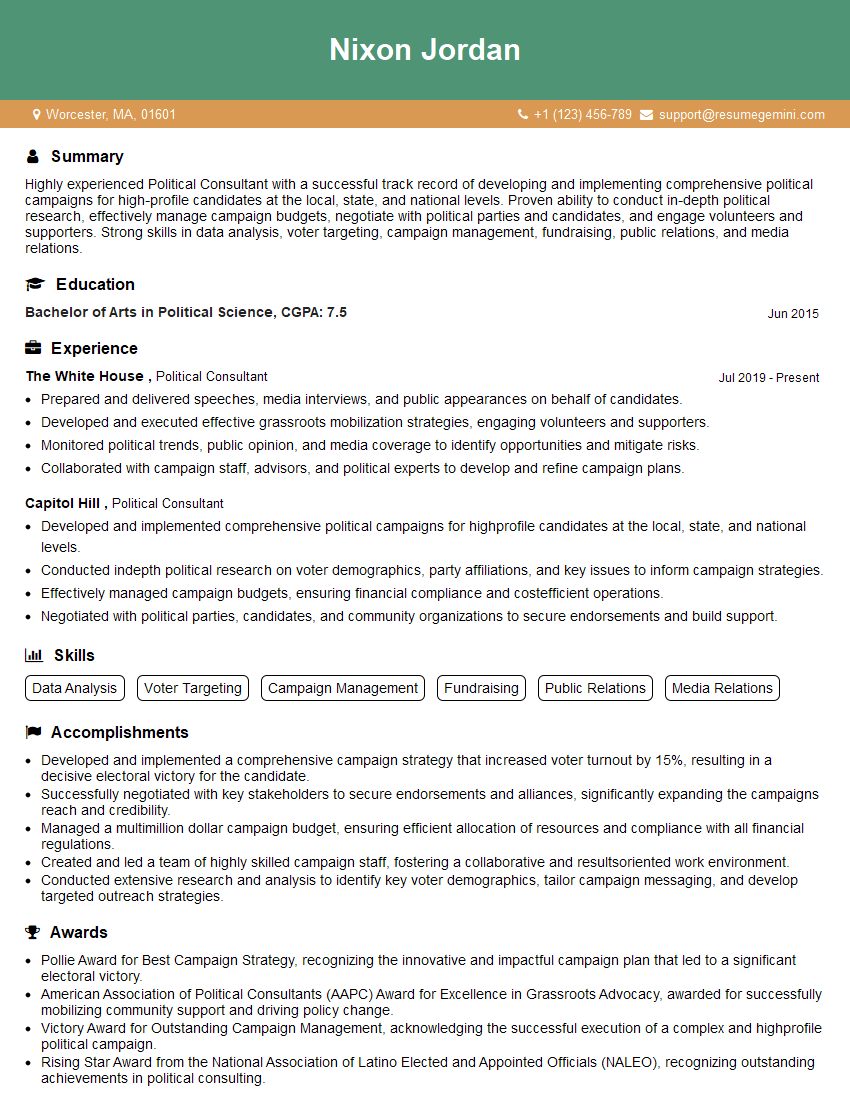
Mastering political polling opens doors to exciting and impactful careers in campaign management, political consulting, market research, and more. Your expertise in understanding public opinion and shaping political narratives is highly valuable. To significantly boost your job prospects, creating a strong, ATS-friendly resume is crucial. ResumeGemini is a trusted resource to help you build a professional resume that showcases your skills and experience effectively. We provide examples of resumes tailored to the Political Polling field to guide you in crafting a compelling application. Take the next step towards your dream career – build your resume with ResumeGemini today!


Explore more articles
Users Rating of Our Blogs
Share Your Experience
We value your feedback! Please rate our content and share your thoughts (optional).
What Readers Say About Our Blog
To the interviewgemini.com Webmaster.
Very helpful and content specific questions to help prepare me for my interview!
Thank you
To the interviewgemini.com Webmaster.
This was kind of a unique content I found around the specialized skills. Very helpful questions and good detailed answers.
Very Helpful blog, thank you Interviewgemini team.