Cracking a skill-specific interview, like one for Political Demography, requires understanding the nuances of the role. In this blog, we present the questions you’re most likely to encounter, along with insights into how to answer them effectively. Let’s ensure you’re ready to make a strong impression.
Questions Asked in Political Demography Interview
Q 1. Explain the relationship between population density and voting patterns.
Population density, the number of people per unit area, often correlates with voting patterns, though the relationship isn’t always straightforward. Highly populated urban areas tend to exhibit different voting behaviors compared to less densely populated rural areas. This is due to several factors:
- Socioeconomic disparities: Urban areas often have a more diverse socioeconomic landscape, with a wider range of incomes, occupations, and education levels, leading to a more diverse range of political viewpoints.
- Cultural differences: Urban and rural areas can have vastly different cultural norms and values which impact voting preferences. Urban areas may be more tolerant of progressive policies while rural areas might favor conservative stances.
- Political organization: Political parties and campaigns often tailor their strategies to specific population densities. Grassroots campaigns are more feasible in less dense areas, while large-scale media campaigns are more effective in densely populated regions.
For example, in many developed nations, urban centers tend to vote more liberally, while rural areas lean more conservatively. However, this is a generalization and exceptions exist, influenced by factors like ethnic composition or specific local issues. The relationship requires careful consideration of other demographic variables to provide a complete picture.
Q 2. How do demographic shifts influence electoral outcomes?
Demographic shifts, changes in the size, composition, and distribution of a population, significantly influence electoral outcomes. These shifts can alter the electorate’s size and its political leanings. For instance:
- Aging population: An increase in the elderly population might favor candidates promoting policies beneficial to senior citizens, such as social security or Medicare.
- Ethnic changes: Growth in specific ethnic groups can change the political landscape, as these groups may share distinct political preferences. For example, a rise in the Hispanic population in a region could sway elections towards candidates who champion issues of importance to the Hispanic community.
- Geographic migration: Movement of people between states or regions can alter the political balance of power. A significant influx of people with particular political affiliations into a region can drastically shift its voting patterns.
- Generational shifts: Younger generations often hold differing political views than older generations. As younger voters become a larger segment of the electorate, their priorities and preferences increasingly influence election results.
Analyzing these shifts allows political strategists to predict future electoral outcomes and adjust their campaign strategies accordingly. For example, campaigns may prioritize outreach to growing demographic segments or adapt their messaging to reflect the concerns of these groups.
Q 3. Describe different methods used to collect and analyze political demographic data.
Collecting and analyzing political demographic data involves various methods:
- Census data: National censuses provide comprehensive data on population size, age, ethnicity, income, education, and other key variables. This is a fundamental source of information.
- Voter registration records: These records, maintained at the state or local level, offer data on registered voters, including their age, address, and sometimes party affiliation.
- Surveys and polls: Public opinion polls and targeted surveys collect data on voter preferences and attitudes on various political issues. These can be crucial in understanding voter sentiment.
- Commercial data providers: Companies like Experian or Nielsen collect and aggregate demographic and consumer data that can be used for political analysis. This data is often more granular than government data but comes at a cost.
- Social media analytics: Social media activity can offer insights into public opinion, although caution is needed to avoid bias and ensure data validity.
Data analysis techniques range from simple descriptive statistics to sophisticated statistical modeling, including regression analysis and machine learning, to identify relationships and trends.
Q 4. What are the key challenges in using demographic data for political forecasting?
Using demographic data for political forecasting presents several key challenges:
- Data limitations: Data may not always be accurate, complete, or up-to-date. Census data, for example, can be outdated by the time an election occurs.
- Unpredictability of voter behavior: Voters’ decisions are influenced by many factors beyond demographics, including candidate appeal, current events, and campaign effectiveness. Demographics only provide a partial picture.
- Interpreting correlations versus causation: Identifying correlations between demographic characteristics and voting patterns doesn’t necessarily mean causation. Other unmeasured factors could be at play.
- Bias and misrepresentation: Data can be misinterpreted or used to create biased predictions. Careful attention to methodological rigor is crucial.
- Privacy concerns: Using personal demographic data raises significant privacy issues, requiring careful adherence to ethical guidelines and legal regulations.
Addressing these challenges requires a multi-faceted approach, incorporating multiple data sources, rigorous statistical analysis, and a nuanced understanding of the limitations of the data.
Q 5. How can you use demographic data to target specific voter groups in a campaign?
Demographic data is invaluable for targeting specific voter groups in a campaign. This involves a multi-step process:
- Identify key demographics: Determine which demographic segments are most likely to support a candidate. For example, a candidate might prioritize outreach to young voters, women, or specific ethnic groups depending on the issue and region.
- Segment the electorate: Divide the electorate into distinct groups based on demographic characteristics and political preferences.
- Develop tailored messaging: Create customized messages that resonate with each targeted segment. The language, imagery, and policy focus should be adjusted based on the demographic group’s values and concerns.
- Choose appropriate channels: Select communication channels that effectively reach each targeted group. This could involve social media, direct mail, radio ads, or community events.
- Monitor effectiveness: Track the campaign’s success in reaching and influencing the targeted groups using metrics such as voter turnout, donation rates, or social media engagement.
For example, a campaign might use direct mail to reach older voters who are more likely to respond to this method, while employing social media to engage young voters. This strategy requires careful understanding of each demographic group’s preferred media consumption habits.
Q 6. Discuss the role of GIS in political demographic analysis.
Geographic Information Systems (GIS) are powerful tools for political demographic analysis. They allow for the visualization and spatial analysis of demographic data, providing a deeper understanding of how demographic factors are geographically distributed and how they influence election outcomes.
- Mapping demographic variables: GIS can create maps showing the spatial distribution of various demographic variables like age, ethnicity, income, and voter registration, enabling identification of key demographics in specific areas.
- Spatial analysis: GIS facilitates spatial analysis techniques to uncover relationships between demographic factors and voting patterns within a given geographical area. For example, it can identify areas with high concentrations of specific demographic groups and analyze their voting history.
- Election result visualization: GIS enables the visualization of election results at various geographic scales, showing how different demographic groups voted in different regions.
- Predictive modeling: Combining demographic data with GIS, predictive modeling can forecast election outcomes based on spatial patterns and demographic trends.
In essence, GIS transforms raw demographic data into easily interpretable visualizations, providing a comprehensive geographical context that greatly enhances political analysis and campaign strategy.
Q 7. Explain the concept of gerrymandering and its impact on election results.
Gerrymandering is the practice of manipulating electoral district boundaries to favor a particular political party or group. It involves strategically drawing district lines to concentrate the opposing party’s voters in a few districts, thus maximizing the number of seats the gerrymandering party can win with a smaller percentage of the overall vote.
The impact on election results can be significant. Gerrymandering can:
- Reduce competitiveness: It makes many districts less competitive, leading to fewer close elections and reduced voter turnout, as voters in safe districts may feel their vote doesn’t matter.
- Distort representation: The resulting legislative body may not accurately reflect the preferences of the overall electorate, as a party might control a disproportionate number of seats despite receiving a smaller percentage of the total votes.
- Suppress minority representation: Gerrymandering can be used to dilute the voting power of minority groups, making it harder for them to elect representatives who represent their interests.
Various legal challenges exist against gerrymandering, often focusing on whether it violates the principle of equal representation and the right to vote. The fight against gerrymandering often involves complex legal battles and calls for independent redistricting commissions to ensure fairness and transparency in the process.
Q 8. How do you assess the reliability and validity of different demographic data sources?
Assessing the reliability and validity of demographic data sources is crucial for accurate political analysis. Reliability refers to the consistency of the data; would we get similar results if we repeated the measurement? Validity refers to whether the data actually measures what it intends to measure. We evaluate this through several steps:
- Source Credibility: We examine the reputation and methodology of the data provider. Government census data, for example, generally enjoys high reliability and validity due to rigorous methodologies and extensive quality control, compared to a hastily conducted online poll.
- Data Collection Methods: The method significantly influences reliability and validity. Random sampling techniques generally yield more valid data than convenience sampling (e.g., only surveying people at a particular location). Survey question wording also matters; poorly phrased questions can skew results.
- Sampling Error: All surveys have some margin of error. We assess the sample size and the confidence interval to understand the potential range of error. A larger sample size generally leads to a smaller margin of error, improving reliability.
- Data Cleaning and Validation: Identifying and correcting inconsistencies and errors (outliers, missing data) in the raw data is essential for improving both reliability and validity. This might involve techniques like imputation for missing values or outlier removal.
- Triangulation: Comparing data from multiple independent sources can help increase confidence in the findings. If different data sources tell a similar story, it strengthens the validity of the conclusions.
For instance, comparing voter registration data from a state election commission with self-reported voting data from a public opinion poll can reveal discrepancies and help assess the reliability of each source. Ultimately, a critical evaluation of these factors informs our understanding of the data’s fitness for the intended political analysis.
Q 9. What are the ethical considerations in using demographic data for political purposes?
Ethical considerations in using demographic data for political purposes are paramount. Misuse can have significant negative consequences. Key ethical considerations include:
- Privacy and Confidentiality: Data should be anonymized and protected to prevent the identification of individuals. Protecting sensitive personal information, such as ethnicity or religious affiliation, is crucial. Data breaches can have serious repercussions.
- Informed Consent: Individuals should be informed about how their data will be used and give their explicit consent before participation. Deception or coercion is unethical.
- Avoidance of Bias and Discrimination: Data should be used responsibly to avoid reinforcing existing societal biases or enabling discrimination. For example, using demographic data to target specific groups with negative political messaging is unethical.
- Transparency and Accountability: The methodology used for data collection and analysis should be transparent, and the findings should be presented honestly and without manipulation. Any limitations of the data should be openly acknowledged.
- Data Security: Safeguarding data from unauthorized access or misuse is crucial. Robust security measures are needed to prevent data breaches and protect the privacy of individuals.
For example, using ethnicity data to micro-target voters with divisive campaign ads raises serious ethical concerns. Responsible use requires careful consideration of all these factors to ensure fairness and prevent harm.
Q 10. Describe a statistical model you’ve used to analyze political demographic data.
I frequently use regression models to analyze political demographic data. Specifically, I’ve extensively utilized multivariate logistic regression to model voter choice. This model allows us to predict the probability of an individual voting for a particular candidate or party based on multiple demographic variables.
For example, I might use data from a national election to predict vote choice based on age, gender, race, education level, income, and geographic location. The model would estimate the effect of each variable on the probability of voting for a specific candidate, while controlling for the effects of other variables.
# Example (Conceptual R code):model <- glm(vote_choice ~ age + gender + race + education + income + location, data = election_data, family = binomial)summary(model)
This outputs coefficients for each demographic variable, indicating their relative impact on vote choice. A positive coefficient suggests that increasing the value of that variable (e.g., higher income) increases the probability of voting for the candidate in question, while controlling for the other variables. The model's overall accuracy can be assessed using metrics like AUC (Area Under the ROC Curve).
Q 11. How do you interpret correlation versus causation in political demographic data?
Correlation and causation are fundamental concepts in political demography. Correlation simply indicates a relationship between two variables – when one changes, the other tends to change as well. Causation, however, implies that one variable directly influences the other. Correlation does not equal causation.
For example, we might find a correlation between higher levels of education and voting for a particular party. This does not automatically mean that higher education causes individuals to vote for that party. Other factors, like socioeconomic status or geographic location, could be influencing both education levels and voting patterns. To establish causation, we need to consider other potential confounding variables and utilize methods like randomized controlled trials or instrumental variables.
In political demography, we often observe correlations that are suggestive of causal relationships but require further investigation. Advanced statistical techniques, such as regression analysis with control variables and causal inference methods, help to disentangle the complex interplay of factors and potentially identify causal effects.
Q 12. Explain the concept of voter turnout and its demographic determinants.
Voter turnout is the percentage of eligible voters who participate in an election. It's a crucial indicator of democratic health. Many demographic factors significantly influence voter turnout:
- Age: Older voters typically exhibit higher turnout rates than younger voters.
- Education: Higher levels of education are generally associated with increased voter participation.
- Income: Higher income individuals tend to vote more often.
- Race and Ethnicity: Turnout rates vary across different racial and ethnic groups; historical and ongoing systemic barriers contribute to disparities.
- Geographic Location: Turnout rates can differ significantly across regions and localities due to factors such as political culture and the competitiveness of elections.
- Political Engagement: Individuals who are more politically engaged (e.g., through party affiliation, volunteering, or following political news) tend to vote at higher rates.
Understanding these determinants is crucial for designing effective voter mobilization strategies. Targeting specific demographic groups with tailored outreach efforts can increase overall participation.
Q 13. What are the limitations of using demographic data alone in predicting political behavior?
While demographic data provides valuable insights into potential voting patterns, relying solely on it to predict political behavior is insufficient and can be misleading. Several limitations exist:
- Oversimplification: Demographics only capture a limited aspect of an individual's political attitudes and behaviors. They don't account for the complexity of individual beliefs, values, and experiences.
- Ignoring Context: Political behavior is also shaped by broader political contexts such as the current political climate, media coverage, and specific campaign strategies. Demographic data alone cannot capture these dynamics.
- Ignoring Individual-Level Variations: Even within specific demographic groups, there's considerable heterogeneity in political opinions and behavior. Aggregated demographic data masks this variation.
- Unforeseen Events: Unforeseeable events (e.g., economic crises, major scandals) can significantly shift voter preferences and turnout, which demographic models might not predict.
Effective prediction necessitates integrating demographic data with other information such as public opinion polls, media sentiment analysis, and even social media activity to build a more comprehensive understanding of voter behavior.
Q 14. How can you account for sampling bias in political demographic surveys?
Sampling bias occurs when the sample used in a survey doesn't accurately represent the population of interest. This can lead to skewed results and inaccurate conclusions. Several methods can mitigate sampling bias in political demographic surveys:
- Probability Sampling Techniques: Employing methods like simple random sampling, stratified sampling (ensuring representation from different subgroups), or cluster sampling can reduce bias by giving each member of the population a known chance of being selected.
- Weighting: Adjusting the weights assigned to respondents to compensate for over- or under-representation of certain demographic groups in the sample can correct for biases introduced during sampling.
- Post-Stratification: Using known population proportions for different demographic groups to adjust the sample weights after data collection can help reduce sampling bias. This technique uses external data to correct for discrepancies between the sample and the population.
- Careful Sample Design: The design of the survey should carefully consider the characteristics of the population of interest to ensure that the sample is representative. This includes deciding on a suitable sample size and sampling frame.
- Analysis of Non-Response Bias: Examining whether non-response rates differ significantly across demographic groups is essential. If non-response is higher in particular groups, it may suggest bias. Techniques exist to try and account for such bias.
For instance, if a survey under-represents minority groups, appropriate weighting techniques can adjust the analysis to provide more accurate estimates of their political attitudes and behaviors.
Q 15. Discuss the impact of socioeconomic factors on voting patterns.
Socioeconomic factors significantly influence voting patterns. Income, education, occupation, and wealth are all strongly correlated with political preferences. For example, higher-income individuals often lean towards fiscally conservative policies, while lower-income individuals may favor policies that address economic inequality and social welfare. Education level correlates with political engagement and knowledge, impacting voter turnout and choice. Occupation can also play a role, with certain professions (e.g., unionized workers) exhibiting stronger support for specific parties or ideologies. The interplay of these factors is complex and varies across different countries and cultures. For instance, in some nations, religious affiliation may strongly mediate the relationship between socioeconomic status and voting, leading to unexpected patterns.
Understanding these relationships is crucial for political strategists, campaign managers, and policymakers. By analyzing socioeconomic data alongside voting records, we can identify target demographics, tailor messaging, and develop more effective policies. Consider the impact of a proposed tax cut: an analysis showing it disproportionately benefits higher-income voters could influence the debate surrounding its passage.
Career Expert Tips:
- Ace those interviews! Prepare effectively by reviewing the Top 50 Most Common Interview Questions on ResumeGemini.
- Navigate your job search with confidence! Explore a wide range of Career Tips on ResumeGemini. Learn about common challenges and recommendations to overcome them.
- Craft the perfect resume! Master the Art of Resume Writing with ResumeGemini's guide. Showcase your unique qualifications and achievements effectively.
- Don't miss out on holiday savings! Build your dream resume with ResumeGemini's ATS optimized templates.
Q 16. Explain the difference between descriptive and predictive modeling in political demography.
Descriptive modeling in political demography focuses on summarizing and characterizing existing data. It answers the 'what' questions: What are the demographics of our electorate? What is the voter turnout rate in different regions? What are the dominant voting preferences in specific age groups? This type of modeling often involves creating tables, charts, and maps to visually represent the data.
Predictive modeling, on the other hand, seeks to forecast future outcomes based on historical data and observed patterns. It answers the 'what if' questions: What will be the likely outcome of an election based on current demographic trends? How will a change in campaign strategy affect the voting preferences of a specific demographic group? This might involve using statistical techniques like regression analysis, machine learning algorithms, or simulation models.
For example, a descriptive model might show the higher voter turnout in urban areas compared to rural areas. A predictive model might then use this information, along with economic indicators and other relevant variables, to estimate the likely electoral outcome in both urban and rural areas.
Q 17. How do you handle missing data in a political demographic dataset?
Missing data is a common challenge in political demographic analysis. Ignoring it can bias results and lead to inaccurate conclusions. There are several strategies to handle missing data. The best approach depends on the nature and extent of the missingness and the type of analysis being conducted.
One common approach is imputation, which involves filling in the missing values with plausible estimates. Simple methods include replacing missing values with the mean or median of the observed values. More sophisticated methods include multiple imputation, which creates several plausible datasets with different imputed values, allowing for a more robust analysis. Another technique is to use weighting, assigning higher weights to observations with complete data to compensate for the missing information. Finally, analysis techniques such as multiple imputation are used to incorporate uncertainty surrounding the missing data points.
The choice of method needs careful consideration. For instance, if missing data are systematically related to other variables (e.g., wealthier individuals are less likely to participate in surveys), simple imputation methods might be unsuitable; more advanced techniques like multiple imputation or weighting would be preferred. It's always crucial to document the chosen method and justify it based on the specific characteristics of the data.
Q 18. What are some common software packages used in political demographic analysis?
Several software packages are frequently used in political demographic analysis. R and Python are popular choices due to their extensive statistical libraries (e.g., dplyr, tidyr, ggplot2 in R; pandas, scikit-learn, matplotlib in Python). These languages offer flexibility and power for both descriptive and predictive modeling. Statistical Package for the Social Sciences (SPSS) is another widely used package, particularly known for its user-friendly interface and capabilities for survey data analysis.
Specialized GIS software like ArcGIS or QGIS are frequently employed for spatial analysis, visualizing election results geographically, and identifying spatial clusters of voting patterns. Finally, statistical software packages such as Stata also offer advanced statistical modeling capabilities. The specific choice depends on the analyst's expertise, the complexity of the analysis, and the availability of resources.
Q 19. Describe your experience with data visualization techniques for political data.
Data visualization is essential for effectively communicating political demographic findings. I have extensive experience using various techniques to present complex data in an accessible manner. For example, I frequently use choropleth maps to show geographical variations in voter turnout or support for different political parties. These maps use color shading to represent different data values within geographical areas. I also employ bar charts and pie charts to present frequencies and proportions of different demographic groups, scatter plots to visualize relationships between variables, and time-series plots to show trends in voting patterns over time.
Interactive dashboards, often created using tools like Tableau or Power BI, are increasingly useful to allow for dynamic exploration of data and help users interact and manipulate the data to uncover insights.
Effective data visualization requires careful consideration of the audience. I always strive to create clear, concise, and visually appealing graphics that accurately represent the data without misleading the viewer.
Q 20. How do you communicate complex demographic findings to a non-technical audience?
Communicating complex demographic findings to a non-technical audience requires clear and simple language, avoiding jargon. I use analogies and real-world examples to make the information relatable. Instead of saying “the coefficient of determination is 0.7,” I might say “70% of the variation in voting patterns can be explained by the factors we analyzed.”
Visual aids like charts and maps are crucial. A well-designed chart can convey complex information more effectively than paragraphs of text. I also use storytelling techniques to engage the audience, presenting the findings within a narrative context that highlights their significance and implications. For instance, when discussing changes in the electorate's age demographics, I might tie it to shifts in policy priorities or political discourse.
Finally, I encourage questions and discussions to ensure understanding and address any concerns. The goal is not just to present information, but to foster a dialogue that promotes knowledge and informed decision-making.
Q 21. Explain the concept of redistricting and its implications.
Redistricting is the process of redrawing electoral district boundaries. It's a crucial aspect of representative democracy, impacting political representation and the balance of power. Ideally, districts should be roughly equal in population and geographically contiguous. However, the process is often highly politicized, with the party in power frequently manipulating boundaries to favor its own candidates (gerrymandering).
The implications of redistricting are significant. Gerrymandering can create “safe seats” for incumbents, reducing competitiveness and potentially suppressing voter turnout. It can also dilute the voting power of minority groups or create districts with non-contiguous or unnatural shapes, undermining the principle of equal representation. For example, a gerrymandered district might snake across several counties to include pockets of voters who support a particular party, resulting in an artificially inflated majority for that party in that specific district.
Independent commissions or non-partisan criteria are often suggested to make redistricting fairer and more transparent. This aim is to remove partisan influence and ensure that district boundaries reflect the will of the people rather than the interests of a particular political party.
Q 22. How do you incorporate socioeconomic indicators into political demographic models?
Socioeconomic indicators are crucial for understanding the nuances of political behavior. They provide context to demographic trends, revealing why certain groups vote in particular ways. We incorporate these indicators into models by treating them as independent variables that can predict or influence dependent variables like voting patterns or political affiliation.
For example, we might use measures of income inequality (Gini coefficient), education levels (percentage with college degrees), employment rates, and poverty rates. These data points can be integrated into statistical models like regression analysis to assess their relationship with voter turnout, party preference, or support for specific policies. Imagine trying to understand why a certain region consistently votes for a particular party. Simply knowing the age and racial breakdown isn't enough. Analyzing income levels, education, and occupation can reveal underlying socioeconomic factors driving that voting pattern.
In practice, we often use data from sources like the U.S. Census Bureau, the Bureau of Labor Statistics, and academic surveys to acquire this information. The specific methodology depends on the research question, but techniques like multilevel modeling allow us to account for the nested structure of data (individuals within counties, counties within states).
Q 23. Discuss the impact of immigration on the political landscape.
Immigration profoundly impacts the political landscape, influencing everything from electoral outcomes to policy debates. New immigrants often bring different political perspectives, cultural backgrounds, and levels of political engagement, leading to shifts in the electorate's demographics and political preferences.
For instance, immigrant communities may be more inclined to support policies addressing issues relevant to their experiences, such as immigration reform, access to healthcare, or language support. Their political participation can also alter the balance of power in specific regions or within political parties. The long-term integration of immigrants can contribute to the evolution of national identity and political culture, potentially leading to changes in the dominant political ideologies.
However, the impact isn't uniform. The effects of immigration depend on factors like the immigrants' country of origin, their socioeconomic status, their level of assimilation, and the existing political climate in the host country. Understanding these complexities requires a nuanced analysis that goes beyond simple population counts, exploring factors such as voting patterns, political mobilization within immigrant communities, and the responses of the native-born population.
Q 24. How do you analyze the impact of age cohort differences on voting behavior?
Analyzing age cohort differences in voting behavior involves examining how voting patterns vary across different generations. Each cohort – such as Baby Boomers, Generation X, Millennials, and Gen Z – is shaped by its unique historical context, leading to distinct political attitudes and preferences.
We use techniques like cohort analysis, which compares voting patterns across different age groups over time, to isolate generational effects. For instance, we might track the voting behavior of each cohort since their entry into the electorate to observe how their preferences change or remain consistent over their lifetimes. We might also explore the influence of significant historical events on each cohort's political worldview (e.g., the impact of the Vietnam War on the Baby Boomers or the Great Recession on Millennials).
Additionally, we need to account for other demographic and socioeconomic factors, as these can interact with age. For example, we might find that older generations are more likely to vote Republican, but this effect is partly influenced by factors such as higher levels of income and homeownership within those groups. Controlling for these variables allows us to isolate the true impact of age.
Q 25. Explain the challenges of forecasting election results using demographic data alone.
While demographic data provides a valuable foundation for forecasting election results, relying on it alone is inherently limited. Demographic factors like age, race, gender, and location offer insights into potential voting blocs, but they cannot predict individual voting decisions.
Several factors beyond demographics influence election outcomes: candidate characteristics, campaign strategies, policy positions, media coverage, and unpredictable events. These variables are difficult, if not impossible, to quantify precisely. For example, the rise of social media and its influence on shaping public opinion is a relatively recent phenomenon that is hard to incorporate into traditional demographic models.
Moreover, the relationship between demographic variables and voting behavior isn't static; it can change over time. Shifts in public opinion, new social movements, and evolving political party platforms all impact how voters align themselves. Therefore, successful election forecasting models require a more holistic approach integrating demographic data with sophisticated analyses of public opinion polls, economic indicators, and qualitative information about political sentiment.
Q 26. Describe your experience with analyzing qualitative data related to political attitudes.
My experience with analyzing qualitative data related to political attitudes involves using various methods to understand the underlying reasons behind voting behaviors and political opinions. This goes beyond simple quantitative data and delves into the nuances of human perspectives.
I've utilized techniques such as thematic analysis of open-ended survey responses, coding transcripts from focus groups and interviews, and content analysis of political speeches and social media posts. In one project, for instance, I analyzed qualitative data to understand why voters in a particular district held strong opinions about a specific environmental policy. The analysis of their narratives revealed deeply held values, personal experiences, and trust levels in government that significantly influenced their views, going beyond simple demographic categories.
Software like NVivo and Atlas.ti assists in managing and analyzing large qualitative datasets. These tools facilitate the identification of key themes, patterns, and sentiments within the data, allowing for rigorous and systematic qualitative analysis that can then be integrated with quantitative findings for a more complete understanding.
Q 27. How do you identify potential biases in existing political demographic research?
Identifying biases in political demographic research is crucial for ensuring the validity and reliability of our findings. Biases can creep in at various stages of the research process, from data collection to interpretation.
One common bias is sampling bias, where the sample used in the study doesn't accurately represent the population of interest. This can lead to skewed conclusions about the relationship between demographics and political attitudes. For example, a study that only surveys registered voters might miss the perspectives of unregistered individuals, potentially distorting the findings related to voter turnout.
Another potential bias is confirmation bias, where researchers interpret data in a way that confirms their pre-existing beliefs. To mitigate this, rigorous methodologies, transparent reporting of methods, and peer review are essential. Additionally, we must carefully consider the limitations of our data and avoid overgeneralizing the findings. We also strive to use diverse data sources and methods to triangulate our results and identify any inconsistencies which might point to biases.
Q 28. What are the emerging trends in political demographic research?
Several emerging trends are shaping the field of political demographic research. One significant trend is the increased use of big data and advanced statistical techniques to analyze massive datasets containing information from various sources, such as social media, online news, and government records. This enables researchers to identify complex relationships between demographics and political behavior that were previously undetectable.
Another trend is a growing focus on the intersectionality of demographic factors. Researchers are moving beyond examining single demographics in isolation and exploring how multiple factors like race, gender, class, and sexual orientation interact to shape political attitudes and behaviors. For example, a study might investigate the unique political experiences of Black women, accounting for the combined effects of race and gender.
Finally, there's an increasing emphasis on incorporating spatial data and geographic information systems (GIS) to better understand how geographic location and spatial distribution of demographic groups impact political processes. This allows for a more nuanced analysis of regional variations in political attitudes and participation.
Key Topics to Learn for Your Political Demography Interview
- Electoral Geography and Redistricting: Understand the impact of geographic boundaries on voting patterns and the processes involved in redrawing electoral districts. Explore the implications of gerrymandering and its effects on political representation.
- Voting Behavior and Turnout: Analyze factors influencing voter turnout, including demographics, political efficacy, and campaign strategies. Examine models predicting voting behavior and their application in electoral forecasting.
- Public Opinion and Political Attitudes: Explore how demographic factors shape public opinion on various political issues. Learn to interpret survey data and understand the methodologies behind public opinion polls.
- Political Participation and Mobilization: Analyze different forms of political participation beyond voting, such as protests, advocacy groups, and online activism. Understand how demographic characteristics influence participation rates and strategies for mobilization.
- Demographic Change and Political Impacts: Examine the consequences of demographic shifts (e.g., aging populations, migration patterns, ethnic diversity) on political systems and policy-making. Analyze the interplay between demographic trends and political outcomes.
- Data Analysis and Visualization: Develop skills in analyzing large datasets, using statistical software to identify trends and patterns in demographic and electoral data. Practice visualizing your findings effectively to communicate insights clearly.
- Research Methods in Political Demography: Familiarize yourself with quantitative and qualitative research methodologies commonly used in this field. Understand the strengths and limitations of different approaches.
Next Steps
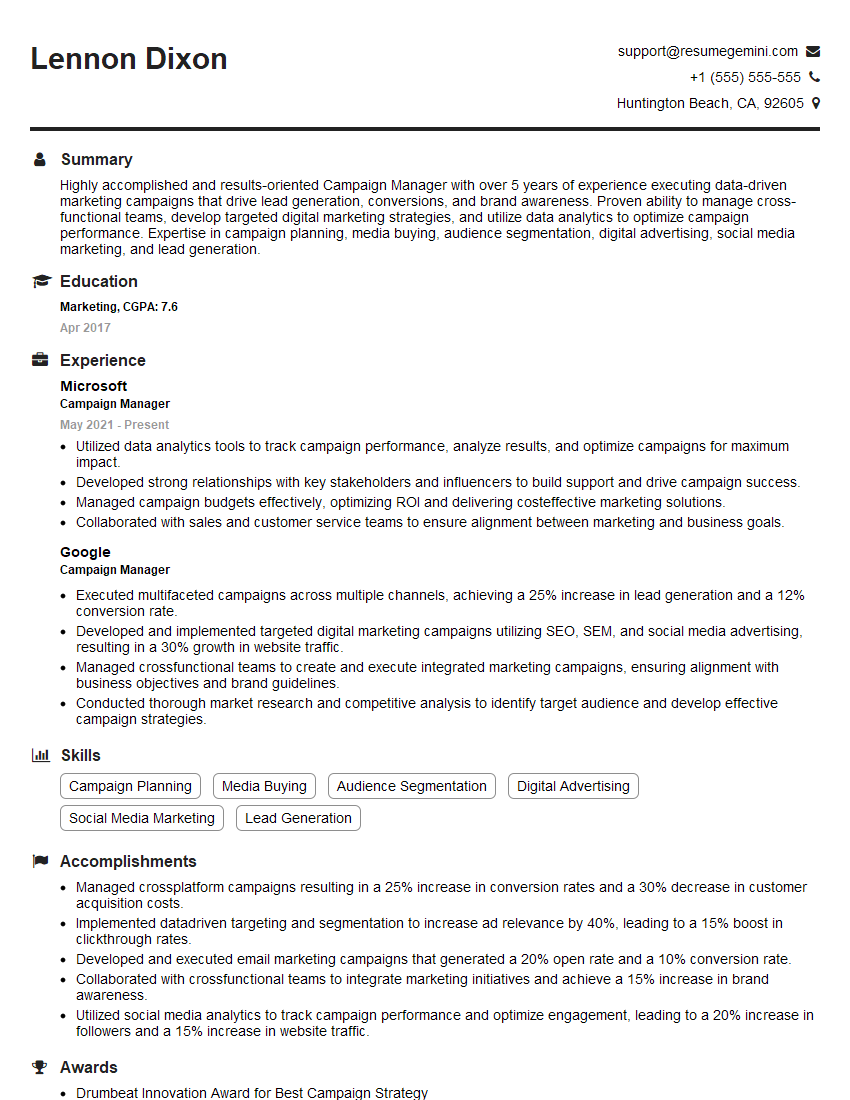
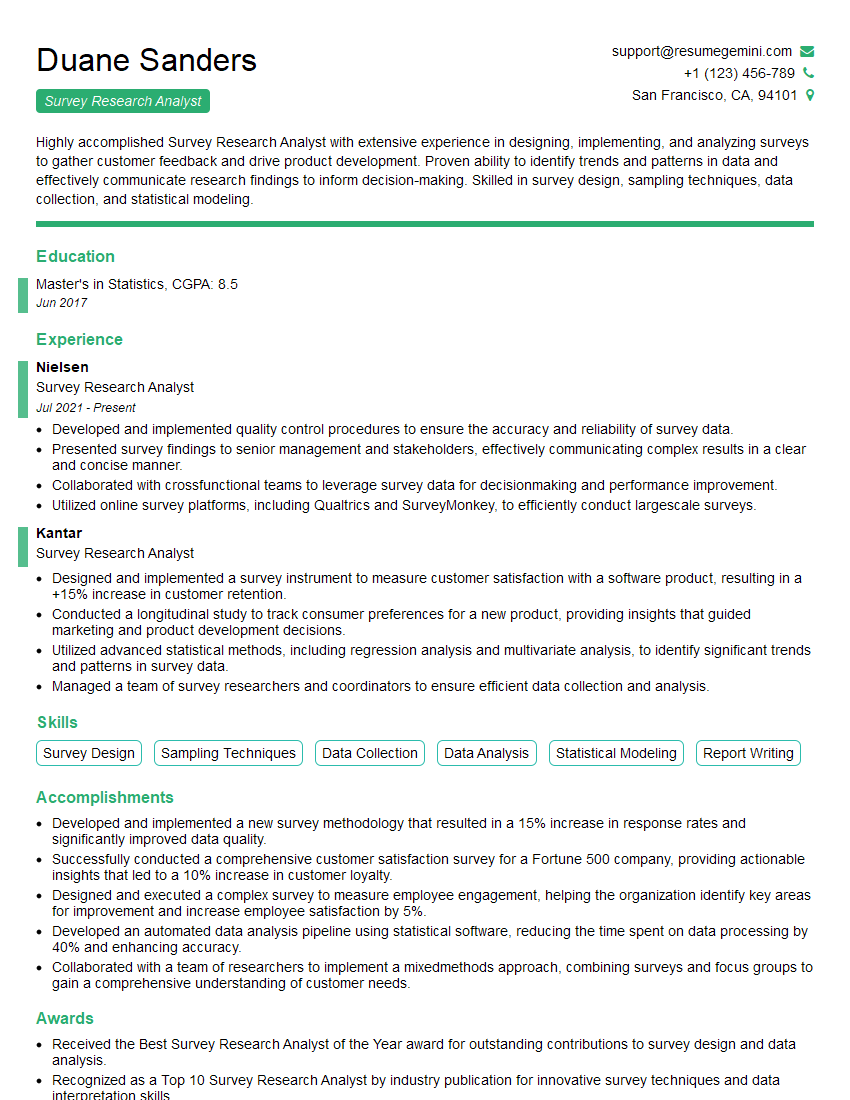
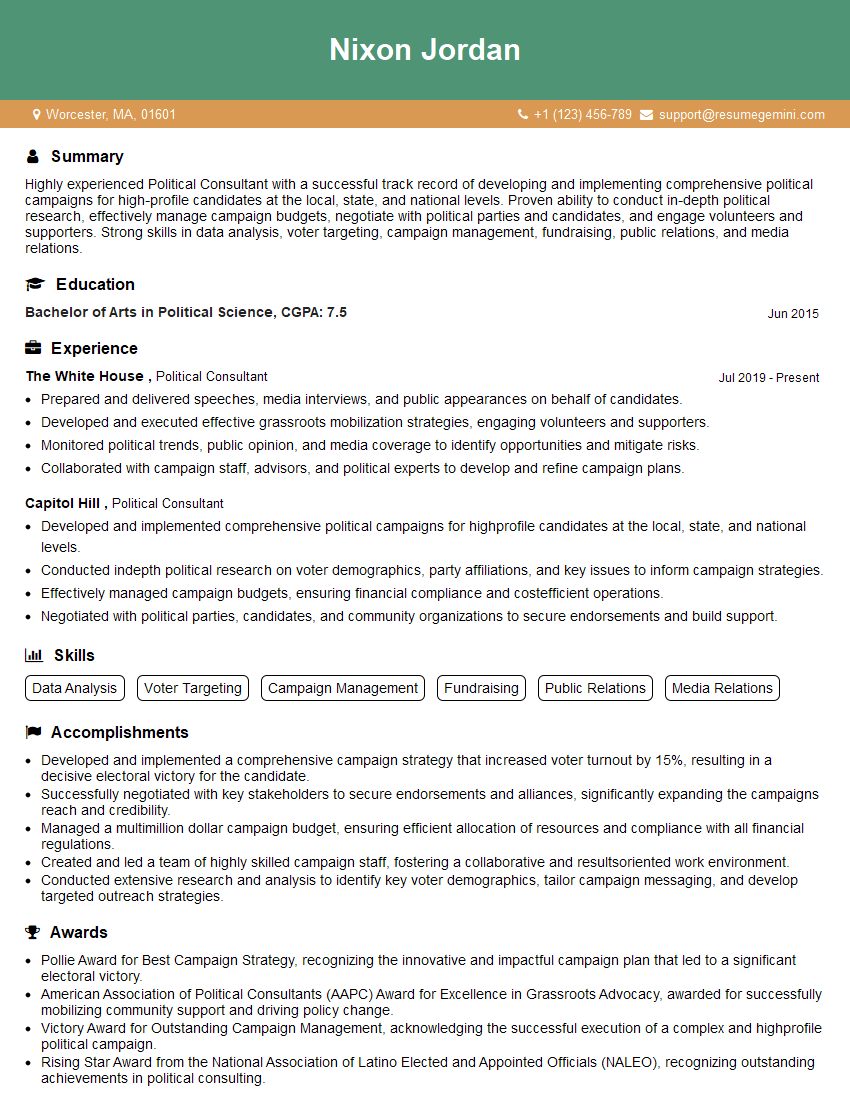
Mastering Political Demography opens doors to exciting careers in research, policy analysis, campaign management, and political consulting. To maximize your job prospects, creating a strong, ATS-friendly resume is crucial. ResumeGemini can help you craft a compelling resume that highlights your skills and experience effectively. They offer examples of resumes tailored specifically to Political Demography, ensuring your application stands out. Invest the time to build a resume that showcases your expertise; it's a key step in landing your dream job.
Explore more articles
Users Rating of Our Blogs
Share Your Experience
We value your feedback! Please rate our content and share your thoughts (optional).
What Readers Say About Our Blog
To the interviewgemini.com Webmaster.
Very helpful and content specific questions to help prepare me for my interview!
Thank you
To the interviewgemini.com Webmaster.
This was kind of a unique content I found around the specialized skills. Very helpful questions and good detailed answers.
Very Helpful blog, thank you Interviewgemini team.