Unlock your full potential by mastering the most common Social Science Measurement interview questions. This blog offers a deep dive into the critical topics, ensuring you’re not only prepared to answer but to excel. With these insights, you’ll approach your interview with clarity and confidence.
Questions Asked in Social Science Measurement Interview
Q 1. Explain the concept of validity in social science measurement.
Validity in social science measurement refers to the extent to which a measurement instrument actually measures what it is intended to measure. It’s about accuracy – are we truly capturing the concept we’re interested in? Think of it like hitting the bullseye on a dartboard. A valid measurement consistently hits the center, representing the true value of the construct being measured. An invalid measure might consistently hit the outer ring or scatter wildly, failing to accurately represent the target.
For example, if we’re trying to measure job satisfaction, a valid measure would accurately reflect the levels of satisfaction employees experience, not something else like their commute time or their relationship with their boss (unless those are explicitly part of the definition of job satisfaction being investigated).
Q 2. Describe different types of validity (e.g., content, criterion, construct).
Several types of validity help us assess the overall validity of a measurement instrument. These include:
- Content Validity: This assesses whether the instrument comprehensively covers all aspects of the construct being measured. Imagine a test on ‘understanding Shakespeare’. If it only focuses on Hamlet, it lacks content validity because it doesn’t represent the breadth of Shakespeare’s works.
- Criterion Validity: This evaluates how well the instrument predicts an outcome or correlates with a criterion measure. For example, a valid aptitude test for pilots should correlate strongly with their actual performance in flight school. This can be further divided into concurrent validity (measuring the construct and criterion at the same time) and predictive validity (measuring the construct and then assessing the criterion at a later point in time).
- Construct Validity: This is the broadest and most complex type of validity. It refers to the extent to which the instrument measures the theoretical construct it’s designed to measure. This involves examining the instrument’s relationship with other variables, as predicted by the theory. For example, an instrument designed to measure ‘self-esteem’ should correlate positively with measures of confidence and negatively with measures of anxiety, as theoretical models of self-esteem would predict.
Q 3. What are the key differences between reliability and validity?
Reliability and validity are distinct but related concepts. Reliability refers to the consistency of a measure; a reliable measure produces similar results under consistent conditions. Validity refers to the accuracy of a measure; a valid measure measures what it is supposed to measure. A measure can be reliable without being valid, but it cannot be valid without being reliable.
Think of a scale: A scale that consistently gives you the same weight every time (reliable) may be invalid if it consistently overestimates your weight by 5 pounds. It is consistent (reliable) but not accurate (invalid). Conversely, a scale that gives different weights each time (unreliable) cannot be valid.
Q 4. Explain the concept of reliability in social science measurement.
Reliability in social science measurement refers to the extent to which a measurement instrument produces consistent results. If we use the same instrument to measure the same thing multiple times, a reliable instrument will yield similar results. It’s about consistency and stability; if we repeat the measurement, we should get similar results. This is crucial for ensuring that any observed changes or differences are due to actual changes in the phenomenon being measured and not due to random error in the measurement instrument itself.
For instance, imagine a survey measuring political attitudes. A reliable survey would yield similar results if administered to the same respondent at different times.
Q 5. Describe different types of reliability (e.g., test-retest, internal consistency).
Several types of reliability are used to assess the consistency of a measurement instrument:
- Test-Retest Reliability: This assesses the consistency of a measure over time. The same instrument is administered to the same group at two different time points, and the correlation between the two sets of scores is calculated. A high correlation indicates good test-retest reliability.
- Internal Consistency Reliability: This evaluates the consistency of items within a measure. It assesses whether different items within the same instrument are measuring the same construct. Common methods include Cronbach’s alpha, which calculates the average correlation between all possible pairs of items in a scale. A high alpha (typically above 0.7) indicates good internal consistency.
- Inter-Rater Reliability: This assesses the agreement between different raters or observers using the same measurement instrument. It’s important when the measurement involves subjective judgment, like observing children’s behavior or coding open-ended interview responses. Statistical measures like Cohen’s kappa can be used to quantify the level of agreement.
Q 6. How do you assess the reliability of a measurement instrument?
Assessing the reliability of a measurement instrument involves selecting an appropriate reliability coefficient based on the type of data and the research design. For example:
- Test-retest reliability is calculated using the correlation between scores from two administrations of the same test. A Pearson correlation is commonly used.
- Internal consistency reliability is assessed using statistics like Cronbach’s alpha for scales with multiple items, or using inter-item correlations for measures with fewer items.
- Inter-rater reliability is assessed using statistical measures like Cohen’s kappa or percent agreement, depending on the nature of the data.
The magnitude of the reliability coefficient indicates the strength of the reliability; higher values suggest greater consistency. The acceptable level of reliability depends on the context of the study and the nature of the measurement instrument, but generally, values above 0.7 are often considered acceptable.
Q 7. What are some common threats to the validity and reliability of social science measurements?
Several factors can threaten the validity and reliability of social science measurements:
- Response Bias: Participants may respond in a way that doesn’t accurately reflect their true beliefs or behaviors (e.g., social desirability bias, acquiescence bias).
- Interviewer Bias: The interviewer’s behavior or characteristics can influence participants’ responses.
- Sampling Bias: The sample selected may not be representative of the population of interest.
- Instrumentation Bias: Changes in the measurement instrument itself over time (e.g., wording changes in a survey).
- Testing Effects: Repeated testing can influence participants’ responses on subsequent occasions.
- History Effects: External events occurring between measurements can affect participants’ responses.
- Maturation Effects: Natural changes in participants over time (e.g., age, experience) can affect their responses.
- Ambiguous Questions: Poorly worded questions can lead to misinterpretations and inconsistent answers.
Addressing these threats requires careful research design, instrument development, and data analysis. Pilot testing instruments, using multiple methods of measurement (triangulation), and controlling for confounding variables are important strategies to enhance validity and reliability.
Q 8. Explain the difference between nominal, ordinal, interval, and ratio scales of measurement.
Levels of measurement, or scales of measurement, classify the nature of information within the values assigned to variables. Understanding these levels is crucial for choosing appropriate statistical analyses. They range from the simplest (nominal) to the most complex (ratio).
- Nominal Scale: This is the most basic level. It categorizes data into mutually exclusive groups without any inherent order or ranking. Think of it like assigning labels. Example: Eye color (blue, brown, green); Gender (male, female, other); Types of cars (sedan, SUV, truck).
- Ordinal Scale: This scale categorizes data and also ranks them in a meaningful order. However, the differences between ranks aren’t necessarily equal. Example: Educational attainment (high school, bachelor’s, master’s, doctorate); Socioeconomic status (low, middle, high); Likert scale responses (strongly disagree, disagree, neutral, agree, strongly agree).
- Interval Scale: This scale ranks data, and the intervals between values are equal. However, there’s no true zero point. This means you can add and subtract values, but not meaningfully multiply or divide. Example: Temperature in Celsius or Fahrenheit (a 10-degree difference always means the same, but 0°C doesn’t mean there’s no temperature). Years (the difference between years is constant, but year 0 is not the absence of years).
- Ratio Scale: This is the highest level of measurement. It has all the properties of an interval scale, plus a true zero point. This allows for meaningful ratios. Example: Height, weight, age, income (0 height means no height, 0 income means no income).
Q 9. What are some common methods for collecting social science data?
Social science data collection employs diverse methods tailored to the research question. Common approaches include:
- Surveys: Questionnaires administered to a sample population. These can be online, paper-based, or conducted via phone. They’re efficient for large samples but can suffer from response bias.
- Interviews: Structured or unstructured conversations with individuals to gather in-depth information. They allow for probing and clarification but are time-consuming and may introduce interviewer bias.
- Observations: Systematically watching and recording behaviors or events. This can be participant observation (researcher is involved) or non-participant (researcher is an outsider). It’s useful for capturing natural behavior but is susceptible to observer bias and ethical considerations.
- Experiments: Manipulating one or more variables to determine their effect on another. This establishes causality but may not generalize well to real-world settings.
- Existing Data Analysis (Secondary Data Analysis): Using previously collected data such as census data, government records, or data from previous studies. This is cost-effective but the researcher has no control over the quality or variables collected.
- Content Analysis: Analyzing textual or visual data (e.g., news articles, social media posts) to identify patterns and themes. This provides insights into communication and public opinion.
Q 10. Discuss the strengths and weaknesses of different data collection methods (e.g., surveys, interviews, observations).
Each data collection method has its own advantages and drawbacks:
- Surveys: Strengths: Large sample sizes, cost-effective, quick data collection. Weaknesses: Superficial data, response bias, low response rates.
- Interviews: Strengths: Rich, in-depth data, allows for probing, flexibility. Weaknesses: Time-consuming, expensive, interviewer bias, small sample size.
- Observations: Strengths: Captures natural behavior, provides detailed information. Weaknesses: Observer bias, ethical considerations, difficulty in replicating findings.
- Experiments: Strengths: Establishes causality, control over variables. Weaknesses: Artificial setting, limited generalizability, ethical concerns.
- Existing Data Analysis: Strengths: Cost-effective, large datasets available. Weaknesses: Limited control over data quality, potential biases in data collection.
- Content Analysis: Strengths: Useful for understanding communication patterns, large data sets possible. Weaknesses: Subjectivity in coding, time consuming.
The choice of method should depend on the research question, available resources, and ethical considerations.
Q 11. What are some common statistical techniques used in social science measurement?
Social science research utilizes various statistical techniques depending on the data type and research goals. Some common methods include:
- Descriptive Statistics: Summarize and describe data using measures like mean, median, mode, standard deviation, and frequency distributions. This gives a basic understanding of the data.
- Inferential Statistics: Draw conclusions about a population based on a sample. This includes hypothesis testing (t-tests, ANOVA, chi-square tests), correlation analysis, and regression analysis.
- Regression Analysis: Examines the relationship between a dependent variable and one or more independent variables. This allows for prediction and understanding of causal relationships.
- Factor Analysis: Reduces a large number of variables into a smaller set of underlying factors. This is useful for simplifying complex datasets.
- Structural Equation Modeling (SEM): Tests complex relationships between multiple variables, including latent variables (variables not directly measured).
- Qualitative Data Analysis: Techniques such as thematic analysis, grounded theory, and narrative analysis are used to interpret non-numerical data such as interview transcripts or observational notes.
The choice of technique depends heavily on the research question and the nature of the data collected (nominal, ordinal, interval, ratio).
Q 12. Explain the concept of sampling and its importance in social science research.
Sampling is the process of selecting a subset of individuals from a larger population to participate in a study. It’s crucial because studying an entire population is often impractical, expensive, or impossible. A well-chosen sample allows researchers to make inferences about the larger population with a reasonable degree of accuracy and confidence.
The quality of the sample directly impacts the validity and generalizability of the research findings. A biased sample can lead to inaccurate conclusions and misinterpretations of the population characteristics.
Q 13. Describe different types of sampling methods (e.g., random sampling, stratified sampling).
Numerous sampling methods exist, each with its strengths and weaknesses:
- Simple Random Sampling: Every member of the population has an equal chance of being selected. This minimizes sampling bias but might not represent subgroups well.
- Stratified Sampling: The population is divided into subgroups (strata) based on relevant characteristics (e.g., age, gender, ethnicity), and random samples are drawn from each stratum. This ensures representation of subgroups.
- Cluster Sampling: The population is divided into clusters (e.g., schools, neighborhoods), and a random sample of clusters is selected. All members within the selected clusters are included in the study. This is efficient for large, geographically dispersed populations but may have higher sampling error.
- Systematic Sampling: Every kth member of the population is selected after a random starting point. This is simple and easy to implement but can be problematic if the population has a hidden cyclical pattern.
- Convenience Sampling: Selecting participants who are readily available. This is easy but highly susceptible to bias and limits generalizability.
The choice of sampling method depends on factors such as the research question, population characteristics, resources, and desired level of accuracy.
Q 14. How do you handle missing data in social science research?
Missing data is a common challenge in social science research. It can introduce bias and reduce the accuracy of analyses. Strategies for handling missing data include:
- Listwise Deletion: Excluding cases with any missing data. This is simple but can lead to substantial loss of data and bias if missing data is not random.
- Pairwise Deletion: Using all available data for each analysis. This retains more data but can lead to inconsistent results.
- Imputation: Replacing missing values with estimated values. Methods include mean imputation, regression imputation, and multiple imputation. This preserves more data but can introduce bias if not done carefully.
- Maximum Likelihood Estimation: A statistical method that estimates parameters considering the pattern of missing data. This is generally preferred for complex datasets.
The best approach depends on the nature of the missing data (e.g., random vs. non-random) and the extent of missingness. It’s crucial to document the strategy used and acknowledge potential biases.
Q 15. What are some common methods for data cleaning and preparation?
Data cleaning and preparation are crucial steps before any analysis. Think of it like prepping ingredients before cooking – you wouldn’t start baking a cake with rotten eggs! These methods aim to identify and correct errors, inconsistencies, and missing values to ensure data quality and reliability.
Handling Missing Data: This can involve imputation (filling in missing values using methods like mean/median imputation, regression imputation, or more sophisticated techniques like k-nearest neighbors), or removal of cases with missing data (listwise deletion), depending on the extent and nature of the missing data. The best approach depends heavily on the dataset and the reason for the missing data.
Identifying and Correcting Outliers: Outliers are extreme values that might be due to errors or genuinely represent unusual cases. Methods for dealing with them include visual inspection using box plots, calculating z-scores, or using robust statistical methods less sensitive to outliers. Sometimes, outliers are genuinely interesting and informative; other times, they’re errors that need to be corrected or removed.
Consistency Checks: This involves ensuring consistency across variables. For example, checking for inconsistencies in data entry (e.g., inconsistent spellings of a variable, different formats for dates). This often requires careful examination of the data and may involve recoding or creating new variables to standardize information.
Data Transformation: This involves changing the format or scale of variables. Common transformations include standardizing variables (e.g., converting to z-scores), creating dummy variables for categorical variables, or applying logarithmic transformations to skewed data.
For example, in a study on income inequality, you might need to handle missing income data using imputation, standardize income to control for scale differences, and remove outliers representing extremely high incomes that are likely due to data entry errors. The choice of cleaning method depends significantly on the context.
Career Expert Tips:
- Ace those interviews! Prepare effectively by reviewing the Top 50 Most Common Interview Questions on ResumeGemini.
- Navigate your job search with confidence! Explore a wide range of Career Tips on ResumeGemini. Learn about common challenges and recommendations to overcome them.
- Craft the perfect resume! Master the Art of Resume Writing with ResumeGemini’s guide. Showcase your unique qualifications and achievements effectively.
- Don’t miss out on holiday savings! Build your dream resume with ResumeGemini’s ATS optimized templates.
Q 16. Explain the concept of factor analysis and its application in social science measurement.
Factor analysis is a statistical method used to reduce a large number of observed variables into a smaller number of unobserved latent variables, called factors. Imagine you have a questionnaire with 20 questions all measuring different aspects of job satisfaction. Factor analysis helps you identify underlying dimensions (factors) that explain the correlations between these 20 items. For example, you might find that many questions load onto a factor representing ‘work-life balance,’ while others load onto a factor representing ‘compensation and benefits’.
In social science measurement, factor analysis is valuable for:
Scale Development: It helps identify which items belong together to form a reliable and valid scale measuring a specific construct. This is crucial when creating questionnaires and surveys.
Data Reduction: It simplifies complex datasets by reducing the number of variables while retaining most of the important information. This is important when working with large datasets, where reducing dimensions can make analysis more manageable and efficient.
Construct Validation: It helps assess the underlying structure of a construct and determine if the measurement instrument is measuring what it’s intended to measure.
For instance, a researcher studying political attitudes might use factor analysis to identify latent factors underlying a set of survey questions about political ideology. This could reveal distinct dimensions like economic liberalism/conservatism and social liberalism/conservatism.
Q 17. What is Cronbach’s alpha and how is it used?
Cronbach’s alpha is a measure of internal consistency reliability. It assesses how well multiple items within a scale correlate with each other, indicating the extent to which the items measure the same underlying construct. Think of it as measuring the internal consistency of a scale; like checking if all the parts of a machine work together smoothly to perform the intended function.
A high Cronbach’s alpha (typically above 0.7) suggests that the items are highly correlated and the scale is reliable. A low alpha suggests poor internal consistency, indicating that the items might not be measuring the same thing or that there are problems with the scale’s design. The value is influenced by the number of items in the scale, so a longer scale will typically have a higher alpha even if the items are not very strongly correlated.
It’s important to remember that Cronbach’s alpha is only one measure of reliability, and high alpha doesn’t guarantee validity. A scale can be reliable (internally consistent) but not actually measure what it intends to measure. In a study on self-esteem, for example, a high Cronbach’s alpha for a self-esteem scale would suggest the items consistently measure some aspect of self-esteem, but further validation studies would be needed to confirm that it truly measures self-esteem as opposed to, say, self-confidence or narcissism.
Q 18. Explain the concept of structural equation modeling (SEM).
Structural Equation Modeling (SEM) is a powerful statistical technique used to test complex relationships between multiple variables. It combines elements of factor analysis and regression analysis to test a hypothesized model of relationships among variables. Think of it as a sophisticated road map for relationships between different variables, where you can test if the ‘roads’ connect as you hypothesize.
SEM allows researchers to:
Test multiple hypotheses simultaneously: Unlike regression, SEM allows the testing of more complex models with multiple dependent and independent variables.
Model latent variables: SEM can incorporate unobserved (latent) variables, making it ideal for studying constructs that are not directly observable, such as intelligence or job satisfaction.
Assess model fit: SEM provides indices to assess how well the hypothesized model fits the observed data.
A researcher studying the impact of social support on stress and well-being might use SEM to test a model where social support influences stress levels, which in turn influences well-being. SEM allows for the simultaneous examination of these relationships and the assessment of the overall model fit to the data.
Q 19. Describe the process of developing a new measurement instrument.
Developing a new measurement instrument is a rigorous process involving several key steps:
Conceptualization: Define the construct to be measured clearly and precisely. This requires a thorough review of existing literature and conceptual frameworks. What are you measuring and why?
Item Generation: Develop a pool of items that tap into different aspects of the construct. This can involve brainstorming, reviewing existing scales, and consulting with experts.
Pilot Testing: Administer the instrument to a small sample to identify any problems with clarity, wording, or item functioning. This is crucial for refining the items before large-scale administration.
Scale Purification: Using statistical methods such as factor analysis, refine the instrument by eliminating poorly performing items and ensuring that the items form coherent scales.
Validation: Conduct psychometric testing to assess the validity and reliability of the instrument. This includes evaluating content validity, criterion validity (does it correlate with other established measures?), and construct validity (does it measure the intended construct?).
Norming (optional): Develop norms or standards for interpreting scores on the instrument. This requires administering the instrument to a large, representative sample.
Imagine creating a new scale to measure resilience. You’d start by defining resilience, generate items related to its different facets, pilot test the items, use factor analysis to refine the scale, and finally conduct validation studies to demonstrate its reliability and validity before using it in research.
Q 20. How do you evaluate the quality of existing measurement instruments?
Evaluating the quality of existing measurement instruments involves assessing several key aspects:
Reliability: Does the instrument consistently measure the same thing over time and across different raters (inter-rater reliability)? Common measures include Cronbach’s alpha (internal consistency), test-retest reliability, and inter-rater reliability.
Validity: Does the instrument measure what it claims to measure? This involves assessing different types of validity, including content validity (does it cover all aspects of the construct?), criterion validity (does it correlate with other relevant measures?), and construct validity (does it measure the intended underlying construct?).
Practicality: Is the instrument easy to administer, score, and interpret? Consider factors like length, clarity of instructions, and time required for administration.
Normative Data: Are there norms or standards available for interpreting scores on the instrument? Norms provide context for interpreting individual scores relative to a larger group.
When evaluating a depression scale, you’d examine its reliability (consistency of scores), validity (does it accurately measure depression symptoms?), practicality (is it easy to use?), and the availability of normative data for comparing scores across individuals.
Q 21. What ethical considerations are important in social science measurement?
Ethical considerations in social science measurement are paramount. Researchers must prioritize the well-being and rights of participants. Key ethical considerations include:
Informed Consent: Participants must be fully informed about the purpose of the study, the procedures involved, and any potential risks or benefits before agreeing to participate. They must be free to withdraw at any time without penalty.
Confidentiality and Anonymity: Researchers must protect the privacy of participants by ensuring that their data are kept confidential and anonymous. This often involves using coding systems and secure data storage practices.
Minimizing Harm: Researchers must take steps to minimize any potential harm to participants, both physical and psychological. This might involve providing support or counseling if necessary.
Cultural Sensitivity: Measurement instruments should be culturally appropriate and sensitive to the diverse backgrounds of participants. Using instruments developed in one culture in another can be problematic if the instrument does not accurately capture the nuances of the other culture’s experience.
Transparency and Honesty: Researchers must be transparent about their methods and findings and should avoid any misrepresentation or manipulation of data.
In a study on sensitive topics like sexual behavior or substance use, researchers need to be especially careful to ensure participants’ privacy, minimize any potential harm, and obtain informed consent. This includes addressing the potential vulnerability of research participants.
Q 22. How do you interpret statistical results in the context of social science research?
Interpreting statistical results in social science requires moving beyond simple p-values. We must consider the context of the research question, the limitations of the data, and the potential biases inherent in the study design. It’s not just about whether a result is statistically significant (p < .05), but also about the magnitude and practical significance of the effect. For instance, a statistically significant correlation between ice cream sales and crime rates doesn't necessarily mean ice cream causes crime; there's a confounding variable (summer heat).
My approach involves a multi-step process:
- Examine effect sizes: Instead of solely focusing on p-values, I assess effect sizes (e.g., Cohen’s d, odds ratios) to understand the practical impact of the findings. A small effect size might be statistically significant with a large sample but may lack real-world importance.
- Consider confidence intervals: Confidence intervals provide a range of plausible values for the effect, offering a more nuanced understanding than a single point estimate. A wide confidence interval indicates less certainty about the result.
- Assess the limitations: I critically evaluate potential biases (sampling bias, measurement error), limitations of the study design, and generalizability of the findings to other populations or contexts. This is crucial for interpreting results responsibly.
- Visualize data: Graphs and charts help communicate complex statistical findings more effectively to diverse audiences. A well-chosen visualization can reveal patterns and relationships that might be missed in tables of numbers.
In essence, interpreting statistical results is a holistic process that goes beyond simply declaring significance; it’s about understanding the entire story the data are telling, within their limitations.
Q 23. Discuss the importance of using appropriate statistical methods for different types of data.
Choosing the right statistical method is paramount in social science research. The type of data directly influences the appropriate analytical techniques. Using inappropriate methods can lead to inaccurate conclusions and misinterpretations.
- Nominal/Categorical Data: For data representing categories (e.g., gender, ethnicity, political affiliation), we use methods like chi-square tests to examine relationships between variables or to assess differences in proportions across groups. For example, a chi-square test can determine if there’s a relationship between gender and voting preference.
- Ordinal Data: Ordinal data have a ranked order but unequal intervals (e.g., Likert scale responses). Non-parametric tests like the Mann-Whitney U test or Kruskal-Wallis test are suitable for comparing groups based on ordinal data. This might be used to compare the level of satisfaction with a service across different demographics.
- Interval/Ratio Data: These data have equal intervals and a true zero point (e.g., age, income, test scores). This allows for a wider range of statistical methods, including t-tests, ANOVAs, and regression analysis. For instance, a regression analysis might examine the relationship between years of education and income.
Failing to select appropriate methods can lead to type I (false positive) or type II (false negative) errors. For example, using a parametric test (like a t-test) on ordinal data violates the assumptions of the test and can produce misleading results.
Q 24. How do you communicate social science research findings to different audiences?
Communicating social science research effectively requires tailoring the message to the specific audience. A technical report for fellow researchers will differ drastically from a presentation for policymakers or a blog post for the general public.
- Academic Audiences: For researchers, I use precise language, detail statistical methods, and discuss limitations extensively. Journal articles and conference presentations are the primary channels.
- Policymakers: I focus on clear, concise summaries of key findings, highlighting implications for policy and practice. I use visuals and avoid jargon. Policy briefs and presentations are effective here.
- General Public: For a broader audience, I emphasize storytelling and relatable examples to make the research accessible. I use plain language and avoid technical terms. Blogs, infographics, and news articles are suitable platforms.
In all cases, ethical considerations are paramount. I ensure that data are presented accurately and responsibly, avoiding oversimplification or misrepresentation of findings. I’m also mindful of the potential impact of the research and strive to communicate findings in a way that is both informative and transparent.
Q 25. Explain your experience with specific statistical software packages (e.g., SPSS, R, SAS).
I have extensive experience with SPSS, R, and SAS, each suited to different tasks. My proficiency extends beyond basic data cleaning and analysis to more advanced techniques.
- SPSS: I’m adept at using SPSS for descriptive statistics, hypothesis testing (t-tests, ANOVAs, chi-square tests), and regression analysis. Its user-friendly interface makes it efficient for common social science tasks. For example, I’ve used SPSS to analyze survey data and perform factor analysis.
- R: R offers unparalleled flexibility and a wide range of packages for advanced statistical modeling, data visualization, and creating reproducible research. I use R for more complex tasks like structural equation modeling and multilevel modeling. For example, I’ve utilized R’s
lavaanpackage for SEM analysis. - SAS: My experience with SAS is primarily focused on its capabilities for handling large datasets and its robust statistical procedures. I’ve used SAS for analyzing longitudinal data and conducting complex statistical analyses requiring high computational power.
My skills encompass data manipulation, statistical modeling, and generating publication-quality reports and visualizations in all three packages.
Q 26. Describe a challenging social science measurement problem you encountered and how you solved it.
A challenging project involved measuring social capital in a rural community. Social capital, while conceptually rich, is difficult to quantify. Existing scales were inadequate for this specific community’s context. Their unique social structures and norms weren’t captured by standard questionnaires.
My solution involved a mixed-methods approach:
- Qualitative Data Collection: I started with focus groups and in-depth interviews to understand the community’s specific social structures, key social relationships, and the mechanisms through which social capital operated.
- Development of a Contextualized Scale: Based on the qualitative findings, I developed a questionnaire tailored to the community’s specific understanding of social capital. This included developing new items and adjusting existing ones to reflect local terminology and social norms.
- Quantitative Analysis: The data from the tailored questionnaire were analyzed using factor analysis to identify underlying dimensions of social capital within that context and further statistical analyses were used to see how the different aspects of social capital related to other outcomes of interest.
- Triangulation: I triangulated the quantitative and qualitative data to ensure a comprehensive understanding of social capital in the community. This ensured that the results from the quantitative data analysis were corroborated and grounded in the lived experiences of the people in the study.
This mixed-methods approach yielded a much richer and more accurate measure of social capital compared to using a generic scale. It highlighted the importance of adapting measurement tools to the specific context of the research.
Q 27. How do you stay current with new developments in social science measurement?
Staying current in social science measurement requires a multi-pronged approach.
- Academic Journals: I regularly read journals like the Journal of the American Statistical Association, Sociological Methodology, and Psychological Methods to stay abreast of methodological advancements.
- Conferences and Workshops: Attending conferences like the annual meetings of the American Sociological Association and the American Psychological Association provides opportunities to learn about new techniques and network with leading researchers.
- Online Resources: I utilize online platforms like arXiv, ResearchGate, and various university websites to access research papers and pre-prints.
- Professional Development: I actively seek out workshops and short courses on specific statistical methods or measurement techniques to enhance my expertise.
This continuous learning ensures that my work remains at the forefront of the field, allowing me to employ the most appropriate and up-to-date methodologies.
Q 28. What are your career goals related to social science measurement?
My career goals involve making significant contributions to the field of social science measurement by developing and applying innovative methods to address complex social problems. I aspire to:
- Develop Novel Measurement Instruments: I aim to create robust and valid measures for constructs currently lacking adequate quantitative tools, especially in areas such as wellbeing, social inequality, and environmental attitudes.
- Advance Methodological Understanding: I want to contribute to the theoretical and methodological advancement of measurement by publishing research on novel approaches and improving existing techniques.
- Mentorship and Collaboration: I am keen on mentoring junior researchers and collaborating with interdisciplinary teams to tackle pressing societal challenges through rigorous and ethical measurement practices.
Ultimately, my goal is to use my expertise in social science measurement to improve the quality of research, enhance our understanding of social phenomena, and inform evidence-based policy decisions.
Key Topics to Learn for Social Science Measurement Interview
- Levels of Measurement: Understand nominal, ordinal, interval, and ratio scales and their implications for analysis. Consider the strengths and weaknesses of each level in different research contexts.
- Reliability and Validity: Grasp the core concepts of reliability (consistency) and validity (accuracy) and different methods for assessing each (e.g., test-retest, inter-rater, content validity, construct validity). Be prepared to discuss how these concepts influence the interpretation of research findings.
- Sampling Techniques: Familiarize yourself with various sampling methods (e.g., random sampling, stratified sampling, convenience sampling) and their respective biases. Understand how sample characteristics impact the generalizability of research results.
- Data Collection Methods: Explore different methods for collecting social science data, such as surveys, interviews, experiments, and observational studies. Be able to discuss the advantages and disadvantages of each method and their appropriateness for different research questions.
- Statistical Analysis: Demonstrate a foundational understanding of descriptive and inferential statistics relevant to social science research. This may include measures of central tendency, dispersion, correlation, and regression analysis. Focus on your ability to interpret results and draw meaningful conclusions.
- Ethical Considerations: Understand the ethical implications of social science measurement, including issues of informed consent, confidentiality, and potential biases in data collection and analysis.
- Specific Measurement Instruments: Review examples of commonly used scales and instruments in your area of specialization within social science. Be prepared to discuss their strengths, limitations, and appropriate applications.
Next Steps
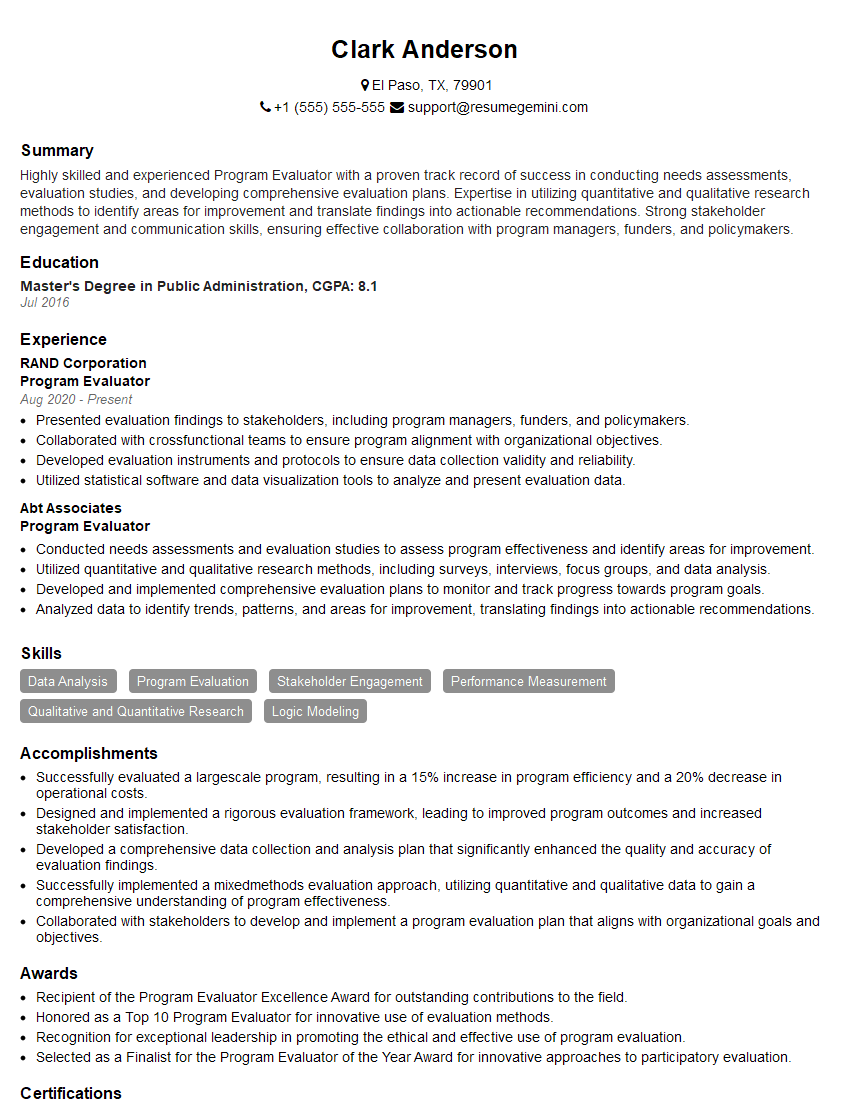
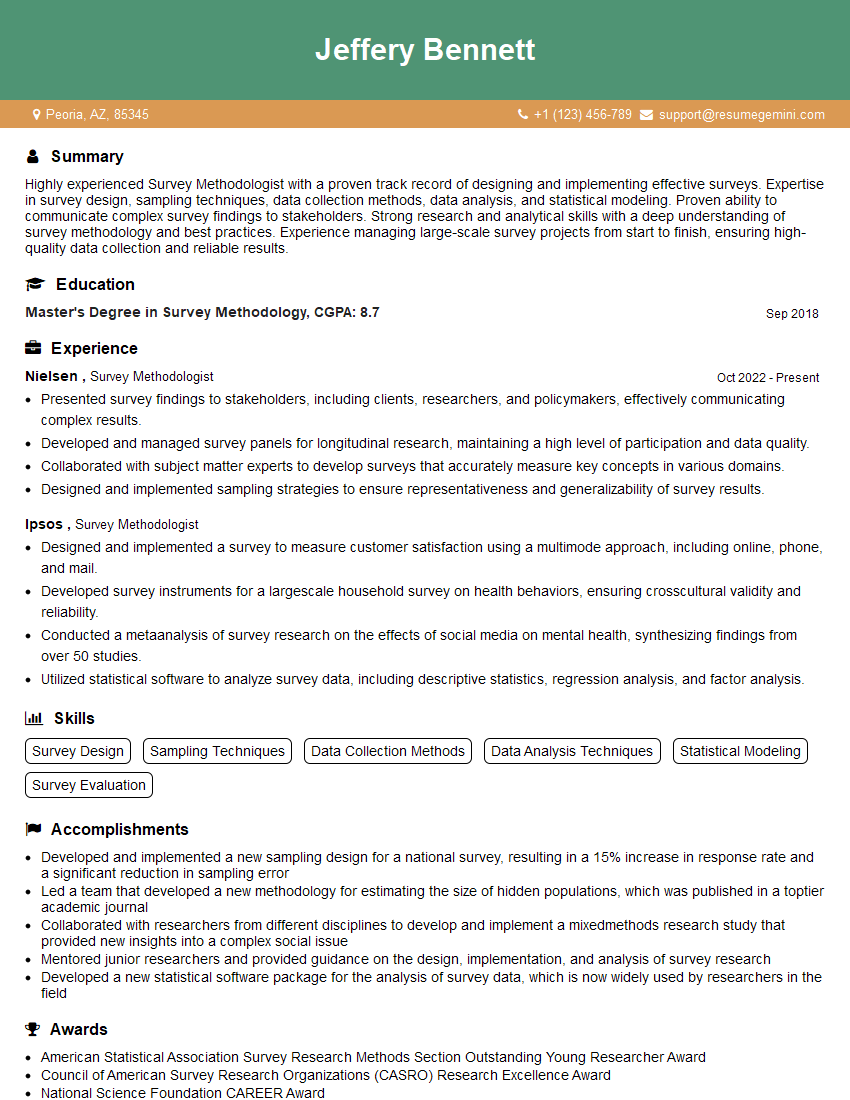
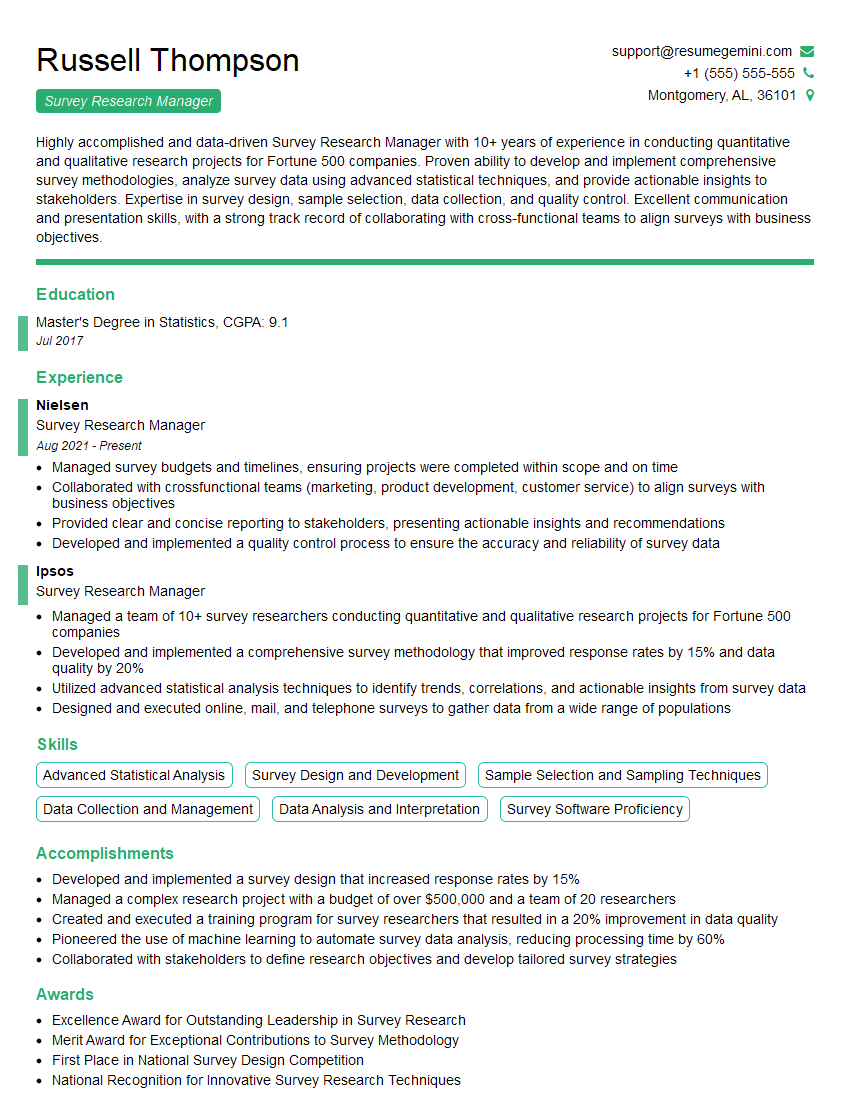
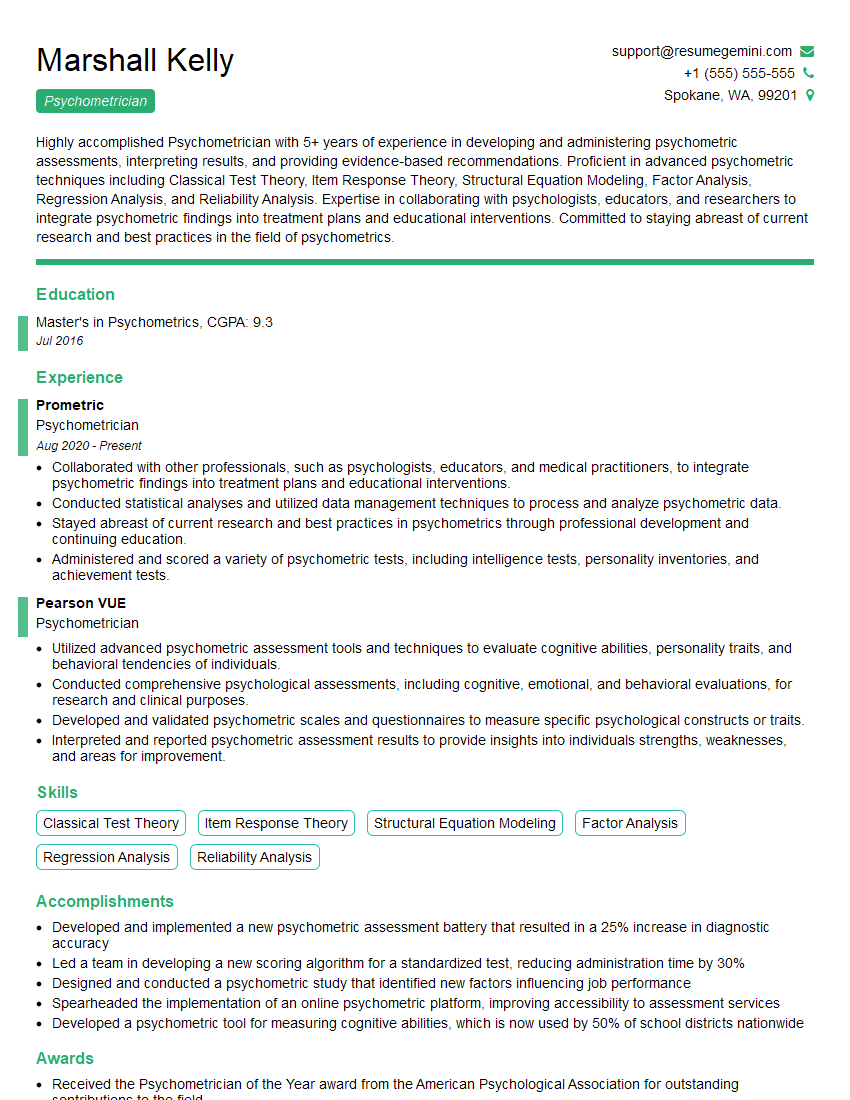
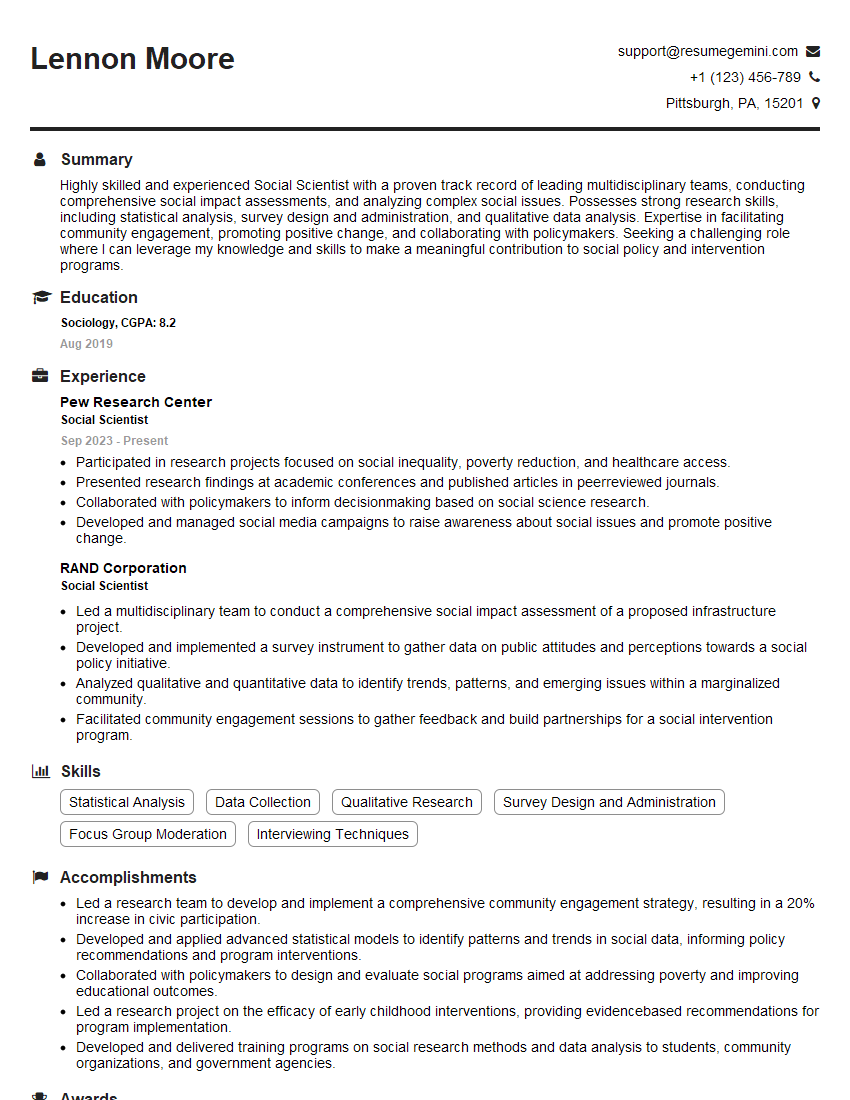
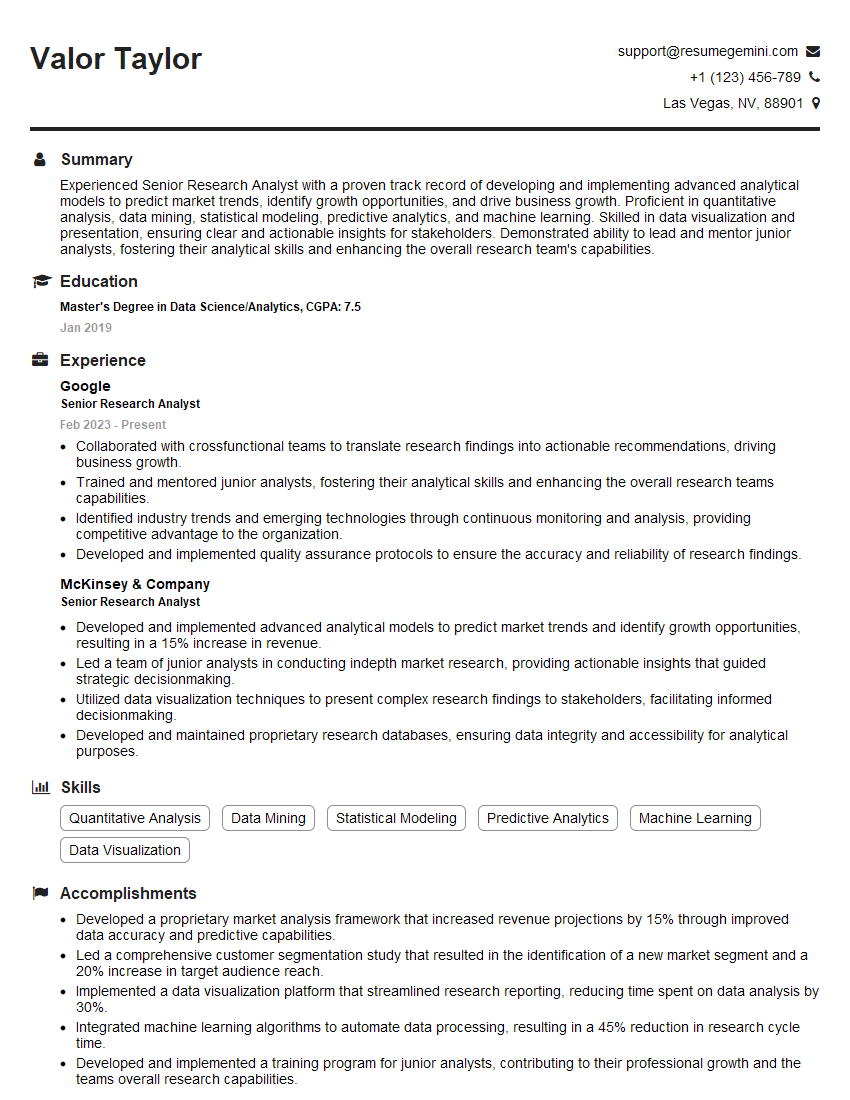
Mastering social science measurement is crucial for a successful career in research, policy analysis, or any field requiring data-driven decision-making. A strong understanding of these concepts will significantly enhance your analytical skills and your ability to contribute meaningfully to your chosen field. To further strengthen your job prospects, crafting an ATS-friendly resume is essential. ResumeGemini is a trusted resource to help you build a professional and impactful resume that highlights your skills and experience effectively. Examples of resumes tailored to Social Science Measurement are available to help guide your process.
Explore more articles
Users Rating of Our Blogs
Share Your Experience
We value your feedback! Please rate our content and share your thoughts (optional).
What Readers Say About Our Blog
This was kind of a unique content I found around the specialized skills. Very helpful questions and good detailed answers.
Very Helpful blog, thank you Interviewgemini team.

