The right preparation can turn an interview into an opportunity to showcase your expertise. This guide to Atlas.ti (Qualitative Data Analysis Software) interview questions is your ultimate resource, providing key insights and tips to help you ace your responses and stand out as a top candidate.
Questions Asked in Atlas.ti (Qualitative Data Analysis Software) Interview
Q 1. Explain the difference between coding and memoing in Atlas.ti.
In Atlas.ti, coding and memoing are two fundamental, yet distinct, qualitative data analysis techniques. Think of coding as labeling segments of your data (text, audio, video, images) with keywords or codes that represent their meaning or significance within your research question. It’s like creating a detailed index for your data. Memoing, on the other hand, is the process of writing notes and reflections on your codes, data segments, or the overall research process. Memos are your personal analytical space to brainstorm, develop theories, and document your evolving understanding of the data.
For example, let’s say you’re analyzing interview transcripts about customer satisfaction. You might code a segment of text expressing dissatisfaction with a product as “Negative Feedback.” Later, you could write a memo associated with that code exploring the underlying reasons for this negative feedback, linking it to other codes, or connecting it to relevant literature.
- Coding: Directly annotates the data. It’s about what you see.
- Memoing: Provides a space for reflection and interpretation. It’s about why you see what you see and what it might mean.
Q 2. Describe the process of importing data into Atlas.ti.
Importing data into Atlas.ti is straightforward. Atlas.ti supports a wide range of file types, including text files (.txt, .doc, .docx), PDFs, audio files (.mp3, .wav), video files (.mp4, .mov), and images. The process generally involves:
- Opening Atlas.ti: Launch the software.
- Creating a Project: Start a new project and choose a location to store your data and project files.
- Importing Data: Navigate to the ‘Import’ function (usually found in the File menu). Select the file type and locate your data files. Atlas.ti will then import your data into the project. You’ll have options for organizing your data within the project by creating folders.
- Reviewing the Import: Check to ensure the data has imported correctly and is displayed as expected.
For very large files, or specific file types, you may need to consider pre-processing (like converting PDFs to text) to optimize the import process and avoid potential errors.
Q 3. How do you manage large datasets within Atlas.ti?
Managing large datasets in Atlas.ti efficiently requires a strategic approach. Think of it like organizing a massive library – you wouldn’t just throw all the books into one room!
- Data Reduction: Before importing, consider reducing your dataset to only what is absolutely necessary for the analysis. Careful sampling can be crucial.
- File Organization: Create a structured folder system within your Atlas.ti project. This helps you navigate and find specific data quickly.
- Efficient Coding: Develop a clear and concise coding scheme to avoid over-coding. Use hierarchical coding to categorize data effectively.
- Regular Backups: Regularly back up your project to prevent data loss.
- Utilizing Queries Effectively: Don’t rely on manually browsing through your entire dataset. Use Atlas.ti’s powerful query functions (discussed below) to filter and analyze specific aspects of the data.
- Hardware Considerations: Ensure you have sufficient RAM and processing power to handle the size of your dataset. Consider using a solid-state drive (SSD) for faster data access.
Q 4. What are different types of coding schemes in Atlas.ti and when would you use each?
Atlas.ti supports various coding schemes, each suited for different analytical approaches:
- In Vivo Coding: Uses the participants’ own words or phrases as codes. This is beneficial for capturing the nuances of language and the participants’ perspectives directly. Example: If participants repeatedly use the phrase “feeling lost,” you would code segments containing this phrase as “Feeling Lost.”
- Pre-defined Coding: Employs a pre-determined set of codes based on your research framework or existing literature. Useful for structured analysis and comparing results to established theoretical frameworks. Example: You might have codes like “Positive Affect,” “Negative Affect,” and “Neutral Affect” based on a pre-existing sentiment analysis framework.
- Deductive Coding: Driven by a hypothesis or pre-existing theory. You search for data instances that support or refute your initial assumptions. Example: Testing the hypothesis that social media use correlates with increased anxiety.
- Inductive Coding: Data-driven; you emerge codes from the data itself. Ideal for exploratory research and uncovering unexpected patterns. Example: Analyzing interview transcripts without pre-conceived codes, letting the themes emerge from the data.
- Axial Coding: A more advanced coding scheme where you categorize codes into broader themes and sub-themes, establishing relationships and connections between codes. Useful for building a rich and detailed theoretical understanding of the data.
Q 5. How do you create and use queries in Atlas.ti for data analysis?
Queries in Atlas.ti are powerful tools that allow you to search and filter your coded data, uncovering patterns and relationships. They act like sophisticated search engines within your project.
To create a query, you’ll usually navigate to the ‘Query’ section within the software. You can build queries based on various criteria, such as:
- Code combinations: Find segments coded with specific code combinations. Example: Find all segments coded with both “Negative Feedback” and “Product X.”
- Code hierarchies: Search across hierarchical code structures. Example: Retrieve all segments coded under the main category “Customer Complaints.”
- Text search: Locate segments containing specific keywords or phrases. Example: Find all mentions of “customer service.”
- Date ranges: Filter data based on when it was collected.
- Document attributes: Filter by document characteristics like participant demographics.
Once you build a query, Atlas.ti will display the results, which you can further analyze, export, or use as the basis for further querying.
Q 6. Explain the concept of networks in Atlas.ti and their analytical applications.
Networks in Atlas.ti visualize the relationships between codes and data segments. Imagine a complex web connecting related ideas. These relationships are derived from your coding and analysis, offering a dynamic view of your data’s structure.
Analytical Applications:
- Identifying Key Themes and Relationships: Networks reveal central themes and how different concepts interconnect. A densely connected cluster of codes might represent a key theme within your dataset.
- Exploring Causality and Influence: By analyzing the links between codes, you can explore potential causal relationships or influences among variables.
- Hypothesis Generation: Network visualizations can spark new research questions and hypotheses by revealing unexpected connections.
- Communicating Findings: Visual network representations are a compelling way to present your research findings to others. They provide a concise and easily understandable overview of the intricate relationships within your data.
Creating a network involves selecting codes or segments and instructing Atlas.ti to generate a visualization based on the connections between them. You can adjust parameters to focus on specific relationships or alter the visual representation.
Q 7. How do you handle inter-coder reliability in Atlas.ti?
Inter-coder reliability is crucial when multiple researchers are involved in coding the same data. It ensures consistency and reduces bias. Atlas.ti provides several tools to address this:
- Coding Agreement: Use Atlas.ti’s built-in tools to calculate the percentage of agreement between coders. Different metrics, such as Cohen’s Kappa, can assess the level of agreement, taking chance agreement into account. A higher percentage suggests better reliability.
- Coder Training and Calibration: Before commencing the coding process, ensure all coders receive thorough training on the coding scheme and definitions. Conduct a calibration phase where coders code a smaller subset of the data together and discuss any discrepancies, refining the coding scheme and building consensus.
- Regular Meetings and Discussions: Regular meetings facilitate communication among coders, allowing for clarification of coding guidelines and addressing disagreements.
- Coding Scheme Refinement: Throughout the coding process, refine the coding scheme based on emerging issues and discrepancies. This iterative process enhances clarity and improves inter-coder reliability.
- Random Sampling and Double-Coding: Select a random subset of data and have multiple coders code the same segments independently. Analyze the agreement on this subset to gauge reliability.
Addressing inter-coder reliability is an iterative process requiring ongoing communication and refinement. The goal is to achieve a level of agreement that instills confidence in the validity and reliability of your analysis.
Q 8. Describe the process of exporting your findings from Atlas.ti.
Exporting your findings from Atlas.ti is a straightforward process, allowing you to share your analysis in various formats. The method depends on what you want to export. You can export everything from simple reports to detailed codebooks.
Reports: For a summary of your findings, Atlas.ti offers various report options. You can create reports summarizing your codes, networks, and other analyses. These reports can be exported as PDFs, RTF, or Word documents. For example, you might generate a report showing the frequency of specific codes across different interview transcripts.
Data: You can export your coded data, allowing others to review your coding scheme and the data it’s applied to. This could be in the form of a spreadsheet showing the segments and their associated codes. This is particularly useful for collaboration or secondary analysis.
Visualizations: Network diagrams and other visualizations created within Atlas.ti can be exported as images (e.g., PNG, JPG) for inclusion in reports or presentations. Imagine exporting a network graph highlighting the connections between key concepts in your study.
Project Files: Finally, and critically for ongoing research, you can also export the entire Atlas.ti project file. This preserves your coding scheme, your data, and your analysis for future use or sharing with colleagues. This is useful for backup and version control.
The specific steps involve navigating to the ‘File’ menu, then selecting the appropriate ‘Export’ option. Atlas.ti provides clear guidance within its interface on each export option.
Q 9. What are some common challenges faced when using Atlas.ti, and how have you overcome them?
Like any software, Atlas.ti presents challenges. One common issue is managing large datasets. Initially, navigating a large corpus of data can feel overwhelming. I’ve overcome this by employing a phased approach; initially, I focus on creating a robust and organized coding scheme. Then, I code incrementally, focusing on manageable chunks of data at a time rather than trying to code everything at once. This also assists in preventing coding fatigue.
Another challenge is the learning curve. Mastering Atlas.ti’s features takes time and practice. I actively sought out online tutorials, workshops, and consulted the Atlas.ti help documentation to get comfortable with the software. Furthermore, practicing with sample datasets before applying it to my own research helped solidify my understanding.
A third challenge relates to inter-coder reliability. When working with a team, ensuring consistency in coding is crucial. To address this, we developed a detailed coding manual and conducted regular meetings to compare our coding and address any discrepancies. We also utilized Atlas.ti’s built-in features for comparing coding schemes between researchers.
Q 10. How do you use the different visualization tools available in Atlas.ti?
Atlas.ti offers a suite of powerful visualization tools crucial for understanding complex data patterns. These tools help uncover hidden relationships within the data that might otherwise be missed.
Network Diagrams: I frequently use network diagrams to visualize the connections between codes and concepts. This provides a bird’s-eye view of how ideas relate and helps identify central themes or patterns. For instance, in a study on social media, a network diagram might reveal the central themes discussed and their interrelationships.
Word Clouds: These are useful for quickly identifying frequently used words or phrases in a dataset. They’re a good initial exploratory tool to pinpoint keywords of interest that may form the basis for further in-depth coding.
Code Co-occurrence Matrices: These matrices show the frequency with which codes appear together within documents. This helps identify associations between codes that might not be obvious through simple coding alone.
Graphs and Charts: Atlas.ti allows generating graphs and charts for quantitative analysis of coding frequencies. These can be exported for reports and presentations.
The use of these tools is iterative. I often start with word clouds for initial exploration, move on to code co-occurrence matrices to refine my coding scheme, and finally utilize network diagrams to present my findings and identify central themes.
Q 11. Compare and contrast Atlas.ti with other qualitative data analysis software.
Atlas.ti stands out among qualitative data analysis software due to its versatility and its robust features for managing complex projects. When comparing it to other software like NVivo or MAXQDA, several key differences emerge.
Data Management: Atlas.ti shines in its ability to handle a wide range of data types, including text, images, audio, and video files seamlessly within one project. Other software may lack the same degree of integration.
Visualization: While all three platforms offer visualization tools, Atlas.ti’s network diagrams are especially powerful for revealing connections between concepts in a visually compelling manner.
Coding Features: All three offer various coding methods, but Atlas.ti offers unique features such as its flexible system for managing code hierarchies and its powerful query functions.
Pricing: The pricing models differ, with some offering subscription models and others one-time purchases. This impacts the overall cost depending on individual needs.
The best choice depends on the specific project requirements and preferences of the researcher. For instance, if a project heavily relies on visual data and requires detailed network analysis, Atlas.ti may be a more suitable choice than others.
Q 12. Explain your experience with different data types within Atlas.ti (e.g., text, images, audio).
My experience with different data types in Atlas.ti has been exceptionally positive. Its ability to handle mixed media within a single project is a significant advantage.
Text Data: This forms the bulk of my work, with transcripts of interviews and focus groups being the primary source. Atlas.ti’s text analysis tools are robust and efficient, allowing for effective coding, memoing, and querying.
Image Data: I’ve used Atlas.ti to analyze images, for instance, in studies on visual communication or art. The ability to link codes and memos directly to images enables detailed analysis of visual content. I’ve found this particularly useful when analyzing photographs, artwork or even screen captures.
Audio and Video Data: I’ve used Atlas.ti to code segments of audio and video recordings, linking coded segments to specific timestamps. This is extremely useful for analyzing conversations or other time-based media. The ability to easily link transcripts to the original audio/video recording is incredibly valuable for ensuring accuracy and context.
Working with mixed-media within the same project streamlines the research process. For example, I’ve worked on projects that analyze both textual and visual materials from social media, and the ability to integrate them within one analysis environment eliminates the need for disparate software and simplifies the organization of research data.
Q 13. How do you ensure data integrity and security when using Atlas.ti?
Data integrity and security are paramount in qualitative research. Atlas.ti offers several features to help maintain this.
Backup and Version Control: Regularly backing up my project files is essential. Atlas.ti facilitates this by allowing the export of the entire project file, enabling me to maintain multiple versions. This is critical for recovering from accidental data loss and tracking changes throughout the research process.
Password Protection: Atlas.ti allows password protection of project files, restricting access to authorized individuals only. This ensures that sensitive data is protected.
Data Anonymization: Before importing data into Atlas.ti, I ensure that any personally identifiable information is removed or anonymized to protect the privacy of research participants, in line with ethical research guidelines. This involves techniques like replacing names with pseudonyms or removing location-specific details.
Secure Storage: I store project files on secure, encrypted drives and utilize cloud storage services with robust security measures. I always check and update security settings to maintain optimum data protection levels.
These precautions ensure that both the data and the analysis remain secure and reliable throughout the research project, upholding ethical and privacy considerations.
Q 14. Describe your experience with using Atlas.ti for mixed-methods research.
Atlas.ti is exceptionally well-suited for mixed-methods research, facilitating the integration of qualitative and quantitative data. This capability is a significant strength.
In my experience, I’ve used Atlas.ti to combine qualitative data (interview transcripts, observations) with quantitative data (survey results, statistical analyses). I code the qualitative data within Atlas.ti, then export quantitative summaries (e.g., code frequencies) to link these with external quantitative analyses. This integrated approach provides a richer understanding of the research topic than either method could offer in isolation.
For instance, in a study examining the impact of a new educational program, I used Atlas.ti to code interview transcripts about students’ experiences. I then linked the qualitative findings on student attitudes to quantitative data on academic performance. The combined qualitative and quantitative analysis provided a comprehensive and nuanced understanding of the program’s effectiveness.
Atlas.ti’s flexibility in handling various data types and its capacity for exporting data in different formats make it an invaluable tool for researchers engaged in mixed-methods approaches. This integrated capability enhances the depth and robustness of research findings.
Q 15. How familiar are you with the different search functions within Atlas.ti?
Atlas.ti offers a powerful suite of search functions crucial for qualitative data analysis. I’m proficient in utilizing its various search capabilities, ranging from simple keyword searches to more sophisticated Boolean and wildcard searches.
For instance, a simple keyword search like "customer satisfaction" will retrieve all segments containing that exact phrase. However, Boolean operators allow for more complex queries. Searching for "customer satisfaction" AND "negative feedback" will only return segments containing both phrases, while "customer satisfaction" OR "customer experience" will return segments containing either phrase. Wildcard characters like the asterisk (*) further expand search possibilities. cust*, for example, will find segments containing words starting with “cust,” such as customer, customers, or custody (though context is vital for relevance). Regular expressions provide the ultimate flexibility for nuanced pattern matching.
I frequently use these different search types in combination to refine my searches progressively, starting broad and then narrowing the results using increasingly specific criteria to effectively isolate relevant data from large datasets. This iterative process is essential for efficient qualitative analysis within Atlas.ti.
Career Expert Tips:
- Ace those interviews! Prepare effectively by reviewing the Top 50 Most Common Interview Questions on ResumeGemini.
- Navigate your job search with confidence! Explore a wide range of Career Tips on ResumeGemini. Learn about common challenges and recommendations to overcome them.
- Craft the perfect resume! Master the Art of Resume Writing with ResumeGemini’s guide. Showcase your unique qualifications and achievements effectively.
- Don’t miss out on holiday savings! Build your dream resume with ResumeGemini’s ATS optimized templates.
Q 16. Explain your experience with using the ‘Citation’ function in Atlas.ti.
The ‘Citation’ function in Atlas.ti is invaluable for creating a transparent and traceable analysis. It allows me to meticulously document the origin of my coded segments and the relationships between them. This is particularly important for ensuring the reproducibility and rigor of my research. I frequently use citations to link coded segments to specific sources, such as interview transcripts or survey responses. For example, if I code a segment related to ‘positive feedback,’ the citation will show precisely where that segment appears in the original data, allowing for easy verification and contextual understanding. This is vital for avoiding misinterpretations and maintaining the integrity of the analysis.
Beyond simple source linking, citations enable me to create robust networks of interconnected codes. Tracking citations through the different levels of coding and analysis provides a clear audit trail, making my research process fully transparent and easily auditable, which is a cornerstone of reputable qualitative research.
Q 17. How do you manage and organize your projects within Atlas.ti?
Managing and organizing projects in Atlas.ti is crucial for maintaining efficiency and clarity, especially when dealing with extensive datasets. I leverage several key strategies to achieve this. Firstly, I employ a hierarchical folder structure within the project, categorizing my data logically. This might involve creating folders for different data types (interviews, surveys, observations) or thematic categories emerging from the data.
Secondly, I utilize Atlas.ti’s robust system of queries and codebooks for organizing information. Queries allow me to create dynamic views of my data based on specific criteria, and codebooks aid in maintaining consistency and rigor in the coding process by ensuring all team members use the same coding scheme. Regularly reviewing and revising the project structure and codebook is key to maintaining an efficient workflow.
Finally, meticulous documentation – through memos and project notes – provides context and rationale behind decisions made throughout the analysis. This meticulous approach greatly enhances the clarity, transparency, and manageability of even the most complex qualitative projects.
Q 18. Explain your experience with creating and managing different user groups within Atlas.ti.
While I haven’t directly managed user groups in collaborative Atlas.ti projects (my work often involves solo analyses or direct collaboration with a single co-researcher), I understand the functionality and its importance. The ability to create different user groups with varying access levels is essential for collaborative research projects. For example, one group might have full editing rights, while another might have only read-only access to specific parts of the project. This granular control protects sensitive data and ensures that different team members have appropriate levels of involvement in the analysis.
I can anticipate the benefits of this feature, such as the ability to securely share data with collaborators while maintaining control over sensitive information. This functionality ensures a streamlined and secure collaborative workflow when working on large-scale projects.
Q 19. What are the different ways you can use the ‘Retrieve’ function in Atlas.ti?
The ‘Retrieve’ function in Atlas.ti is a powerful tool for analyzing relationships between different parts of your data. Its versatility allows for retrieving data based on various criteria, effectively acting as a flexible query system that transcends simple keyword searches.
I use ‘Retrieve’ in several ways: to locate all segments coded with a specific code; to find segments containing specific keywords or phrases; to identify segments linked to particular sources or documents; or to find segments that meet complex criteria, combining multiple search parameters (for example, segments coded with ‘positive feedback’ *and* mentioning a specific product). This function is incredibly useful for identifying patterns and relationships within the data, supporting the creation of comprehensive thematic analyses.
Furthermore, retrieving data allows me to easily compile and create summaries and reports based on the retrieved segments. This function facilitates a systematic and efficient way of generating insights from the qualitative data.
Q 20. How do you use Atlas.ti to identify themes and patterns in your data?
Identifying themes and patterns in qualitative data is the core objective of my work with Atlas.ti. My approach is iterative and involves several steps. It begins with open coding, where I systematically label segments of text with initial codes reflecting the content. As I code more data, I look for patterns and relationships between these codes. This leads to axial coding, where I group related codes into higher-level categories, developing thematic frameworks.
Atlas.ti’s visualization tools, such as the network view, are invaluable in this process. I can map the relationships between codes, identifying key themes and their interconnectedness. This visual representation helps me to detect emerging patterns and refine my thematic framework. Frequent review of the codebook and its evolution is essential for maintaining a coherent analysis, and the software’s features for managing and modifying codes allow for a fluid and responsive development of the thematic structure.
This iterative process of coding, pattern recognition, and refinement ensures a robust and nuanced understanding of the underlying themes in my data.
Q 21. Describe your experience with using Atlas.ti for longitudinal data analysis.
While Atlas.ti’s core strength lies in its ability to handle diverse qualitative data, its direct application to *longitudinal* data analysis isn’t as straightforward as other types of qualitative data. However, I adapt its capabilities for such analysis through careful planning and structuring. The key is to organize my data in a way that reflects the temporal dimension. This typically involves creating separate documents for each time point in the study and using a consistent coding scheme across all time points.
For example, I might use separate documents for interviews conducted at different stages of a program’s implementation. This allows me to track changes in participants’ opinions or experiences over time. I might create codes that specifically track changes or continuities across time points. Analyzing the relationships between codes across different time points allows for revealing the evolution of themes, trends, and changes.
The creation of summary reports using Atlas.ti’s reporting capabilities enables efficient analysis of changes over time. Therefore, while not designed specifically for longitudinal data, Atlas.ti can be effectively used by carefully organizing the data to capture the temporal dimension and by employing appropriate coding and analytical strategies.
Q 22. How proficient are you in using Atlas.ti’s reporting features?
My proficiency in Atlas.ti’s reporting features is extensive. I’m comfortable generating a wide variety of reports, from simple frequency counts to complex visualizations and narratives. I understand how to leverage the software’s capabilities to create reports that are both informative and persuasive, tailored to the specific needs of the audience. This includes customizing report layouts, selecting relevant variables, and interpreting the generated data to support my research conclusions. I can create reports that effectively communicate key findings using tables, charts, graphs, and textual summaries. I’m particularly skilled in using the report features to demonstrate the relationships between codes, allowing for a rich and nuanced understanding of the data. For instance, I can generate reports that show the co-occurrence of codes, illustrating how different themes intertwine within the data.
Q 23. Explain your workflow for analyzing qualitative data using Atlas.ti, from data import to report generation.
My Atlas.ti workflow is a systematic process focused on efficiency and rigor. It begins with data import, where I carefully choose the appropriate import method based on the data format (e.g., text files, audio, video). Following import, I systematically code my data, creating primary codes to capture the initial themes emerging from the data. I then refine these codes, creating sub-codes and relationships between codes to create a hierarchical structure that reflects the complexity of my data.
Next, I use Atlas.ti’s query tools to explore relationships between codes and identify patterns in the data. This often involves using the software’s built-in querying functionalities like co-occurrence matrices and network diagrams to visualize these relationships. Simultaneously, I constantly refine my coding scheme based on emerging patterns and insights from the data. Memoing is an integral part of this process, allowing me to record my thoughts, interpretations, and methodological decisions throughout the analysis. Finally, report generation involves selecting relevant coded segments and creating visually compelling presentations using charts, graphs, and textual summaries tailored to my audience and research questions. I use the software’s export functions to integrate my findings into reports and presentations in various formats, such as PDF, Word, or PowerPoint.
Q 24. How do you handle inconsistencies in your data using Atlas.ti?
Inconsistencies in qualitative data are inevitable, and Atlas.ti provides powerful tools to manage them. I address inconsistencies through careful coding and a rigorous process of reviewing and refining my coding scheme. Initially, I carefully define my codes to ensure clarity and consistency. Throughout the coding process, I maintain a detailed codebook, constantly updating it with examples and explanations of each code. If inconsistencies emerge during coding, I use Atlas.ti’s memoing feature to document my observations and rationale for resolving these conflicts. For example, if I encounter a segment that could be coded under multiple codes, I carefully consider the context and make a reasoned judgment based on my coding scheme. This process is iterative, involving regular review of my coding scheme and data to ensure consistency and accuracy. The use of inter-coder reliability checks, when working collaboratively, also helps identify and address inconsistencies. By documenting my decisions and actively addressing inconsistencies as they arise, I strive to maintain the validity and reliability of my analysis.
Q 25. Describe a time you had to troubleshoot a problem in Atlas.ti. What was the problem, and how did you solve it?
In one project involving a large dataset of interview transcripts, I encountered an issue with the software’s search functionality, resulting in incomplete search results. The problem stemmed from inconsistencies in the character encoding of the transcripts. The solution involved meticulously cleaning the data by standardizing the character encoding across all the transcripts before re-importing into Atlas.ti. I accomplished this by converting all transcripts to a universal encoding format using a text editor and then re-importing the cleaned files. This resolved the search problem and ensured the accuracy of my analysis. This experience underscored the importance of data cleaning and preparing the data properly before commencing the analysis in Atlas.ti.
Q 26. How do you ensure the trustworthiness of your findings using Atlas.ti?
Ensuring trustworthiness in qualitative research using Atlas.ti involves employing several strategies. Firstly, I maintain a detailed audit trail by documenting all coding decisions, changes to the coding scheme, and any methodological choices. This is largely facilitated by Atlas.ti’s memoing and codebook features. Secondly, I employ rigorous coding procedures involving multiple passes through the data, iterative refinement of my coding scheme, and checks for consistency and accuracy. Where feasible, inter-coder reliability checks are employed to ensure objectivity in coding decisions. Thirdly, I use rich quotations and illustrative examples from the data in my reports to support my interpretations and enhance the transparency of my analysis. Finally, I employ reflexivity, critically examining my own biases and perspectives and how they may influence the research process and interpretations, and explicitly documenting this process in the final report. By combining these strategies, I strive to achieve a high degree of trustworthiness in my findings.
Q 27. Describe your experience with using Atlas.ti for collaborative research projects.
My experience with Atlas.ti in collaborative research projects has been highly positive. Atlas.ti’s collaborative features are incredibly useful, allowing multiple researchers to simultaneously work on the same project, reducing redundancy and maximizing efficiency. The software allows for assigning different sections of the data to different researchers, each working on their own coding and analysis. Furthermore, the ability to share and comment on codes and memos fosters a shared understanding of the data and facilitates a rich discussion amongst researchers. Through this collaborative work, we are able to cross-check our coding and interpretations, identify potential biases, and improve the overall rigor and validity of the research process. It fosters a more comprehensive understanding of the data and results in more nuanced and robust research findings compared to working in isolation.
Key Topics to Learn for Atlas.ti (Qualitative Data Analysis Software) Interview
- Data Import & Management: Understanding different data import methods (e.g., text files, spreadsheets, audio/video transcripts) and efficient data organization within Atlas.ti. Practical application: Demonstrate your ability to import a diverse dataset and structure it logically for analysis.
- Coding & Categorization: Mastering the art of creating codes, categories, and their hierarchies. Practical application: Explain your approach to developing a robust coding scheme for a specific research question, considering issues of inter-coder reliability.
- Querying & Retrieval: Utilizing Atlas.ti’s powerful search functions to retrieve relevant data segments based on codes, keywords, or other criteria. Practical application: Describe how you would use different query types (e.g., Boolean searches, proximity searches) to answer a research question.
- Network Analysis: Exploring relationships between codes and data segments to identify patterns and themes. Practical application: Explain how you would visualize relationships between concepts using Atlas.ti’s network visualization tools.
- Memoing & Reporting: Effectively using memos for documenting analysis, interpretations, and insights; generating reports to present findings. Practical application: Describe your approach to structuring a compelling and insightful report based on your Atlas.ti analysis.
- Data Visualization: Utilizing Atlas.ti’s visualization tools to present key findings in a clear and concise manner. Practical application: Explain how visual representations aid in interpretation and communication of qualitative data.
- Theoretical Frameworks: Demonstrate an understanding of how Atlas.ti can be applied within established qualitative research paradigms (e.g., grounded theory, thematic analysis). Practical application: Explain how your chosen analytical approach aligns with the software’s functionalities.
Next Steps
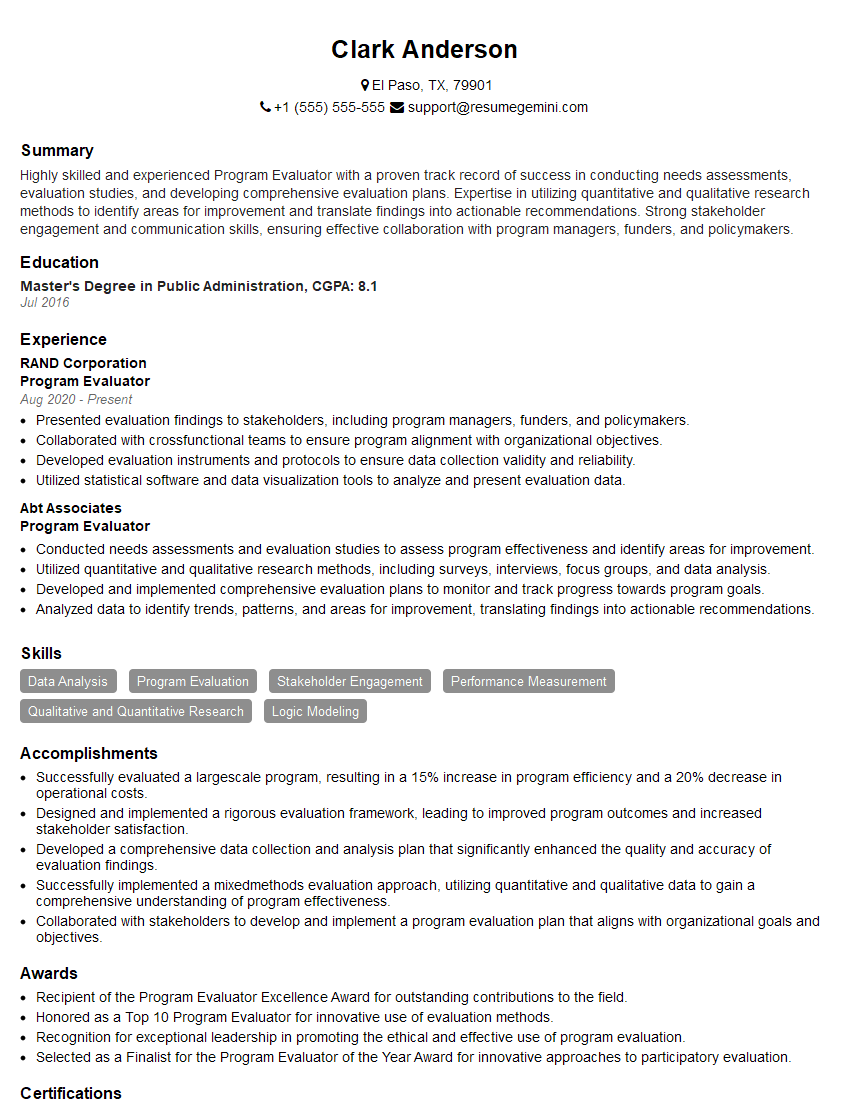
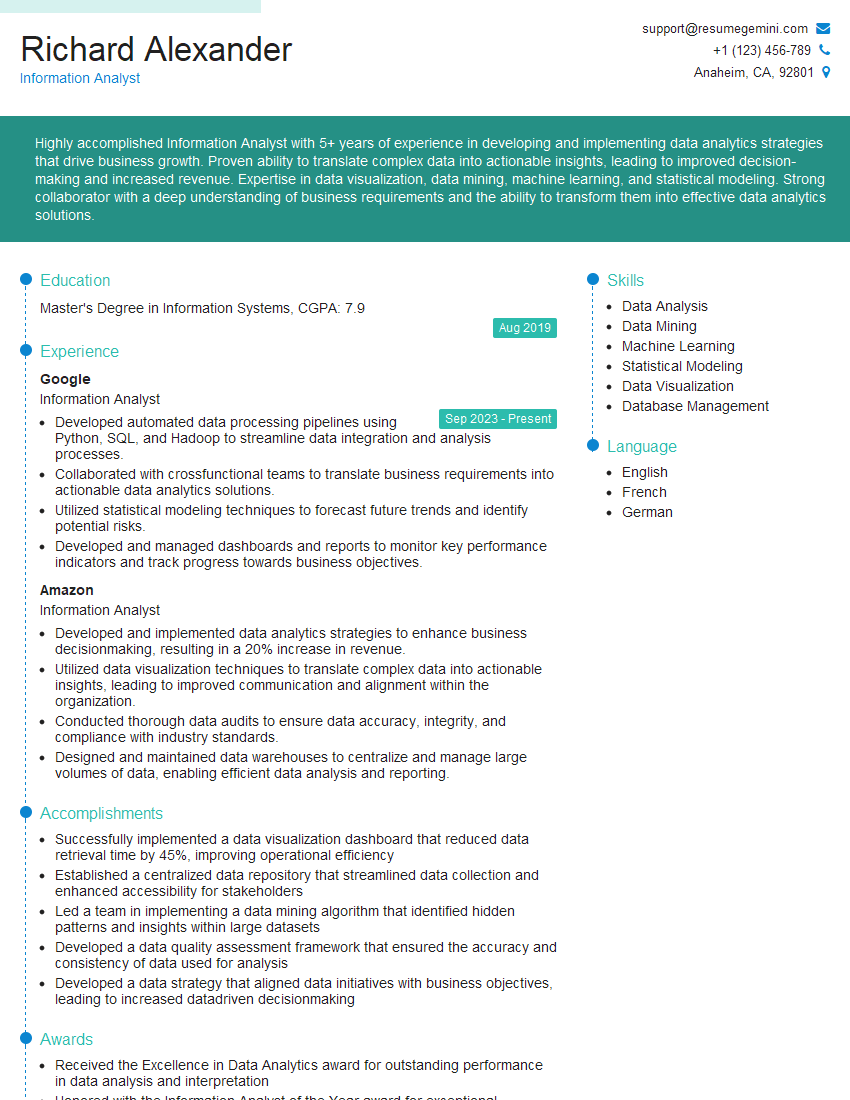
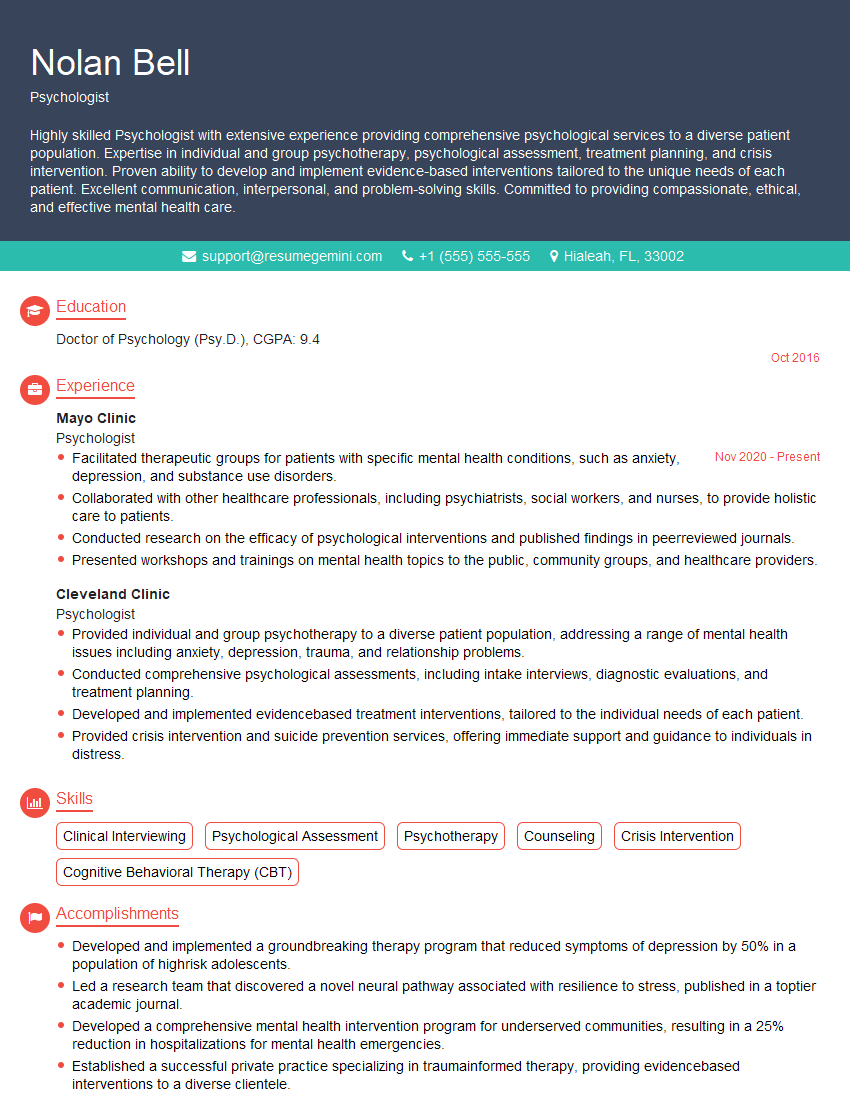
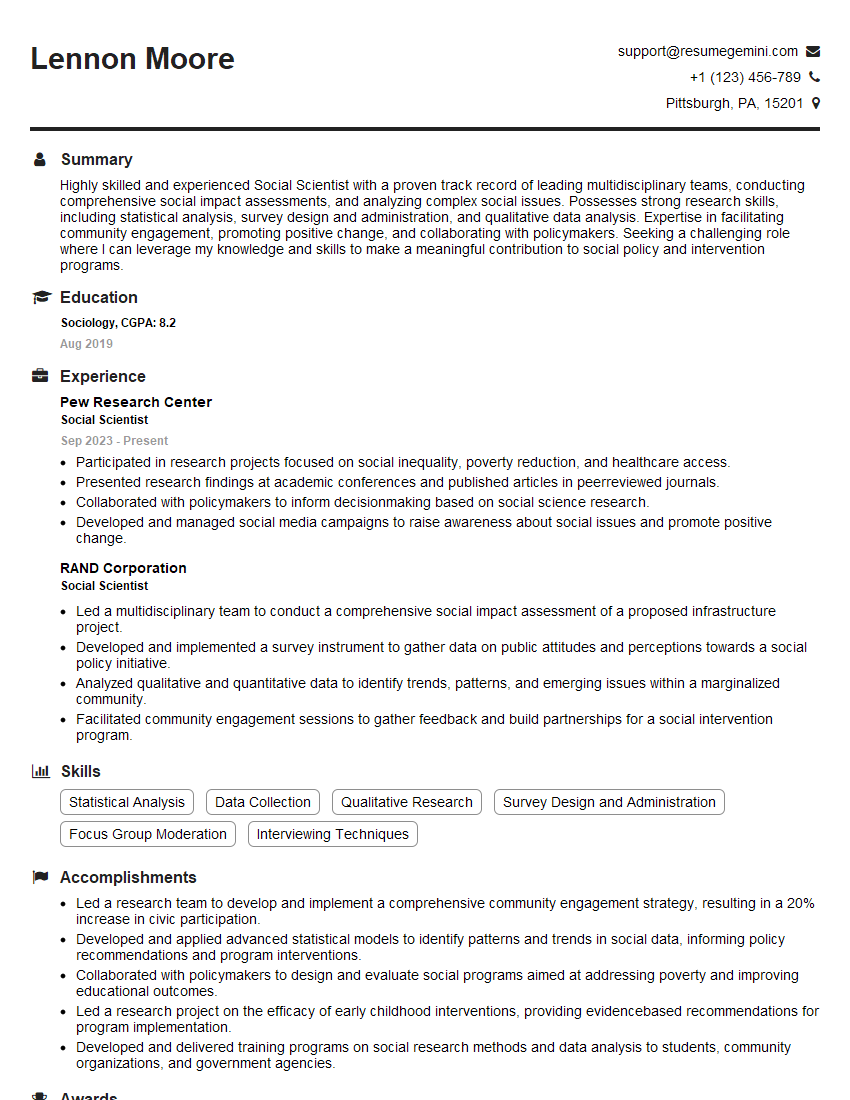
Mastering Atlas.ti significantly enhances your marketability in research, social sciences, and related fields. Proficiency in this software demonstrates valuable analytical skills and boosts your competitiveness in a demanding job market. To further strengthen your job applications, invest time in creating an ATS-friendly resume that highlights your Atlas.ti expertise. ResumeGemini is a trusted resource to help you build a professional and impactful resume. Examples of resumes tailored to showcase Atlas.ti skills are available to guide you.
Explore more articles
Users Rating of Our Blogs
Share Your Experience
We value your feedback! Please rate our content and share your thoughts (optional).
What Readers Say About Our Blog
This was kind of a unique content I found around the specialized skills. Very helpful questions and good detailed answers.
Very Helpful blog, thank you Interviewgemini team.


