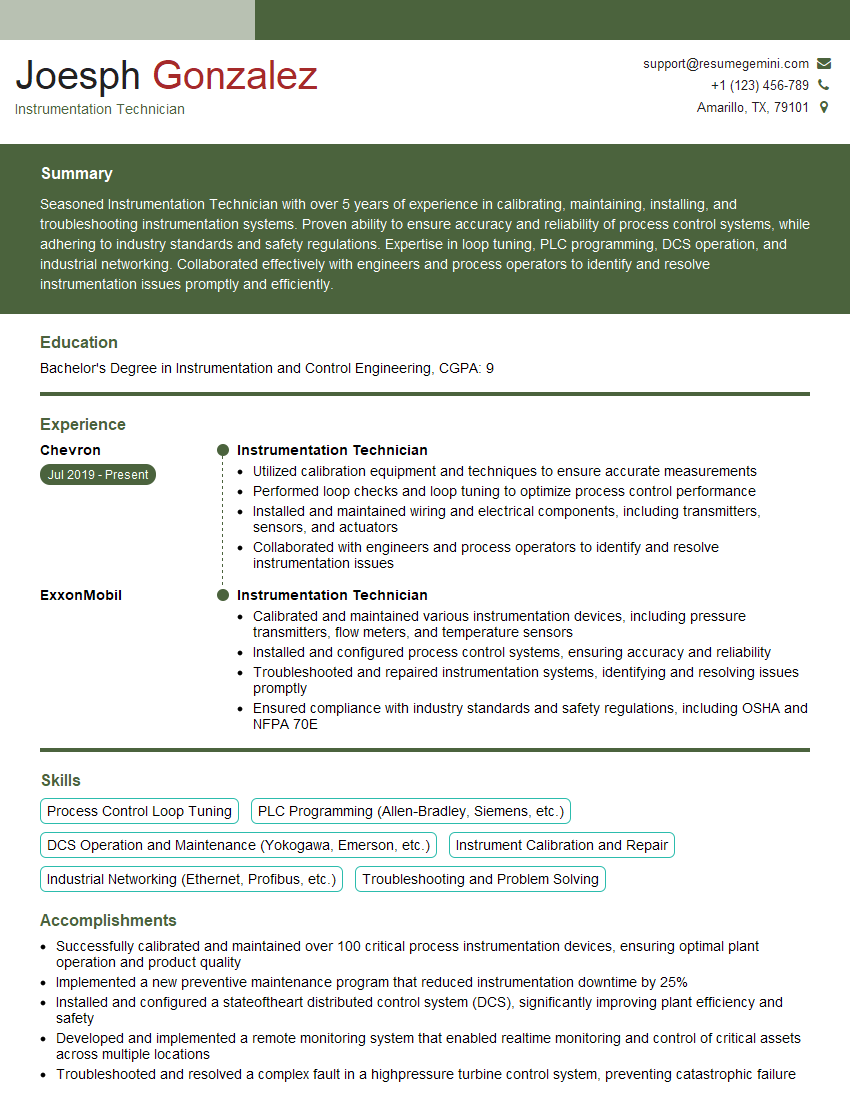
Interviews are opportunities to demonstrate your expertise, and this guide is here to help you shine. Explore the essential Analytical Instrumentation Operation interview questions that employers frequently ask, paired with strategies for crafting responses that set you apart from the competition.
Questions Asked in Analytical Instrumentation Operation Interview
Q 1. Explain the principles of Gas Chromatography (GC).
Gas Chromatography (GC) is a powerful analytical technique used to separate and analyze volatile compounds in a sample. Imagine it like a race track for molecules. The principle is based on the differential partitioning of sample components between a mobile phase (a gas, usually helium or nitrogen) and a stationary phase (a liquid or solid coated on a column).
The sample is injected into the GC system and carried by the mobile phase through a long, thin column. Different compounds interact differently with the stationary phase; some molecules have stronger affinities and spend more time interacting with the stationary phase, while others move through faster. This difference in interaction times leads to the separation of the components. The separated compounds then reach a detector at different times, producing a chromatogram – a graph showing the signal intensity versus time. This chromatogram reveals both qualitative (identification of compounds) and quantitative (amount of each compound) information about the sample. For example, in environmental monitoring, GC is used to analyze the presence and concentration of volatile organic compounds (VOCs) in air or water samples.
- Mobile Phase: Carries the sample through the column.
- Stationary Phase: Provides the selective interaction with different sample components.
- Column: The heart of the system; provides the separation. Different column chemistries (e.g., non-polar, polar) allow for separation of diverse compound types.
- Detector: Detects and measures the separated compounds. Common examples include Flame Ionization Detectors (FID) and Mass Spectrometers (MS).
Q 2. Describe the different types of detectors used in HPLC.
High-Performance Liquid Chromatography (HPLC) uses various detectors to quantify the separated components. The choice depends on the nature of the analytes. Some common types include:
- UV-Vis Detector: The most common, measuring the absorbance of light at a specific wavelength. Suitable for compounds with chromophores (light-absorbing groups). It’s like shining a light through the solution – the more light absorbed, the more compound present. Many organic molecules absorb UV or visible light.
- Refractive Index (RI) Detector: Measures changes in the refractive index of the mobile phase. It’s less sensitive than UV-Vis and is used for compounds that do not absorb UV or visible light, like carbohydrates or polymers. Think of it like measuring how much light is bent as it passes through the solution.
- Fluorescence Detector: Detects compounds that fluoresce (emit light) upon excitation with a specific wavelength of light. Very sensitive for fluorescent compounds. It’s like shining a specific light on the solution and seeing how much it glows.
- Electrochemical Detector: Measures changes in electrical current due to the presence of electrochemically active compounds. It’s often used for detecting easily oxidized or reduced compounds like neurotransmitters or vitamins.
- Mass Spectrometer (MS): Provides structural information as well as quantitative data by measuring the mass-to-charge ratio of the separated components. This is the most powerful detector, capable of highly sensitive and specific analysis, often used for structural elucidation and confirming compound identity.
Q 3. What are the common causes of baseline drift in UV-Vis spectroscopy?
Baseline drift in UV-Vis spectroscopy refers to a gradual change in the absorbance signal over time, even in the absence of any sample. It’s like the floor of the graph moving up or down. Several factors contribute:
- Temperature fluctuations: Changes in temperature can affect the absorbance of the solvent or the instrument itself.
- Changes in solvent composition: Degradation of the solvent or contamination can cause drift.
- Stray light: Unwanted light entering the detector can cause noise and drift.
- Detector instability: Malfunctioning detector components can also lead to drift.
- Dirty cuvettes: Fingerprints or other contaminants on the cuvettes can introduce inconsistencies.
- Warm-up time: The instrument may require sufficient warm-up time to stabilize.
Proper instrument maintenance, using high-quality solvents, and ensuring stable operating conditions can help minimize baseline drift.
Q 4. How do you troubleshoot a clogged HPLC column?
Troubleshooting a clogged HPLC column requires a systematic approach. First, determine the severity of the clog. A small particle may be easily cleared, while more significant blockages require more intensive solutions.
- Try flushing with a stronger solvent: Begin with a solvent stronger than the mobile phase, like 100% acetonitrile or isopropanol. Increase the flow rate gradually. This will attempt to dissolve or push through the obstruction. Monitor the pressure.
- Backflush the column: (Only if the column allows) Reverse the direction of the mobile phase to remove particles that may be lodged at the column inlet frit.
- Sonicate the column: This involves placing the column in a sonicator bath with a suitable solvent. Ultrasound waves can help dislodge the blockage. Care must be taken to avoid damaging the column.
- Use a column cleaning solution: Specific cleaning solutions are available that are designed to remove certain types of blockages. Follow the manufacturer’s instructions carefully.
- Replace the column frit: If the clog is severe and cleaning methods fail, the column frit may be damaged and need replacing.
- Replace the column: In the case of persistent or irreversible clogging, the column may have to be replaced.
Always check for pressure increases, which indicate blockage. Proper column care, including the use of filters to prevent particulates from entering the column, is key to preventing this problem.
Q 5. Explain the difference between qualitative and quantitative analysis.
Qualitative analysis identifies the components present in a sample, while quantitative analysis determines the amount of each component. It’s like identifying the ingredients in a cake (qualitative) versus measuring the amount of flour, sugar, and eggs (quantitative).
Qualitative Analysis: Uses techniques like mass spectrometry (MS) or retention time in chromatography to identify compounds by comparing them to known standards. Think of it like a detective matching fingerprints.
Quantitative Analysis: Measures the amount of each component. This often involves using calibration curves, internal standards, or other methods to relate the signal from the instrument to the concentration of the analyte. This is like the baker precisely weighing each ingredient.
Q 6. What are the key parameters to consider when optimizing an HPLC method?
Optimizing an HPLC method involves carefully selecting parameters to achieve the best separation, sensitivity, and reproducibility. Key parameters include:
- Mobile Phase Composition: The ratio of solvents affects the separation. Different solvents have different polarities, influencing how strongly compounds interact with the stationary phase.
- Gradient Profile: A gradual change in the mobile phase composition during the run enhances separation, especially for complex mixtures.
- Flow Rate: Affects the speed of separation and peak resolution. Higher flow rates can result in faster analysis but may compromise resolution.
- Column Choice: The stationary phase of the column needs to be compatible with the sample type. Different columns have different polarities and particle sizes.
- Column Temperature: Affects the retention time and peak shape; it’s particularly relevant when dealing with temperature-sensitive compounds.
- Injection Volume: The amount of sample injected affects peak shape and resolution. Too much sample can lead to peak broadening and poor resolution.
- Detector Settings: Wavelength selection (for UV-Vis), detector sensitivity, etc., all impact the signal and the quality of data.
Method optimization often involves trial and error to identify the optimal settings which balance speed and efficiency with good separation and acceptable signal-to-noise ratios.
Q 7. Describe your experience with mass spectrometry techniques (e.g., LC-MS, GC-MS).
I have extensive experience with mass spectrometry techniques, particularly LC-MS and GC-MS. In my previous role, I was responsible for method development, sample analysis, and data interpretation using both techniques. For example, I developed an LC-MS method to quantify several different pharmaceuticals in biological samples (plasma and urine), which involved optimizing the chromatographic conditions (column choice, gradient, flow rate) as well as the mass spectrometry parameters (ionization mode, MS/MS fragmentation). This resulted in a validated method that was robust, sensitive and specific for routine analysis. Similarly, I have also utilized GC-MS for the analysis of volatile organic compounds (VOCs) in environmental samples. My experience extends to troubleshooting issues related to these instruments and interpreting complex mass spectra, including the use of various software packages for data processing and analysis. I am proficient in identifying and quantifying compounds, understanding fragmentation patterns, and identifying unknown compounds based on their mass spectral data. I also have expertise in different ionization techniques, such as electrospray ionization (ESI) and atmospheric pressure chemical ionization (APCI) for LC-MS, and electron ionization (EI) and chemical ionization (CI) for GC-MS. This allows me to select the most appropriate technique based on the nature of the analyte and the desired sensitivity and specificity.
Q 8. How do you ensure the accuracy and precision of analytical measurements?
Ensuring the accuracy and precision of analytical measurements is paramount in any analytical laboratory. Accuracy refers to how close a measurement is to the true value, while precision refers to the reproducibility of the measurement. We achieve this through a multi-faceted approach.
Proper Instrument Calibration and Maintenance: Regular calibration using certified reference materials is crucial. This ensures the instrument is functioning within its specified tolerances. For example, in HPLC (High-Performance Liquid Chromatography), we calibrate the system using a mixture of known concentrations to verify peak retention times and response factors.
Method Validation: A validated analytical method provides documented evidence that the method is fit for its intended purpose. This includes assessing parameters like linearity, accuracy, precision, limit of detection (LOD), and limit of quantification (LOQ). This validation process ensures that the chosen method is reliable and produces consistent, accurate results.
Use of Controls and Blanks: Including blanks (samples without the analyte) and controls (samples with known concentrations of the analyte) in every analytical batch helps detect and correct for systematic errors or contamination. For instance, in a spectrophotometric analysis, a blank sample helps to subtract background absorbance.
Proper Sample Handling and Preparation: Careful sample preparation, including appropriate storage, handling and pre-treatment (e.g., filtration, extraction, dilution) is critical for minimizing errors introduced during sample handling and preventing analyte degradation or loss.
Quality Control (QC) Charts: Tracking data using control charts allows us to monitor the performance of the method and instrument over time and identify potential trends indicating a problem before it significantly impacts the accuracy and precision of results.
By consistently applying these strategies, we can significantly improve the reliability and trustworthiness of our analytical data.
Q 9. Explain the concept of method validation in analytical chemistry.
Method validation in analytical chemistry is a systematic process to demonstrate that an analytical method is suitable for its intended purpose. It involves a series of experiments to assess the method’s performance characteristics.
Specificity: The ability of the method to measure the analyte of interest in the presence of other components in the sample matrix.
Linearity: The ability of the method to produce results that are directly proportional to the analyte concentration within a given range.
Accuracy: How close the measured value is to the true value.
Precision: The reproducibility of the measurements – how close repeated measurements are to each other.
Limit of Detection (LOD): The lowest concentration of the analyte that can be reliably detected.
Limit of Quantification (LOQ): The lowest concentration of the analyte that can be reliably quantified.
Robustness: The ability of the method to remain unaffected by small, deliberate variations in the experimental parameters.
A well-documented method validation ensures that the results are reliable, accurate, and fit for their intended use, for example, complying with regulatory requirements or supporting critical decision-making.
Q 10. What are the regulatory requirements for analytical testing in your industry?
Regulatory requirements for analytical testing vary depending on the industry and the specific analyte being measured. However, some general principles and standards apply across many sectors. In the pharmaceutical industry, for instance, Good Manufacturing Practices (GMP) and regulations from agencies like the FDA (Food and Drug Administration) mandate strict adherence to quality control measures throughout the process. This includes detailed documentation of methods, validation, and quality control procedures.
Similarly, environmental testing labs must comply with regulations set by agencies like the EPA (Environmental Protection Agency), dictating specific methods and quality assurance procedures for various environmental pollutants. These regulations often involve accreditation through organizations like ISO/IEC 17025, which establishes internationally recognized standards for laboratory competence.
Across industries, data integrity, traceability, and adherence to established standard operating procedures (SOPs) are vital aspects to ensure compliance and maintain the reliability and integrity of the analytical data generated.
Q 11. How do you handle outliers in analytical data?
Outliers in analytical data are values that significantly deviate from the other data points. Handling outliers requires careful consideration and should not be done arbitrarily. A thorough investigation is needed to determine the cause of the outlier.
Identify Potential Causes: The first step involves investigating potential sources of error, such as instrument malfunction, sample contamination, or calculation mistakes. For example, a sudden spike in temperature in the laboratory might affect a sensitive measurement.
Statistical Analysis: Statistical tests, like the Grubbs’ test, can help determine if an outlier is statistically significant. However, blindly rejecting outliers based solely on statistical tests is not recommended.
Review Raw Data and Experimental Conditions: Examine the raw data and associated experimental notes for clues about the outlier’s origin. Look for irregularities in the experimental procedure or instrument readings.
Repeat the Measurement: If possible, repeat the measurement under the same conditions to verify if the outlier is reproducible. If the outlier is not reproducible, it is likely a random error.
Data Reporting: Even after thorough investigation, if the outlier cannot be explained and removed, it should be documented and reported appropriately, along with an explanation of its potential influence on the overall results. Transparency is key.
Q 12. Describe your experience with different types of sample preparation techniques.
My experience encompasses a wide range of sample preparation techniques, critical for ensuring accurate and reliable analytical results. The choice of technique depends heavily on the sample matrix, analyte properties, and the analytical technique employed.
Liquid-Liquid Extraction (LLE): I have extensive experience using LLE to separate analytes based on their solubility in different solvents. This is often employed to remove interfering substances before analysis.
Solid-Phase Extraction (SPE): SPE uses a solid sorbent to selectively extract analytes from a liquid sample. I’ve used SPE extensively for cleaning up environmental samples before analysis by GC-MS (Gas Chromatography-Mass Spectrometry).
Microwave-Assisted Extraction (MAE): MAE utilizes microwave energy to accelerate extraction, reducing extraction time and solvent consumption. I’ve used this for extracting compounds from plant materials.
Solid-Phase Microextraction (SPME): SPME is a solvent-free technique that uses a fiber coated with a specific sorbent to extract analytes directly from the sample matrix. This is often used for volatile compound analysis.
Digestion: For elemental analysis, I’ve performed acid digestion to dissolve solid samples and release the analytes into solution for techniques like AAS (Atomic Absorption Spectroscopy).
Proper sample preparation is often the most crucial step, directly impacting the accuracy and reliability of the final results. Choosing the appropriate technique and carefully controlling parameters ensures data quality.
Q 13. Explain the principles of atomic absorption spectroscopy (AAS).
Atomic Absorption Spectroscopy (AAS) is a quantitative technique used to determine the concentration of a specific element in a sample. It’s based on the principle that atoms of each element absorb light at characteristic wavelengths. The instrument uses a hollow cathode lamp (HCL) that emits light specific to the element being analyzed. This light passes through a flame or graphite furnace containing the atomized sample. Atoms of the element in the sample absorb some of the light, and the amount of light absorbed is directly proportional to the concentration of the element in the sample.
The process involves several steps: sample introduction (usually as a liquid solution), atomization (converting the sample into free atoms), light absorption, and signal detection. The amount of light absorbed is measured by a detector and converted into an absorbance value which is then used to determine the concentration using a calibration curve.
There are two main types of AAS: flame AAS and graphite furnace AAS. Flame AAS is simpler and faster, but graphite furnace AAS provides higher sensitivity, allowing for the detection of lower concentrations of the element.
Q 14. How do you maintain and calibrate analytical instruments?
Maintaining and calibrating analytical instruments is crucial for ensuring accurate and reliable results. This involves a combination of preventive maintenance, regular calibration, and thorough documentation.
Preventive Maintenance: This includes regular cleaning, checking for leaks, replacing worn parts, and verifying the functionality of all components according to the manufacturer’s instructions. For example, in a GC (Gas Chromatography) system, we would regularly check the carrier gas flow rate, column integrity, and detector performance.
Calibration: Calibration involves using certified reference materials (CRMs) of known concentrations to verify the instrument’s accuracy and linearity. Calibration frequency depends on the instrument and its usage, and is often dictated by regulatory requirements or internal quality control protocols. For example, in a spectrophotometer, we use certified standards with known absorbance values to calibrate the instrument.
Documentation: Meticulous record-keeping is essential. This includes logging all maintenance procedures, calibration data, and any issues or repairs. This documentation is critical for demonstrating compliance with regulatory standards and ensuring data traceability.
Training: Proper training for instrument operators is vital. Technicians must be well-versed in the operation, maintenance, and troubleshooting of each instrument to minimize errors and maintain its optimal performance.
A well-maintained and calibrated instrument is essential for producing high-quality, reliable analytical data. A proactive approach to maintenance is more cost-effective than dealing with instrument failures or data inaccuracies.
Q 15. What software packages are you proficient in for data analysis (e.g., Empower, Chromeleon)?
My proficiency in data analysis software spans several leading packages commonly used in analytical chemistry. I’m highly experienced with Empower and Chromeleon, both widely used in HPLC and UHPLC data acquisition and processing. Empower, for instance, is excellent for managing large datasets, generating reports, and performing complex calculations. I’ve used it extensively in pharmaceutical quality control, analyzing chromatograms for impurity profiling and quantification. Chromeleon, on the other hand, offers strong system control and data integration capabilities, particularly useful in regulated environments. I’ve utilized it in method development and validation projects, leveraging its features for peak integration, calibration curve generation, and compliance reporting. Beyond these two, I’m also familiar with OpenLab CDS (Agilent) and EZChrom Elite, each providing unique functionalities and advantages depending on the specific application. My experience allows me to efficiently select and utilize the most appropriate software based on the instrumentation and analytical needs of the project.
Career Expert Tips:
- Ace those interviews! Prepare effectively by reviewing the Top 50 Most Common Interview Questions on ResumeGemini.
- Navigate your job search with confidence! Explore a wide range of Career Tips on ResumeGemini. Learn about common challenges and recommendations to overcome them.
- Craft the perfect resume! Master the Art of Resume Writing with ResumeGemini’s guide. Showcase your unique qualifications and achievements effectively.
- Don’t miss out on holiday savings! Build your dream resume with ResumeGemini’s ATS optimized templates.
Q 16. Describe your experience with instrument troubleshooting and maintenance.
Troubleshooting and maintenance are integral parts of my daily work. My experience encompasses a wide range of instruments, including HPLC, GC, and ICP-MS. For example, while working on an HPLC system experiencing inconsistent retention times, I systematically investigated potential sources of the problem: pump seals, column condition, and mobile phase degassing. The root cause was identified as a partially clogged frit in the injector, which was subsequently cleaned, restoring instrument performance. Similarly, with GC troubleshooting, I’ve diagnosed issues related to detector sensitivity, carrier gas leaks, and septum degradation. I employ a methodical approach, beginning with a visual inspection, followed by checking system diagnostics, and then investigating potential faults based on error messages or observed anomalies. This is followed by documentation and preventive maintenance to ensure optimal instrument performance and longevity. Preventive maintenance schedules are meticulously followed, including column regeneration, detector cleaning, and system calibration, all in adherence to GLP guidelines.
Q 17. Explain the concept of limit of detection (LOD) and limit of quantitation (LOQ).
The Limit of Detection (LOD) and Limit of Quantitation (LOQ) are critical parameters in analytical chemistry, defining the lowest concentration of an analyte that can be reliably detected and quantified, respectively. The LOD represents the lowest concentration that can be distinguished from background noise with a certain level of confidence, often expressed as a signal-to-noise ratio (S/N). A typical threshold is S/N = 3. Imagine trying to hear a faint whisper in a noisy room – the LOD is the quietest whisper you can still discern from the ambient noise. The LOQ, on the other hand, is the lowest concentration that can be measured with acceptable accuracy and precision, usually defined as S/N = 10. This is like not just hearing the whisper, but also understanding what it says. Both LOD and LOQ are essential for assessing the sensitivity and reliability of an analytical method. Their values are typically determined experimentally, often by analyzing samples with known low concentrations of the analyte and calculating the standard deviation of the measurements.
Q 18. How do you ensure the quality control of your analytical results?
Ensuring the quality control of analytical results is paramount. I utilize a multi-faceted approach encompassing several key strategies. First, instrument calibration and validation are regularly performed using certified reference materials. Second, control charts are used to monitor instrument performance and identify potential drift or systematic errors. Third, I employ quality control samples (QCs) – samples of known concentration – interspersed within the analytical run to verify the accuracy and precision of the results. Any significant deviation from the expected QC values triggers an investigation to identify and correct the source of error. Finally, meticulous documentation of all procedures, data, and calibrations is maintained to ensure traceability and compliance with regulatory standards (e.g., GLP, GMP). This comprehensive approach helps to maintain the highest level of confidence in the validity and reliability of my analytical results.
Q 19. Describe your experience with different types of chromatography (e.g., GC, HPLC, SFC).
My experience with chromatographic techniques includes Gas Chromatography (GC), High-Performance Liquid Chromatography (HPLC), and Supercritical Fluid Chromatography (SFC). GC is best suited for volatile and thermally stable compounds, often used in analyzing environmental samples or petroleum products. I’ve utilized GC-MS extensively for identifying and quantifying various organic pollutants. HPLC is versatile, enabling the analysis of a broad range of non-volatile compounds, including pharmaceuticals and biomolecules. My expertise involves both reversed-phase and normal-phase HPLC methods, applied to various projects including pharmaceutical impurity analysis and quality control. SFC bridges the gap between GC and HPLC, offering advantages for separating chiral compounds and less polar molecules that are difficult to analyze using traditional HPLC or GC. I have experience employing SFC for analyzing natural products and pharmaceuticals. My selection of the appropriate chromatographic technique is always based on the properties of the analytes and the analytical goals.
Q 20. What are the advantages and disadvantages of different detection methods in chromatography?
Chromatographic detection methods offer diverse advantages and disadvantages depending on the specific application. UV-Vis detection is widely used in HPLC due to its simplicity, cost-effectiveness, and wide applicability, but it lacks sensitivity for compounds lacking a chromophore. Mass Spectrometry (MS) detection, coupled with GC or HPLC, provides structural information and high sensitivity, but is significantly more expensive and complex to operate. Fluorescence detection offers exceptional sensitivity for compounds with fluorescent properties, but its applicability is limited. Electrochemical detection is highly sensitive for electroactive compounds, but suffers from susceptibility to interferences. The choice of detection method is critical for maximizing both sensitivity and selectivity. For example, in analyzing trace levels of pesticides in food samples, a highly sensitive method like MS detection would be preferred over UV-Vis detection. Conversely, for routine quality control, a simpler, less expensive technique like UV-Vis may be sufficient.
Q 21. Explain the principles of Inductively Coupled Plasma Mass Spectrometry (ICP-MS).
Inductively Coupled Plasma Mass Spectrometry (ICP-MS) is a powerful analytical technique used for determining the elemental composition of a sample. It involves introducing the sample into an inductively coupled plasma (ICP), a high-temperature plasma generated by coupling an argon gas flow with a radio-frequency electromagnetic field. The ICP atomizes and ionizes the sample, forming a plasma consisting of charged atoms (ions). These ions are then passed through a mass spectrometer, which separates them based on their mass-to-charge ratio. The abundance of each ion is measured, providing quantitative information about the elemental composition of the original sample. ICP-MS is highly sensitive, capable of detecting trace elements at parts-per-billion (ppb) or parts-per-trillion (ppt) levels. It finds widespread application in various fields, including environmental monitoring, food safety analysis, and geological studies. For example, I’ve utilized ICP-MS to analyze heavy metal contamination in soil samples, providing crucial data for environmental risk assessment.
Q 22. Describe your experience with data processing and reporting in analytical chemistry.
My experience with data processing and reporting in analytical chemistry is extensive, encompassing various techniques and software. I’m proficient in using chromatography data systems (CDS) like Agilent OpenLab and Empower, as well as spectroscopic software like Thermo Scientific Omnic. This involves tasks beyond simple data acquisition. I routinely perform baseline correction, peak integration, and calibration curve generation. For example, in a recent HPLC analysis of pharmaceuticals, I used OpenLab to process chromatograms, integrate peak areas, and apply a multi-point calibration to determine the concentration of active pharmaceutical ingredients. Furthermore, I create comprehensive reports, including method validations, statistical analyses (e.g., ANOVA, t-tests), and graphical representations of results. These reports are tailored to the specific needs of the project and the audience, ensuring clarity and accuracy. I am also experienced in exporting data into various formats (CSV, PDF, Excel) for further analysis or use in other applications.
Beyond routine data processing, I’ve been involved in developing automated data processing workflows using scripting languages like Python to streamline data analysis for large datasets, significantly reducing the time required for report generation. This includes implementing quality control checks within the scripts to ensure data integrity. I also have experience with LIMS (Laboratory Information Management Systems) integration for data management and tracking.
Q 23. How do you interpret and present analytical data to non-technical audiences?
Communicating analytical data effectively to non-technical audiences requires a shift in perspective and language. I avoid jargon and technical terms whenever possible, using clear and concise language, analogies, and visuals to explain complex concepts. For example, instead of saying “the retention time of the analyte was 5.2 minutes,” I might explain, “The substance we’re interested in appeared on the detector after 5.2 minutes, indicating its unique properties.” I frequently use charts, graphs, and tables to present data in an easily digestible format. Visuals help to show trends and highlight key findings more effectively than raw data. In presentations, I aim to focus on the key results and their implications, rather than dwelling on technical details. For instance, instead of focusing on the precise concentration of a contaminant, I might emphasize the level of contamination compared to a safety threshold and discuss the potential impact on product quality or human health.
A practical example includes explaining the results of a water quality analysis to a group of community leaders. Instead of providing a detailed list of chemical concentrations, I’d focus on whether the water is safe for drinking, highlighting any exceedances of regulatory limits using easily understood bar charts. This approach allows non-technical audiences to understand the implications of the data without getting lost in technical details.
Q 24. Explain the principles of Fourier Transform Infrared Spectroscopy (FTIR).
Fourier Transform Infrared Spectroscopy (FTIR) is a powerful analytical technique used to identify and quantify molecules based on their interaction with infrared light. The principle lies in the fact that molecules vibrate at specific frequencies depending on their structure and bond types. When infrared light is shone on a sample, certain frequencies are absorbed by the molecules, causing these bonds to vibrate more strongly. The pattern of absorbed frequencies is unique to each molecule, acting like a “fingerprint” allowing for identification.
The FTIR instrument uses an interferometer to produce a broad range of infrared frequencies simultaneously. This interferogram is then mathematically transformed using a Fourier transform, which converts the complex interferogram into a spectrum showing the absorbance or transmittance as a function of frequency (or wavenumber). This spectrum displays peaks at specific frequencies corresponding to the vibrational modes of the molecules in the sample. By comparing this spectrum to a library of known spectra, the components of the sample can be identified, and their concentrations can be determined using appropriate calibration techniques.
For example, FTIR can be used to analyze the composition of polymers by identifying the characteristic absorption bands of the various functional groups present in the polymer chain. This information is crucial for quality control and material characterization. In the pharmaceutical industry, FTIR is routinely employed for the identification and quality control of raw materials and finished products.
Q 25. How do you ensure the safety and compliance of analytical procedures?
Ensuring the safety and compliance of analytical procedures is paramount. This involves adhering to strict protocols and regulations, including the use of appropriate personal protective equipment (PPE), such as safety glasses, gloves, and lab coats. Proper handling and disposal of chemicals are vital, following established safety data sheets (SDS) and waste disposal guidelines. Regular maintenance and calibration of instruments are also crucial to ensure accurate and reliable data. Calibration and maintenance logs are meticulously maintained, showing compliance with schedules.
Furthermore, I strictly follow standard operating procedures (SOPs) for each analytical method. These SOPs outline the steps involved in the procedure, including sample preparation, instrument operation, data analysis, and quality control measures. This ensures consistency and reproducibility of results. Regular training on safety procedures and updates to SOPs are undertaken to maintain proficiency and adapt to evolving best practices. Finally, I meticulously document all aspects of the analytical process, including instrument parameters, sample details, and results, maintaining a detailed audit trail for traceability and compliance.
Q 26. Describe your experience with working in a regulated environment (e.g., GMP, GLP).
My experience in regulated environments, specifically adhering to Good Manufacturing Practices (GMP) and Good Laboratory Practices (GLP), is extensive. In previous roles, I’ve been involved in the analysis of pharmaceutical products, where adherence to GMP is mandatory. This involved meticulous documentation of all aspects of the analytical process, including method validation, sample tracking, and instrument calibration. We regularly conducted audits to ensure compliance with regulatory guidelines, and I participated actively in these activities. I am well-versed in the requirements for data integrity, including electronic records and signatures.
Similarly, I’ve worked in environments governed by GLP principles for environmental testing. In such settings, the focus is on maintaining the integrity and reliability of the analytical data. This entails strict adherence to SOPs, detailed documentation, and rigorous quality control measures. The rigorous quality control procedures included checks on calibration standards, blanks, and controls for accuracy and precision, ensuring data integrity.
Q 27. What are some common sources of error in analytical measurements, and how do you minimize them?
Analytical measurements are susceptible to various sources of error, broadly categorized as random and systematic errors. Random errors are unpredictable fluctuations that lead to variations in results, even under the same conditions. These can arise from instrument noise, variations in sample preparation, or even minor variations in the analyst’s technique. Systematic errors, on the other hand, are consistent and predictable biases that affect the accuracy of the measurements. These can be due to instrument drift, inaccurate calibration standards, or interference from other substances in the sample.
Minimizing these errors involves employing several strategies. For random errors, techniques like repeated measurements and statistical analysis (e.g., calculating the mean and standard deviation) help to assess the precision of the results. Using higher-quality instrumentation with low noise levels is also important. For systematic errors, careful calibration and standardization of the instruments are essential. Regular instrument maintenance and employing appropriate quality control samples (e.g., blanks, standards) can significantly reduce these errors. Furthermore, meticulous sample preparation and using appropriate analytical methods can drastically minimize potential errors. A proper understanding of potential sources of interference in the samples is key to choosing suitable methods and applying appropriate corrections. For example, matrix effects in chromatography can be mitigated through careful sample preparation or using internal standards.
Key Topics to Learn for Analytical Instrumentation Operation Interview
- Instrumentation Fundamentals: Understanding the principles behind various analytical instruments (e.g., chromatography, spectroscopy, mass spectrometry). This includes theoretical concepts like signal-to-noise ratio and detection limits.
- Method Development and Validation: Learn about the practical application of developing and validating analytical methods, including considerations for accuracy, precision, and linearity. Focus on understanding the regulatory requirements.
- Data Analysis and Interpretation: Mastering the skills to process, analyze, and interpret data generated by analytical instruments. This involves understanding statistical methods and identifying potential sources of error.
- Troubleshooting and Maintenance: Gain a solid understanding of common instrument malfunctions, preventative maintenance procedures, and troubleshooting techniques. Be prepared to discuss practical problem-solving approaches.
- Quality Control and Assurance: Familiarize yourself with quality control procedures in analytical laboratories, including calibration, standardization, and quality assurance protocols. Understanding GMP/GLP principles is crucial.
- Safety Procedures and Regulations: Demonstrate knowledge of safety regulations and procedures specific to handling chemicals and operating analytical instrumentation. This includes understanding proper waste disposal protocols.
- Specific Instrumentation Knowledge: Deepen your understanding of specific instruments relevant to your target role. Research the particular instruments used by the company you are interviewing with.
Next Steps
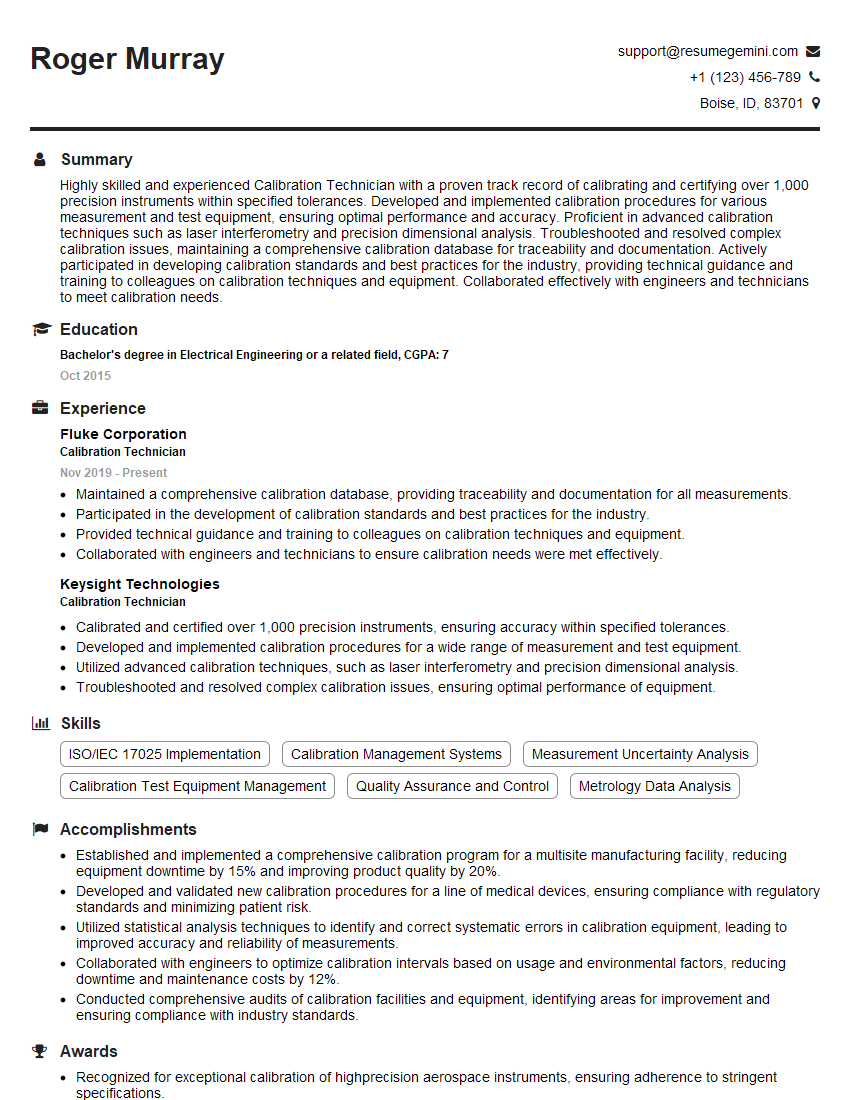
Mastering Analytical Instrumentation Operation opens doors to exciting career opportunities in various industries, offering excellent growth potential and high demand. To maximize your job prospects, it’s crucial to present your skills effectively through a well-crafted, ATS-friendly resume. ResumeGemini is a trusted resource to help you build a professional and impactful resume that showcases your expertise. We offer examples of resumes tailored to Analytical Instrumentation Operation to help you get started. Investing time in crafting a strong resume significantly increases your chances of landing your dream job.
Explore more articles
Users Rating of Our Blogs
Share Your Experience
We value your feedback! Please rate our content and share your thoughts (optional).
What Readers Say About Our Blog
This was kind of a unique content I found around the specialized skills. Very helpful questions and good detailed answers.
Very Helpful blog, thank you Interviewgemini team.
