Interviews are opportunities to demonstrate your expertise, and this guide is here to help you shine. Explore the essential Software Proficiency (e.g., Petrel, Landmark, OpenWorks) interview questions that employers frequently ask, paired with strategies for crafting responses that set you apart from the competition.
Questions Asked in Software Proficiency (e.g., Petrel, Landmark, OpenWorks) Interview
Q 1. Explain your experience with Petrel’s workflow for building a geological model.
Building a geological model in Petrel is a multi-step process that involves integrating various data types to create a 3D representation of the subsurface. It starts with importing and validating seismic data, well logs, and geological interpretations. I’ve extensively used Petrel to perform this workflow, focusing on accuracy and efficient data handling.
- Data Import and Pre-processing: This crucial first step involves importing seismic data (often in SEG-Y format), well logs (LAS format), and other geological data. I’m proficient in using Petrel’s tools to check for data consistency, identify and correct errors, and apply necessary preprocessing steps like well log editing and seismic conditioning.
- Seismic Interpretation: I utilize Petrel’s interpretation tools to map horizons, faults, and other geological features from the seismic data. This involves horizon picking, fault interpretation, and creating structural models. The accuracy of this step is paramount for the overall model quality.
- Well Log Correlation and Facies Analysis: I correlate well logs to understand lithological variations and identify distinct geological facies. Petrel’s cross-plotting and statistical tools are instrumental in this process, helping to define relationships between different log parameters and establish facies classifications. I often use petrophysical analysis to derive porosity, permeability, and water saturation from well logs.
- Property Modeling: Once facies are identified, I use this information to build a 3D property model, assigning petrophysical properties (e.g., porosity, permeability, water saturation) to each facies within the geological framework. I leverage Petrel’s geostatistical tools like sequential Gaussian simulation (SGS) or kriging to interpolate these properties between wells, creating a realistic representation of the reservoir.
- Model Validation and Refinement: The final step involves validating the model by comparing it to available data and making necessary adjustments. This iterative process ensures the model accurately represents the subsurface geology and can be used for subsequent reservoir simulation and other studies. I often use techniques like history matching to improve the accuracy of my models.
For instance, in one project, I used Petrel to construct a model of a carbonate reservoir, integrating seismic data with a sparse well dataset. Careful log correlation and advanced geostatistical techniques were essential to generate a reliable model used for successful reservoir simulation and production forecasting.
Q 2. Describe your proficiency in Landmark’s SeisSpace for seismic interpretation.
My experience with Landmark’s SeisSpace focuses on seismic interpretation and attribute analysis. I’m comfortable with various aspects, including seismic data navigation, horizon tracking, fault interpretation, and attribute extraction for reservoir characterization.
- Seismic Data Loading and Visualization: I’m skilled at loading large 3D seismic volumes into SeisSpace and navigating through the data efficiently. I utilize SeisSpace’s visualization tools for effective interpretation, including slice visualization, volume rendering, and advanced display filters.
- Horizon Tracking and Fault Interpretation: I employ automated and manual picking techniques for horizon tracking and fault interpretation. SeisSpace’s automated tracking tools significantly expedite this process, while manual checks ensure accuracy, especially in complex geological settings. I frequently use interactive tools to refine interpretations.
- Seismic Attribute Analysis: I’m experienced in extracting various seismic attributes (e.g., amplitude, frequency, curvature) and using them to identify reservoir features like channels, fractures, and lithological boundaries. I often integrate these attributes with well log data to improve reservoir characterization.
- Data Integration and Collaboration: SeisSpace excels in integrating with other Landmark modules and external data sources. I’ve used this functionality to integrate seismic interpretations with well data for comprehensive subsurface analysis. Collaborative workflows, such as sharing interpretations within a project team, are streamlined through SeisSpace.
In a recent project involving a clastic reservoir, I used SeisSpace’s advanced attribute analysis to identify subtle stratigraphic features that were not apparent on conventional seismic sections. This enhanced understanding of the reservoir significantly improved our geological model.
Q 3. How familiar are you with OpenWorks’ capabilities for reservoir simulation?
My familiarity with OpenWorks extends to its reservoir simulation capabilities, specifically in building and running reservoir models, analyzing results, and performing history matching. I understand its workflow and the importance of appropriate model parameters.
- Building Reservoir Models: I can import geological models and petrophysical properties from other software (like Petrel) into OpenWorks and define the necessary grid parameters. I understand the trade-offs between grid resolution and computational cost.
- Defining Reservoir Properties: This involves assigning fluid properties (e.g., oil, water, gas), rock properties (porosity, permeability), and relative permeability curves. The accuracy of this step directly impacts simulation results. I’m adept at using experimental data or correlations to derive these properties.
- Running Simulations: I’m experienced in setting up and running various types of simulations, including black-oil, compositional, and thermal simulations. I monitor the simulation progress and analyze the outputs.
- Analyzing Simulation Results: Post-simulation analysis involves interpreting the results to understand reservoir performance, production forecasts, and the impact of different development strategies. I’m proficient in using OpenWorks’ visualization tools to analyze production profiles, pressure distributions, and fluid saturations.
- History Matching: I have experience in calibrating reservoir models to match historical production data. This iterative process involves adjusting model parameters until the simulation results closely match the observed production data. History matching enhances the predictive capability of the model.
For example, I worked on a project where we used OpenWorks to simulate the impact of different well placement strategies on oil recovery. By performing history matching, we refined our reservoir model and improved the accuracy of our production forecasts.
Q 4. What are the key differences between Petrel and Landmark’s interpretation modules?
Petrel and Landmark’s interpretation modules (primarily SeisSpace) both offer comprehensive seismic interpretation capabilities, but they differ in their workflow, user interface, and specific functionalities.
- Workflow: Petrel adopts an integrated workflow, seamlessly linking interpretation with geological modeling and reservoir simulation. SeisSpace, while capable of integration with other Landmark modules, has a more focused approach to seismic interpretation.
- User Interface: Petrel’s interface is generally considered more user-friendly and intuitive, with a streamlined workflow for many tasks. SeisSpace, while powerful, might have a steeper learning curve for users unfamiliar with Landmark’s software suite.
- Specific Functionalities: Both offer similar core functionalities, like horizon tracking and fault interpretation. However, specific features and strengths might differ. For instance, Petrel might excel in geostatistical modeling and reservoir property estimation, while SeisSpace might offer more advanced seismic attribute analysis tools.
- Data Handling: Both handle large datasets effectively, but the specific ways they manage data loading, storage, and retrieval might differ, potentially impacting performance.
In essence, Petrel provides a more integrated and potentially faster workflow for users who need to seamlessly transition from interpretation to modeling, while SeisSpace provides advanced, highly specific tools for complex seismic interpretation tasks and integration within the Landmark suite.
Q 5. How would you troubleshoot a Petrel workflow error related to data import?
Troubleshooting a Petrel data import error requires a systematic approach. The error messages themselves are often helpful but sometimes require deeper investigation.
- Examine the Error Message: Carefully read the error message. It often indicates the specific problem, such as an incorrect file format, missing data, or a format mismatch. This is your first clue.
- Check Data Format and Integrity: Verify that the data file is in the correct format (e.g., SEG-Y for seismic, LAS for well logs). Use external tools to check the file’s integrity and identify potential corruption. This could be a simple header issue or a more complex data problem.
- Review Import Settings: Ensure the import settings in Petrel are correctly configured for the chosen data type. Incorrectly defined coordinate systems, units, or other parameters can cause import failures. Double-check each setting against your data specifications.
- Data Pre-processing: Sometimes, the data needs pre-processing before import. For example, seismic data might need to be converted to a suitable format or processed to remove noise. Well log data might need to be edited or quality-controlled.
- Consult Petrel Documentation and Support: If the problem persists, refer to Petrel’s online help documentation or contact Schlumberger support. This is often the most effective way to resolve complex import issues.
- Test with Smaller Datasets: Try importing a small subset of the data to see if the problem is isolated to a specific part of the dataset. This can help pinpoint the source of the error.
For instance, I once encountered an import error where a well log file had inconsistent units in its header. By identifying and correcting this inconsistency, I resolved the import issue and efficiently integrated the data into the project. It is essential to be methodical and rule out each potential cause.
Q 6. Describe your experience using Landmark’s DecisionSpace for production optimization.
My experience with Landmark’s DecisionSpace centers on using its production optimization capabilities for reservoir management. I’ve worked on projects leveraging DecisionSpace to improve production efficiency and maximize hydrocarbon recovery.
- Production Data Integration: DecisionSpace allows for the integration of various production data sources (well test data, production logs, etc.) to create a comprehensive database. I am adept at importing, validating and organizing this data for effective analysis.
- Reservoir Simulation Integration: DecisionSpace can be tightly integrated with reservoir simulation models. I leverage this feature to compare simulation outputs with actual production data, allowing for validation and adjustments to the simulation model.
- Production Forecasting and Optimization: I utilize DecisionSpace’s analytical capabilities to generate production forecasts, and then evaluate various production strategies (such as changes in well rates, injection strategies) to assess their potential impact on overall production.
- Well Test Analysis: I have experience using DecisionSpace’s tools for conducting well test analysis, evaluating reservoir properties (like permeability and skin factor) to improve reservoir characterization and optimize well performance.
- Reporting and Visualization: DecisionSpace has powerful visualization and reporting capabilities. I utilize these tools to create comprehensive reports and presentations that effectively communicate production optimization findings and recommendations to project stakeholders.
For example, in a project involving an offshore oilfield, I used DecisionSpace to model and assess the impact of different water injection strategies on oil recovery, ultimately recommending a plan that significantly improved oil production and extended the field’s life.
Q 7. Explain your experience with history matching in OpenWorks or a similar reservoir simulator.
History matching in reservoir simulation is an iterative process of adjusting reservoir model parameters to match historical production data. This involves comparing simulated results with actual production data (pressure, flow rates, water cut) and iteratively modifying model parameters until a satisfactory match is achieved. I’ve performed history matching extensively using OpenWorks and other similar simulators.
- Data Preparation: The process begins with collecting and cleaning historical production data (pressure, oil rate, water rate, gas rate). Ensuring data quality is critical for accurate history matching.
- Initial Model Setup: A base reservoir model is built based on geological and petrophysical data. This model is then used as the starting point for history matching.
- Parameter Adjustment: The model parameters, such as permeability, porosity, relative permeability curves, and fluid properties, are systematically adjusted based on the differences between the simulated and historical data. This can be a manual process or involve automated optimization techniques.
- Sensitivity Analysis: Sensitivity analysis is often performed to identify which model parameters have the greatest influence on the match between the simulated and historical data. This helps focus optimization efforts.
- Match Evaluation: The quality of the history match is assessed using various statistical measures, ensuring that the match is realistic and represents a good understanding of the reservoir’s behavior. Visual comparisons of pressure and rate profiles are also crucial.
- Uncertainty Analysis: Once a reasonable history match is achieved, uncertainty analysis should be performed to quantify the uncertainty in model parameters and predictions. This accounts for the inherent uncertainty in input data.
In one project, I utilized a combination of manual adjustment and automated optimization techniques in OpenWorks to history match a complex gas condensate reservoir. This resulted in a well-calibrated model that accurately predicted future production and assisted in optimizing field development plans.
Q 8. What are the advantages and disadvantages of different gridding techniques in Petrel?
Gridding in Petrel, or any reservoir modeling software, is the process of creating a 3D grid representing the subsurface. Different techniques offer trade-offs between accuracy, computational cost, and ease of use.
- Regular Grids: These are the simplest, with uniform cell sizes in x, y, and z directions. Advantages: Simple to create and computationally efficient. Disadvantages: Can be inaccurate in areas with complex geology, leading to wasted computational resources in areas with little variation and insufficient resolution in complex areas.
- Irregular Grids (e.g., unstructured grids): These use cells of varying sizes and shapes, adapting to the geological features. Advantages: More accurate representation of complex geology, efficient use of computational resources. Disadvantages: More complex to create and manage, and the numerical solution of the reservoir simulation might be more complex and computationally expensive.
- Hybrid Grids: Combine regular and irregular grids, leveraging the strengths of both. Advantages: A balance between accuracy and efficiency. Disadvantages: Can be more complex to implement and manage than regular grids.
In practice, the choice of gridding technique depends on the complexity of the reservoir, the available data, and the computational resources. For a simple reservoir with relatively uniform geology, a regular grid might suffice. However, for a complex reservoir with faults, unconformities, and rapid facies changes, an irregular grid is often necessary to ensure accuracy.
Q 9. How do you handle uncertainty and risk in reservoir modeling using Landmark or Petrel?
Uncertainty and risk are inherent in reservoir modeling. We address this using probabilistic methods within Landmark or Petrel. This involves creating multiple realizations of the reservoir model, each reflecting a different set of possible input parameters.
- Stochastic Simulation: Techniques like Sequential Gaussian Simulation (SGS) or object-based modeling create multiple geologically realistic realizations of the reservoir properties (porosity, permeability, etc.), accounting for the uncertainty in the input data.
- Monte Carlo Simulation: This is used to propagate the uncertainty in the input parameters through the reservoir simulation workflow. By running the reservoir simulation multiple times with different input parameters (each drawn from their probability distributions), we obtain a range of possible production forecasts, allowing us to quantify the uncertainty associated with each parameter.
- Sensitivity Analysis: This helps to identify the input parameters that have the greatest impact on the output (e.g., production forecasts). This helps to focus efforts on reducing uncertainty in those key parameters.
For example, when modeling porosity, we might use a distribution that reflects the uncertainty in the well log measurements and core data. The Monte Carlo simulation would then use samples from this distribution in each simulation run. This gives us a probabilistic forecast reflecting the uncertainty in our knowledge.
Q 10. Describe your experience with facies modeling in Petrel or similar software.
Facies modeling is crucial for characterizing reservoir heterogeneity. My experience in Petrel involves using various techniques, from simpler indicator kriging to more complex object-based modeling.
- Indicator Kriging: This method uses well log data and core descriptions to create a probabilistic model of facies distribution. It accounts for spatial correlation among data points and uncertainty in the classification of facies.
- Sequential Indicator Simulation (SIS): A more advanced technique than Indicator Kriging, SIS accounts for the uncertainty associated with facies probabilities by creating multiple equally likely realizations of the facies model.
- Object-Based Modeling: This approach models the reservoir as a collection of interconnected geological objects (e.g., channels, bars) representing depositional features. It requires a detailed understanding of the depositional environment and can be more computationally expensive.
In one project, we used SIS to model a fluvial reservoir. We incorporated well log data, seismic attributes, and geological knowledge to create multiple facies realizations. This provided a range of possible reservoir configurations, which were then used as input for reservoir simulation studies to assess production uncertainty.
Q 11. What is your experience with well log interpretation and its integration into Petrel or Landmark?
Well log interpretation is fundamental to reservoir modeling. My experience involves using Petrel and Landmark to interpret various well logs (gamma ray, resistivity, neutron porosity, density, etc.) and integrating the interpreted data into the reservoir model.
- Log Editing and Quality Control: Identifying and correcting errors in well log data is the first critical step.
- Petrophysical Analysis: Determining petrophysical properties (porosity, permeability, water saturation) from well logs using appropriate equations and correlations.
- Facies Identification: Using log signatures to identify different rock types and geological facies.
- Data Integration: Integrating well log data with other data types such as core data, seismic data, and geological information to create a comprehensive reservoir model.
For instance, in a recent project, I used Petrel to interpret gamma ray logs to identify different lithologies, which were then used as training data for a facies model. We used the processed data to construct a 3D reservoir model, defining crucial properties across the reservoir volume.
Q 12. How familiar are you with the different types of reservoir simulators available (e.g., black-oil, compositional)?
Reservoir simulators are crucial for predicting reservoir behavior. I am familiar with various types, each suited to different reservoir characteristics and complexities.
- Black-Oil Simulators: These are the simplest, assuming that oil, gas, and water are incompressible and have constant properties. Suitable for simpler reservoirs where compositional effects are negligible.
- Compositional Simulators: These account for the changes in the composition of the fluids as pressure and temperature change. Necessary for reservoirs containing volatile components like methane or heavier hydrocarbons, or exhibiting complex phase behavior.
- Thermal Simulators: These account for changes in temperature and the associated effects on fluid properties. Important for reservoirs with steam injection or heavy oil production.
The choice of simulator depends on the specific needs of the project. For example, a black-oil simulator is sufficient for a mature oil reservoir with minimal gas production, while a compositional simulator is necessary for a gas condensate reservoir.
Q 13. Describe your experience with automatic history matching techniques in reservoir simulation.
Automatic history matching is a crucial part of reservoir simulation, aiming to optimize the reservoir model parameters to match historical production data. My experience involves utilizing various techniques to automate this process.
- Gradient-Based Optimization: This approach involves iteratively adjusting the model parameters to minimize the difference between observed and simulated production data. It uses gradients (the change in the objective function with respect to the parameters) to guide the optimization process.
- Ensemble-Based Methods: These methods involve creating an ensemble of possible reservoir models and selecting the models that best match the historical data. Examples include particle swarm optimization and genetic algorithms.
The choice of technique depends on the complexity of the reservoir model and the available computational resources. Gradient-based methods are generally faster but can get trapped in local optima, while ensemble methods are more robust but computationally expensive. In many cases, a combined approach is used, leveraging the advantages of both methods.
Q 14. How do you validate the results of a reservoir simulation study?
Validating reservoir simulation results is critical to ensure their reliability. This involves comparing the simulation results to available data and assessing the uncertainties.
- Comparison with Historical Data: A primary validation step is comparing the simulated production data (oil, gas, and water rates) with the actual historical production data. Close agreement suggests a reliable model.
- Sensitivity Analysis: Assessing the sensitivity of the simulation results to changes in input parameters helps quantify the uncertainty in the predictions.
- Uncertainty Quantification: Using techniques like Monte Carlo simulation to generate a range of possible outcomes, providing a measure of the uncertainty associated with the predictions.
- Qualitative Comparison: Comparing the simulated pressure and saturation distributions with other available data, such as pressure-transient tests or seismic data, can also provide validation.
If discrepancies exist between simulation results and historical data, a review of the model input data, assumptions, and simulation parameters is necessary. This iterative process ensures model refinement and increased confidence in the results.
Q 15. Explain your experience with sensitivity analysis in reservoir modeling.
Sensitivity analysis in reservoir modeling is crucial for understanding how uncertainties in input parameters affect the simulation results. It helps quantify the risk associated with decisions based on the model. I typically perform sensitivity analysis using both local and global methods. Local methods, like varying one parameter at a time while holding others constant, are useful for identifying the most influential parameters. This is often visualized with tornado plots. Global methods, such as Monte Carlo simulations, explore the entire parameter space, providing a more comprehensive understanding of the uncertainties. For example, in a project involving a carbonate reservoir, I used a Monte Carlo simulation to assess the impact of uncertainty in porosity and permeability on oil recovery. The results highlighted that permeability had a significantly larger impact than porosity, guiding subsequent reservoir management decisions.
In practice, I use software like Petrel or Landmark to perform these analyses. These platforms provide built-in tools to automate the process and generate visualizations, making it much more efficient. The key is to carefully select the appropriate sensitivity analysis technique based on the complexity of the model and the available computational resources.
Career Expert Tips:
- Ace those interviews! Prepare effectively by reviewing the Top 50 Most Common Interview Questions on ResumeGemini.
- Navigate your job search with confidence! Explore a wide range of Career Tips on ResumeGemini. Learn about common challenges and recommendations to overcome them.
- Craft the perfect resume! Master the Art of Resume Writing with ResumeGemini’s guide. Showcase your unique qualifications and achievements effectively.
- Don’t miss out on holiday savings! Build your dream resume with ResumeGemini’s ATS optimized templates.
Q 16. Describe your experience with different types of upscaling techniques.
Upscaling techniques are vital for bridging the gap between fine-scale reservoir models, which are computationally expensive, and coarser-scale models, which are suitable for large-scale reservoir simulation. I have experience with various techniques, including:
- Volume Averaging: This simple method calculates effective properties by averaging the fine-scale values over a larger upscaled grid block. It’s computationally inexpensive but can be inaccurate for heterogeneous reservoirs.
- Flow-based Upscaling: This approach preserves flow properties by matching fine-scale and upscaled flow behavior. Methods like the renormalization group method and multi-point flux approximation (MPFA) fall under this category. They are more accurate than volume averaging but computationally more demanding.
- Stochastic Upscaling: This technique incorporates uncertainty in the upscaling process by generating multiple realizations of the upscaled model. Geostatistical methods are often used to generate these realizations. This is particularly valuable when dealing with highly uncertain input data.
The choice of upscaling technique depends on the specific characteristics of the reservoir and the objectives of the study. For example, in a fractured reservoir, flow-based upscaling, specifically MPFA, would be preferred to capture the preferential flow paths. While volume averaging might suffice for a relatively homogenous reservoir where the flow is not significantly impacted by small-scale heterogeneities. Always validating the upscaled model against the fine-scale model is critical to ensure its accuracy.
Q 17. How would you handle missing data in a geological model?
Missing data is a common challenge in reservoir modeling. The approach to handling it depends on the type and extent of the missing data. My strategies include:
- Interpolation: Techniques like kriging (a geostatistical method) or inverse distance weighting can estimate missing values based on the surrounding data. Kriging considers spatial correlation, making it suitable for geological data.
- Data Transforms: Transforming the data (e.g., log-transforming permeability) before interpolation can sometimes improve the results, especially if the data is skewed.
- Stochastic Simulation: For larger gaps in data, geostatistical methods, such as sequential Gaussian simulation (SGS), can generate multiple possible realizations of the reservoir model, capturing uncertainty due to missing data. Each realization will be slightly different depending on how the simulation randomly fills in the missing data.
- Incorporation of Prior Information: Using geological knowledge, prior data from nearby wells, or analogous reservoirs to constrain the interpolation or simulation can be effective.
For example, in a project with sparsely sampled well logs, I used kriging to interpolate porosity and permeability between wells, considering the spatial correlation observed in the available data. The resulting model was then validated against independent data, such as production data.
Q 18. Explain your experience with geostatistical techniques used in reservoir modeling.
Geostatistical techniques are fundamental to reservoir modeling for handling uncertainty and spatial variability. I have extensive experience with several techniques, including:
- Kriging: Used for interpolation and to quantify uncertainty in the interpolated values. Different types of kriging exist, such as ordinary kriging, simple kriging, and universal kriging, each suited to different data characteristics.
- Sequential Gaussian Simulation (SGS): A stochastic method for generating multiple equiprobable realizations of the reservoir model, capturing the uncertainty in the model parameters. This method respects the statistical properties of the data (e.g., mean, variance, and variogram).
- Indicator Kriging: Used to model categorical variables or properties with sharp transitions. This is valuable in modeling facies distributions.
- Variogram Modeling: Analyzing the spatial correlation of data to guide geostatistical methods. The variogram describes the spatial dependence between data points.
For instance, in a fluvial reservoir, I employed SGS to create multiple realizations of the facies distribution, reflecting uncertainty in the subsurface geology. This enabled us to assess the range of possible outcomes for production forecasts, leading to more robust decision-making.
Q 19. What are your preferred methods for visualizing reservoir simulation results?
Visualizing reservoir simulation results is essential for effective communication and decision-making. My preferred methods include:
- Cross-sections and maps: Displaying key reservoir properties (e.g., pressure, saturation, and flow rates) across different spatial dimensions.
- 3D visualizations: Using Petrel or Landmark’s visualization tools to create interactive 3D models showing reservoir dynamics, allowing for detailed exploration of the results.
- Time-lapse animations: Illustrating changes in reservoir properties over time, offering valuable insights into fluid flow and production performance.
- Histograms and statistical summaries: Summarizing key statistics (e.g., mean, standard deviation, and percentiles) of simulation results.
- Production forecasts and performance curves: Graphically representing the predicted production over time.
The choice of visualization method depends on the specific information being conveyed and the audience. For example, a simple cross-section might be sufficient to show pressure distribution for a non-technical audience, while a 3D animation might be necessary for detailed analysis by reservoir engineers.
Q 20. Describe your experience with using OpenWorks or similar software for production forecasting.
I have extensive experience with OpenWorks, Schlumberger’s integrated reservoir simulation platform, for production forecasting. OpenWorks allows for coupling reservoir simulation with other modules, such as production optimization and economic evaluation. I have used it to build complex reservoir models, perform history matching, and generate production forecasts. The process typically involves:
- Building a reservoir model: Importing geological data (e.g., from Petrel or Landmark) and defining reservoir properties.
- Defining the simulation setup: Specifying well configurations, production constraints, and fluid properties.
- Running the simulation: Utilizing OpenWorks’ powerful simulation engine to generate forecasts.
- History matching: Calibrating the model to historical production data.
- Uncertainty analysis: Evaluating the impact of uncertainties in input parameters on the forecast.
For instance, in a gas reservoir project, I used OpenWorks to build a fully coupled reservoir model and incorporate pressure-dependent gas properties. The resulting forecasts were used to optimize production strategies and maximize economic value. The platform’s advanced visualization capabilities also allowed for efficient interpretation of the simulation results.
Q 21. How would you integrate different data sources (e.g., seismic, well logs, core data) in Petrel or Landmark?
Integrating different data sources is crucial for building accurate and comprehensive reservoir models. In Petrel and Landmark, this is achieved through a combination of data import, transformation, and gridding techniques. The process typically involves:
- Data Import: Importing data from various sources, such as seismic surveys (seismic interpretation is often done in Petrel itself), well logs (LAS files), core data, and production data. Each software has specific import functionalities for different data formats.
- Data Transformation: Converting data into a consistent format and coordinate system. This often involves applying corrections for well deviation, depth conversion, and data quality control. For example, I might use Petrel to apply corrections for wellbore deviation and to perform basic data quality checks, ensuring consistent units and removing spurious values.
- Gridding and Modeling: Creating a geological framework (layers, faults, etc.) and assigning reservoir properties (e.g., porosity, permeability) to the grid. This step often involves interpolating or upscaling data to match the simulation grid. Geostatistical tools within the software are heavily leveraged for this.
- Data Validation: Comparing the integrated model with available data to ensure its accuracy and consistency. This is where the true expertise is needed to interpret data discrepancies and ensure the overall quality.
For example, I integrated seismic data to map faults and stratigraphic horizons within Petrel. I then used well logs to define reservoir properties at the well locations and employed geostatistical methods to populate properties in the grid cells between wells. The final model accurately represented the reservoir’s geometry and properties, leading to a more reliable simulation.
Q 22. How familiar are you with using scripting languages (e.g., Python) to automate workflows in Petrel or Landmark?
I’m highly proficient in using Python to automate workflows within both Petrel and Landmark. Think of scripting as giving these powerful software packages a set of instructions to follow automatically, saving me significant time and reducing the risk of human error. For example, I’ve used Python to automate the process of importing and pre-processing large seismic datasets, a task that would otherwise be extremely time-consuming and repetitive. This involved writing scripts to handle data conversions, coordinate transformations, and quality checks. In Petrel, I’ve leveraged the Petrel scripting API to automate complex tasks such as building multiple reservoir models with varying parameters, generating reports, and even creating custom visualizations. Similarly, in Landmark, the OpenWorks environment allows for powerful scripting capabilities. A recent project involved automating the generation of facies probability maps based on well log data using Python and Landmark’s data access and manipulation tools.
One example involves a project where I automated the creation of hundreds of geocellular models with different permeability realizations. Instead of manually running each simulation individually, I wrote a Python script that iterated through the parameter space, generated each model, and ran the simulation, significantly speeding up the process and allowing for a more comprehensive sensitivity analysis.
Q 23. Explain your experience with managing large datasets within Petrel or Landmark.
Managing large datasets within Petrel and Landmark requires a strategic approach. It’s not just about the sheer size of the data, but also its organization and accessibility. I routinely work with terabytes of seismic, well log, and geological data. My experience involves implementing efficient data management strategies, including data compression, partitioning datasets into manageable chunks, and using database systems effectively. In Petrel, the efficient use of the database is key, understanding its indexing mechanisms, and structuring data appropriately. In Landmark, proper use of the OpenWorks data management features, including data repositories, are crucial. I’ve also used techniques like cloud storage (e.g., Azure, AWS) to manage larger-than-memory datasets.
For example, in one project, we were dealing with seismic data covering a vast area. To improve performance, I developed a workflow that involved partitioning the dataset into smaller, overlapping tiles. Processing each tile independently and then mosaicking the results allowed us to manage the computationally intensive processes smoothly and rapidly.
Q 24. Describe your approach to quality control and assurance in reservoir modeling workflows.
Quality control (QC) and quality assurance (QA) are paramount in reservoir modeling. My approach is multifaceted and involves rigorous checks at every stage of the workflow. This includes data validation, model verification, and uncertainty quantification. Data validation means rigorously checking the accuracy and consistency of all input data, including seismic data, well logs, and core data. I use both automated and manual methods for this. Model verification involves comparing the model results with independent data and observations. For instance, I’ll cross-validate my results against well test data or production history matching. Uncertainty quantification means assessing the impact of uncertainties in the input data on the model predictions. This often involves running multiple simulations using a range of input parameters. In summary, it’s a proactive approach rather than a reactive one; anticipating and minimizing potential issues before they become significant problems.
A specific example involves a project where I detected an inconsistency in the seismic data during the QC stage. Using a combination of visual inspection and automated checks, I was able to pinpoint the problematic section. Addressing this early on saved considerable time and resources later in the modeling process.
Q 25. How do you ensure the accuracy and reliability of your work using these software packages?
Ensuring accuracy and reliability involves a combination of rigorous techniques, including using validated data, employing robust modeling methods, and adhering to best practices. It’s about understanding the limitations of the software and the underlying assumptions made in the modeling process. This begins with meticulous data validation, verifying the quality and consistency of all input datasets through rigorous QC processes. Then, using appropriate modeling techniques suited to the available data and geological context is crucial. For example, choosing the right gridding parameters, choosing appropriate upscaling methods, and carefully selecting the algorithms and workflows in both Petrel and Landmark.
Furthermore, I conduct thorough sensitivity analysis to understand how sensitive my results are to variations in the input parameters. Peer review is also an integral part of my workflow, ensuring that my work is scrutinized by other experts in the field. Ultimately, it’s a combination of technical expertise and attention to detail that ensures the accuracy and reliability of my work.
Q 26. What is your experience with collaborative workflows using Petrel or Landmark in a team environment?
Collaborative workflows are essential in our field. My experience in team environments using Petrel and Landmark involves leveraging the collaborative features of these software packages and implementing effective communication strategies. In Petrel, we use features like shared projects and version control to coordinate efforts effectively. Similarly, Landmark’s OpenWorks supports collaborative data management and workflow sharing. Effective communication is crucial, and we typically use project management software (e.g., Jira, Asana) to track progress, assign tasks, and share updates. Regular team meetings, combined with clear documentation of workflows and methodologies, facilitate seamless collaboration and ensure everyone is on the same page.
For instance, during a recent project, we used a combination of Petrel’s shared project functionality and a cloud-based storage solution (e.g., OneDrive) to manage a large-scale reservoir simulation project with several team members across different locations. This ensured we all worked with the most updated data and could track changes easily.
Q 27. Describe a challenging problem you solved using Petrel, Landmark or OpenWorks and how you overcame it.
One challenging project involved integrating complex geological interpretations from multiple data sources (seismic, well logs, core data) into a consistent reservoir model. The challenge stemmed from significant inconsistencies between different datasets, particularly in the interpretation of fault systems. The initial attempt to directly integrate these data resulted in a geologically unrealistic model. To overcome this, I employed a multi-step approach. Firstly, I performed a detailed QC of each dataset individually, identifying and rectifying inconsistencies wherever possible. Then, I employed geostatistical techniques to integrate the data in a way that honored the geological uncertainties. This involved using sequential Gaussian simulation to create multiple equally probable realizations of the reservoir model, capturing the uncertainty associated with the fault interpretation.
This iterative approach of QC, data reconciliation, and multiple realizations resulted in a more robust and geologically plausible reservoir model, ultimately leading to more reliable reservoir simulation results.
Q 28. What are your plans for continuing professional development in the area of reservoir simulation software?
My professional development plan focuses on staying at the forefront of advancements in reservoir simulation software. This includes expanding my expertise in advanced reservoir simulation techniques, such as high-performance computing (HPC) for improved simulation speed and accuracy. I aim to deepen my knowledge of advanced uncertainty quantification methods and their application to reservoir characterization and simulation. I plan to accomplish this through a combination of attending industry conferences and workshops, online courses, and pursuing relevant certifications. I also plan to actively participate in industry forums and collaborate with other professionals to stay abreast of the latest developments and best practices in the field.
Specifically, I am particularly interested in exploring the applications of machine learning and artificial intelligence (AI) in reservoir simulation workflows. These techniques can potentially revolutionize the way we build and analyze reservoir models, enabling faster and more efficient exploration and production decisions.
Key Topics to Learn for Software Proficiency (e.g., Petrel, Landmark, OpenWorks) Interview
Ace your upcoming interview by mastering these key areas. Focus on understanding both the theory and practical application to showcase your expertise.
- Data Management and Interpretation: Learn how to efficiently import, organize, and interpret large datasets within the software. Understand data structures and common file formats.
- Workflow Automation: Demonstrate your ability to automate repetitive tasks using scripting or built-in tools. This showcases efficiency and problem-solving skills.
- Geophysical Interpretation: Practice interpreting seismic data, well logs, and other geological information using the software’s visualization and analysis tools. Be prepared to explain your interpretation process.
- Reservoir Modeling and Simulation: Understand the principles behind reservoir modeling and how to build and run simulations using the chosen software. Focus on interpreting the results and drawing meaningful conclusions.
- Production Forecasting and Optimization: Explore techniques for forecasting future production and optimizing reservoir management strategies. Show how you can use the software to support informed decision-making.
- Troubleshooting and Problem-Solving: Be ready to discuss common challenges encountered while using the software and how you approached resolving them. This highlights your practical experience and analytical skills.
- Software-Specific Features: Familiarize yourself with advanced features and functionalities unique to the specific software (Petrel, Landmark, OpenWorks) you are being interviewed for. Showcase your in-depth knowledge.
Next Steps
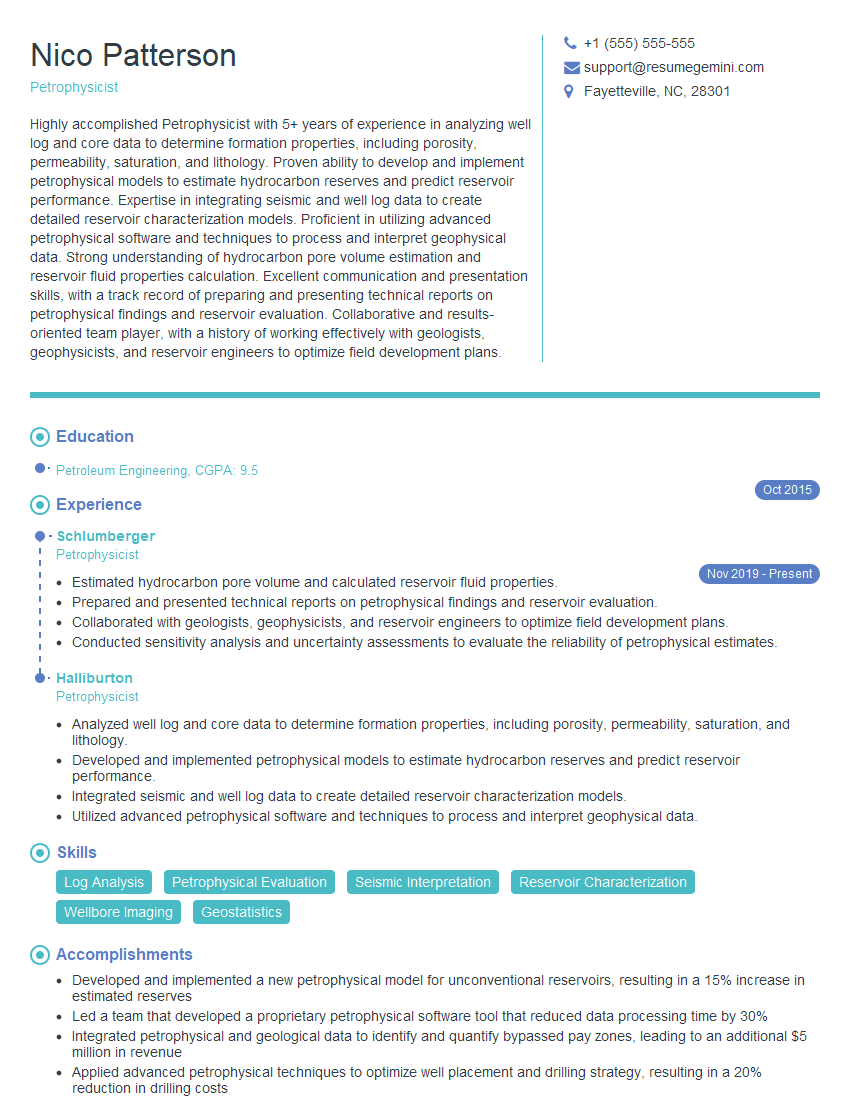
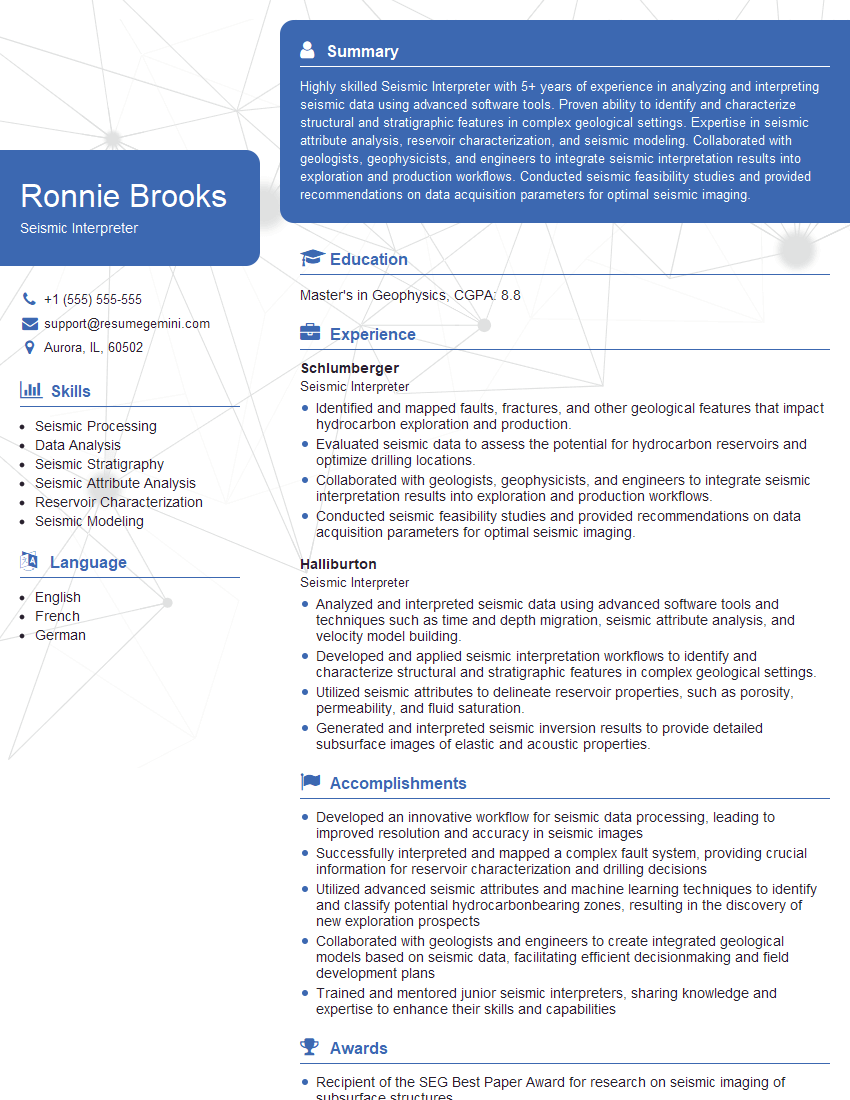
Mastering software proficiency in Petrel, Landmark, or OpenWorks is crucial for career advancement in the energy sector, opening doors to exciting opportunities and higher earning potential. To maximize your job prospects, it’s essential to create a compelling and ATS-friendly resume that highlights your skills effectively. Use ResumeGemini, a trusted resource, to build a professional resume that grabs recruiters’ attention. ResumeGemini offers examples of resumes tailored to showcase Software Proficiency, ensuring you present your qualifications in the best possible light. Take the next step towards your dream career today!
Explore more articles
Users Rating of Our Blogs
Share Your Experience
We value your feedback! Please rate our content and share your thoughts (optional).
What Readers Say About Our Blog
Hi, I have something for you and recorded a quick Loom video to show the kind of value I can bring to you.
Even if we don’t work together, I’m confident you’ll take away something valuable and learn a few new ideas.
Here’s the link: https://bit.ly/loom-video-daniel
Would love your thoughts after watching!
– Daniel
This was kind of a unique content I found around the specialized skills. Very helpful questions and good detailed answers.
Very Helpful blog, thank you Interviewgemini team.
