The right preparation can turn an interview into an opportunity to showcase your expertise. This guide to Research and outcome measurement interview questions is your ultimate resource, providing key insights and tips to help you ace your responses and stand out as a top candidate.
Questions Asked in Research and outcome measurement Interview
Q 1. Explain the difference between qualitative and quantitative research methods.
Qualitative and quantitative research methods represent distinct approaches to understanding the world. Qualitative research focuses on exploring complex social phenomena through in-depth analysis of non-numerical data, such as interviews, observations, and text analysis. It aims to understand the ‘why’ behind events and behaviors, generating rich insights into meaning and context. Think of it like painting a detailed picture of a complex situation. In contrast, quantitative research employs numerical data and statistical analysis to identify patterns, test hypotheses, and make generalizations about a population. It’s like taking a precise measurement of a specific aspect of that picture.
For example, if we want to understand the impact of a new health program, a qualitative study might involve conducting in-depth interviews with participants to explore their experiences and perspectives, uncovering nuanced details and underlying reasons for observed outcomes. A quantitative study might instead measure the program’s effect by comparing changes in health indicators (e.g., blood pressure, weight) between participants and a control group using statistical tests such as t-tests or ANOVA. Often, the best research designs leverage both approaches, combining the strengths of each to offer a more complete understanding.
Q 2. Describe your experience designing research studies to measure specific outcomes.
Throughout my career, I’ve designed numerous research studies focused on measuring specific outcomes across diverse fields. One project involved evaluating the effectiveness of a new literacy program for underprivileged children. The design incorporated a pre-test/post-test control group design. We measured reading comprehension and vocabulary skills using standardized assessments before and after the program’s implementation, comparing results to a control group that did not receive the program. This allowed us to isolate the program’s impact on the children’s literacy skills. Another project involved assessing the impact of a workplace wellness program on employee productivity and well-being. We used quantitative measures such as self-reported surveys on stress levels and absenteeism and also collected objective data, like lost work days, to quantify the impact of the program. For both projects, the process involved careful consideration of the research question, selection of appropriate outcome measures, development of robust data collection protocols, and rigorous data analysis to ensure accurate and reliable findings. The key was aligning the research design with the specific goals and the nature of the outcomes being measured.
Q 3. What statistical methods are you proficient in, and how have you applied them to outcome measurement?
I’m proficient in a range of statistical methods crucial for outcome measurement, including descriptive statistics (mean, median, standard deviation), inferential statistics (t-tests, ANOVA, regression analysis, chi-square tests), and more advanced techniques like multilevel modeling and structural equation modeling. For instance, in evaluating the literacy program, we used independent samples t-tests to compare the pre-post differences in reading scores between the intervention and control groups. To analyze the impact of the workplace wellness program on multiple outcomes (productivity, stress, absenteeism), we employed multiple regression analysis, allowing us to control for confounding variables such as age and job role and examine the independent effects of the program. The choice of statistical method always depends on the research question, the type of data collected, and the underlying assumptions of the statistical test. Ensuring the appropriateness of the statistical techniques is critical for generating valid and reliable results.
Q 4. How do you ensure the validity and reliability of your research findings?
Validity and reliability are paramount in research. Validity refers to the accuracy of the measurement; does the instrument measure what it intends to measure? Reliability refers to the consistency of the measurement; would similar results be obtained if the measurement were repeated? To ensure validity, I use established measurement tools whenever possible, ensuring they are appropriate for the target population and research context. Triangulation, using multiple data sources or methods, strengthens validity by offering converging evidence. For reliability, I use established psychometric methods, such as Cronbach’s alpha for internal consistency, inter-rater reliability (when multiple raters are involved) and test-retest reliability for stability over time. Careful attention to these aspects ensures that our findings are not only consistent but also truly reflective of the phenomenon under study.
Q 5. Explain the concept of causal inference and its importance in outcome measurement.
Causal inference refers to the process of determining whether a change in one variable (the cause) actually produces a change in another variable (the effect). It’s crucial in outcome measurement because it allows us to determine whether an intervention or program truly caused the observed changes, as opposed to other factors. Establishing causality requires meeting several criteria: temporal precedence (cause precedes effect), covariation (cause and effect are related), and the absence of plausible alternative explanations (confounding variables). Randomized controlled trials are the gold standard for establishing causality because they minimize confounding variables by randomly assigning participants to treatment and control groups. However, in observational studies, advanced statistical techniques like propensity score matching or instrumental variable analysis can help to address confounding and strengthen causal inferences. Failing to adequately address causality can lead to flawed conclusions and inappropriate policy or practice decisions based on spurious associations.
Q 6. How do you handle missing data in your research?
Missing data is a common challenge in research, and how it’s handled significantly impacts the results. Ignoring missing data can lead to biased estimates. My approach depends on the nature and extent of missing data. If missing data is missing completely at random (MCAR), simple methods like complete case analysis might be acceptable, though some information is lost. However, if the data is missing not at random (MNAR), more sophisticated techniques are necessary. I often use multiple imputation, a statistical method that creates multiple plausible datasets to account for the missing values, resulting in more robust and accurate estimates. Other strategies include maximum likelihood estimation or inverse probability weighting, the best choice determined by the pattern of missing data and the research context. The key is transparency—clearly documenting the missing data handling strategy and justifying the chosen method.
Q 7. Describe a time you had to defend your research methodology.
In one project, my team used a novel method to measure a complex outcome, a combination of self-reported data and objective physiological measures. A reviewer challenged our methodology, questioning the validity of combining these different data types. To defend our approach, we presented a detailed justification based on existing literature supporting the convergence of these measures, illustrating that combining them provided a richer and more nuanced understanding of the outcome. We also performed sensitivity analyses to demonstrate that the results were robust even if we analyzed the data separately. We meticulously documented our methodological choices, highlighting the rationale behind each step. This involved clear explanations, supporting evidence, and preemptive responses to anticipated criticisms. Ultimately, the reviewers appreciated the thoroughness of our defense and accepted our methodology. This experience reinforced the importance of a strong theoretical foundation, rigorous statistical analysis, and clear communication in justifying methodological choices.
Q 8. What are some common challenges in measuring program outcomes, and how do you overcome them?
Measuring program outcomes presents several challenges. One major hurdle is defining what constitutes a successful outcome. What seems like a clear objective initially can become ambiguous as the program unfolds. For instance, a program aimed at reducing unemployment might struggle to define ‘successful employment’ – is it any job, a job in a specific field, or a job that matches the participant’s skills and aspirations? This ambiguity needs to be addressed before measurement even begins.
Another challenge lies in establishing causality. Did the program actually cause the observed changes, or were there other contributing factors? This is where rigorous research designs, such as randomized controlled trials (RCTs), become crucial. Even with RCTs, confounding variables can still influence the results, requiring careful consideration and statistical adjustments.
Data limitations are also common. Incomplete data, missing values, or inconsistent reporting can significantly hinder the analysis and interpretation of results. Addressing this requires meticulous data collection processes, robust data management systems, and appropriate statistical techniques to handle missing data.
Finally, the practicality and feasibility of data collection methods needs careful consideration. Collecting data on a large scale can be expensive and time-consuming. This necessitates finding a balance between the breadth and depth of the data required and the resources available. To overcome these challenges, I employ a multi-pronged approach: clearly defining outcome measures from the start, utilizing rigorous research designs, implementing robust data management procedures, and employing appropriate statistical methods to mitigate biases and handle missing data. I also carefully assess the feasibility of the data collection process before committing to any particular method.
Q 9. How do you select appropriate outcome indicators for a research study?
Selecting appropriate outcome indicators is a critical step in ensuring the validity and relevance of a research study. The process involves several key considerations. First, the indicators must directly reflect the program’s goals and objectives. For instance, if the goal is to improve literacy rates, an appropriate indicator would be the number of participants who achieve a certain level of reading proficiency.
Second, the indicators should be measurable and quantifiable. Qualitative data, while valuable, often requires additional effort to analyze and quantify. If possible, I aim to choose indicators that allow for both quantitative and qualitative assessment. For example, measuring the number of books read (quantitative) and soliciting feedback on reading enjoyment (qualitative) provides a more comprehensive understanding.
Third, the indicators should be feasible to collect and analyze, given the available resources and time constraints. It’s crucial to balance ambition with practicality, avoiding indicators that are too complex or time-consuming to measure. Lastly, I consider the reliability and validity of the indicators; will they consistently measure what they are intended to measure, and accurately reflect the underlying construct of interest?
For instance, in a study on the effectiveness of a job training program, appropriate indicators could include employment rate, salary levels, and participant satisfaction. Each indicator provides a different perspective on the program’s impact, offering a more holistic understanding than relying on any single measure.
Q 10. Explain your experience with different data collection methods (surveys, interviews, etc.).
I have extensive experience using various data collection methods, each with its own strengths and limitations. Surveys are efficient for gathering quantitative data from a large sample, particularly when standardized questionnaires are used. However, they can be limited in their ability to capture nuanced perspectives or in-depth information.
Interviews, on the other hand, allow for more in-depth exploration of complex issues, enabling richer, qualitative data. However, they are more time-consuming and resource-intensive, making it challenging to use them with large samples. Semi-structured interviews often provide the best balance, allowing for flexibility in the questions while ensuring consistency across interviews.
Focus groups are particularly useful for exploring shared beliefs, attitudes, and perceptions within a specific group. They can generate rich qualitative data, but careful moderation is crucial to manage group dynamics and prevent the dominance of certain individuals. Observational methods, such as direct observation or document review, can provide valuable contextual data, but are highly dependent on the observer’s biases and can be ethically sensitive.
In practice, I often employ mixed-methods approaches, combining different data collection methods to create a more comprehensive understanding of the outcome. For example, in evaluating a health intervention program, I might use surveys to gather quantitative data on health outcomes, interviews to explore individual experiences, and observational data to assess the program’s implementation fidelity.
Q 11. How do you interpret and present your research findings to both technical and non-technical audiences?
Communicating research findings effectively is crucial. For technical audiences, I use precise language, statistical details, and appropriate visualizations, such as graphs and tables, to convey the results clearly. I focus on the nuances of the data, including potential limitations and biases. For non-technical audiences, I simplify the findings, using clear and concise language, avoiding technical jargon, and utilizing visual aids that are easy to understand. I focus on the key takeaways and their implications for practice.
I tailor my presentation to the audience’s knowledge level and interests. For example, in a presentation to policymakers, I might focus on the policy implications of the findings, while in a presentation to community members, I would emphasize the relevance to their lives. In all cases, I ensure transparency and honesty, clearly communicating the limitations of the study and avoiding overgeneralizations. I often use storytelling techniques to make the data more relatable and engaging.
For instance, when presenting findings on a community health program, I might begin with a compelling narrative about a participant’s journey, illustrating the impact of the program. I then present quantitative data, such as improvement rates, to support the narrative, and finally, discuss the broader implications of the findings for community well-being.
Q 12. Describe your experience with different statistical software packages (e.g., SPSS, R, SAS).
I am proficient in several statistical software packages, including SPSS, R, and SAS. Each has its own strengths and weaknesses. SPSS is a user-friendly package with a wide range of statistical procedures, making it suitable for a broad range of analyses. However, it can be expensive. R is a powerful and flexible open-source package, ideal for more complex statistical analyses and data visualization, but it has a steeper learning curve.
SAS is a robust package commonly used in large-scale data analysis and is known for its handling of large datasets, but it also tends to be more expensive and may require more advanced programming skills. My choice of software depends on the specific research question, the size and nature of the data, and the desired level of analysis. For instance, for a large-scale epidemiological study with substantial amounts of data, I would likely opt for SAS; for smaller, more exploratory analyses, R would be a good option; while for standard statistical procedures with user-friendliness being paramount, SPSS would be more appropriate.
I am comfortable with data cleaning, manipulation, statistical modeling (regression analysis, ANOVA, t-tests, etc.), and data visualization. I can write custom scripts to perform specific analyses and tailor visualizations to meet particular research needs. Beyond these packages, I am also familiar with other tools like Stata and Python for data analysis.
Q 13. How do you ensure the ethical conduct of your research?
Ethical conduct is paramount in my research. I adhere strictly to relevant ethical guidelines and regulations, including obtaining informed consent from all participants, ensuring their anonymity and confidentiality, and protecting their rights and well-being. This includes obtaining approval from an Institutional Review Board (IRB) or equivalent ethics committee before commencing any research involving human participants.
Informed consent means participants are fully aware of the study’s purpose, procedures, potential risks and benefits, and their right to withdraw at any time without penalty. I use clear and accessible language to explain the study to participants and ensure they understand their rights before they agree to participate. Confidentiality is maintained through anonymization techniques and secure data storage practices, and I am extremely careful to avoid any potential breaches of confidentiality.
In addition, I ensure the integrity of the research process, avoiding any conflict of interest and accurately reporting the findings, acknowledging any limitations of the study. I am committed to conducting research that is both rigorous and ethically sound, upholding the highest standards of professional conduct.
Q 14. Explain your understanding of different sampling techniques.
Sampling techniques are crucial for selecting a representative subset of the population for a study. The choice of sampling method significantly influences the generalizability of the findings. Probability sampling ensures each member of the population has a known, non-zero chance of being selected, leading to more generalizable results. Simple random sampling, stratified random sampling, and cluster sampling are examples of probability sampling techniques.
Simple random sampling involves randomly selecting participants from the population. Stratified random sampling divides the population into strata (e.g., age groups, gender) and randomly samples from each stratum. Cluster sampling involves selecting clusters (e.g., schools, communities) and then sampling within those clusters. Non-probability sampling methods, such as convenience sampling, purposive sampling, and snowball sampling, do not provide a known probability of selection and are more prone to bias. However, they can be useful in exploratory research or when accessing a specific population is challenging.
Convenience sampling involves selecting readily available participants, while purposive sampling involves selecting participants based on specific characteristics. Snowball sampling relies on existing participants to recruit new participants. The choice of sampling technique is determined by the research question, available resources, and the desired level of generalizability. I always carefully consider the potential biases associated with each sampling method and strive to minimize their impact.
Q 15. How do you determine the appropriate sample size for a research study?
Determining the appropriate sample size is crucial for ensuring the validity and reliability of research findings. A sample that’s too small might not accurately represent the population, leading to inaccurate conclusions, while a sample that’s too large is wasteful of resources. The ideal sample size depends on several factors, primarily the desired level of precision (margin of error), the expected variability in the population (standard deviation), and the desired level of confidence (typically 95%).
We use power analysis to calculate the minimum sample size needed. This statistical method estimates the probability of finding a statistically significant effect if one truly exists (statistical power). There are various online calculators and statistical software packages (like G*Power or R) that can perform power analysis. You need to input your expected effect size, significance level (alpha, usually 0.05), and desired power (usually 0.80 or higher). For instance, if I’m studying the effectiveness of a new teaching method, I’d need to estimate the expected difference in test scores between the experimental and control groups, the variability of test scores in the population, and then use power analysis to determine the necessary sample size for each group to detect this difference with sufficient power.
In addition to power analysis, practical considerations like budget, time constraints, and the accessibility of the target population also influence the final sample size. It’s often a balance between statistical rigor and practical limitations.
Career Expert Tips:
- Ace those interviews! Prepare effectively by reviewing the Top 50 Most Common Interview Questions on ResumeGemini.
- Navigate your job search with confidence! Explore a wide range of Career Tips on ResumeGemini. Learn about common challenges and recommendations to overcome them.
- Craft the perfect resume! Master the Art of Resume Writing with ResumeGemini’s guide. Showcase your unique qualifications and achievements effectively.
- Don’t miss out on holiday savings! Build your dream resume with ResumeGemini’s ATS optimized templates.
Q 16. What is your experience with longitudinal studies?
Longitudinal studies, which track the same individuals over an extended period, are invaluable for understanding changes and trends over time. I have extensive experience designing and conducting longitudinal studies, primarily in the field of educational research. For example, I led a five-year study tracking the academic progress and social-emotional development of a cohort of students from kindergarten through fourth grade. This involved collecting data annually using standardized tests, teacher assessments, and student surveys. The challenges of longitudinal studies include participant attrition (people dropping out), changes in measurement instruments over time, and the need for careful data management and analysis to account for repeated measures.
Analyzing longitudinal data often involves sophisticated statistical techniques such as growth curve modeling, which allows us to model individual trajectories of change over time and identify factors that predict these trajectories. This approach provided crucial insights into the impact of various interventions on student outcomes, revealing patterns that wouldn’t have been visible in a cross-sectional study.
Q 17. Describe your experience with meta-analysis.
Meta-analysis is a powerful technique for synthesizing findings from multiple independent studies investigating the same research question. My experience includes conducting meta-analyses to assess the overall effectiveness of different interventions, such as educational programs or public health campaigns. The process involves identifying relevant studies, extracting key data (e.g., effect sizes), assessing study quality, and then statistically combining the results to arrive at an overall estimate of the treatment effect. This allows for a more precise and robust conclusion than any single study could provide.
A key challenge in meta-analysis is dealing with heterogeneity—the variability in effect sizes across different studies. This can be due to differences in study populations, interventions, or methodologies. We use statistical methods to assess and account for heterogeneity, potentially exploring sources of variability through subgroup analysis or meta-regression. For example, in a meta-analysis of interventions for childhood obesity, I found significant heterogeneity, which led me to explore potential moderators such as the intensity of the intervention and the age of the participants.
Q 18. How do you integrate qualitative and quantitative data in your research?
Integrating qualitative and quantitative data offers a rich and nuanced understanding of a research problem. I often employ mixed-methods designs where qualitative data, such as interviews or focus groups, provide in-depth context and explanations for quantitative findings. For instance, in a study examining student engagement, quantitative data from surveys and test scores might reveal a correlation between participation in extracurricular activities and academic achievement. Qualitative interviews with students and teachers would help to understand the underlying mechanisms and contextual factors driving this relationship.
Several approaches exist for integrating qualitative and quantitative data. One common approach involves using qualitative data to inform the interpretation of quantitative findings or to explore unexpected results. Another approach involves using quantitative data to test hypotheses generated from qualitative findings. Software like NVivo can be very helpful in managing and analyzing qualitative data and linking it with quantitative data sets.
Q 19. How do you account for confounding variables in your research?
Confounding variables are factors that influence both the independent and dependent variables, potentially leading to spurious associations. Addressing confounding variables is critical to ensuring the validity of research conclusions. Several strategies exist to control for confounding: random assignment to treatment and control groups in experimental designs minimizes the influence of known and unknown confounders. Statistical control techniques such as regression analysis are used in observational studies to adjust for the effects of measured confounders. In a study examining the relationship between exercise and heart health, age and diet could be confounders. We can control for these by either recruiting participants of a similar age and dietary habits or statistically adjusting for age and dietary intake in the data analysis.
Stratification, where we analyze the data separately for different subgroups based on the confounding variable, is another approach. Sensitivity analysis can also help determine how much the results might change if the confounding variable was not properly controlled.
Q 20. How do you assess the generalizability of your research findings?
Assessing the generalizability of research findings, or external validity, refers to the extent to which the results can be applied to other populations and settings. Several factors affect generalizability, including the representativeness of the sample, the setting of the study, and the specific characteristics of the intervention. A study conducted with a highly specific sample (e.g., a specific age group or socioeconomic status) might have limited generalizability.
To enhance generalizability, we strive to use diverse and representative samples. Replicating the study in different settings and with different populations can also strengthen generalizability. Clearly defining the boundaries of generalizability in the research report is essential, acknowledging the limitations and potential biases of the study.
Q 21. Describe your experience with program evaluation frameworks (e.g., Logic Model, Theory of Change).
Program evaluation frameworks, such as the Logic Model and Theory of Change, provide structured approaches for planning, implementing, and evaluating programs or interventions. I have extensive experience using these frameworks to assess the effectiveness of various programs in different contexts. The Logic Model illustrates the relationship between program resources, activities, outputs, outcomes, and overall impact. It helps to clarify the program’s intended pathway to achieving its goals and provides a basis for collecting data to track progress. The Theory of Change goes a step further by outlining the underlying assumptions and causal mechanisms linking program activities to long-term outcomes. It helps to identify potential barriers and leverage points for improvement. For example, in evaluating a community-based health program, I’d develop a logic model to map out the planned activities (e.g., workshops, health screenings), the expected outputs (e.g., number of participants, number of screenings conducted), and the desired outcomes (e.g., improved health knowledge, reduced risk factors).
These frameworks guide data collection and analysis, allowing for a comprehensive and evidence-based evaluation of program effectiveness. They also facilitate communication with stakeholders and promote accountability.
Q 22. How do you measure the cost-effectiveness of a program or intervention?
Measuring the cost-effectiveness of a program or intervention involves comparing its costs to the value of its outcomes. This isn’t simply about subtracting costs from benefits; it requires a nuanced approach that considers various factors. We typically use a cost-effectiveness analysis (CEA) or a cost-utility analysis (CUA).
CEA compares different interventions based on their cost per unit of effect. For example, we might compare the cost per life saved for two different cancer screening programs. The program with a lower cost per life saved would be deemed more cost-effective. The key here is defining a clear and measurable outcome (e.g., lives saved, years of life gained, cases prevented).
CUA is a more sophisticated type of analysis that measures outcomes in terms of quality-adjusted life years (QALYs). A QALY represents one year of life lived in perfect health. This allows for comparing interventions with different types of outcomes, such as improvements in both length and quality of life. For instance, comparing the cost per QALY gained for a new drug versus physiotherapy for managing chronic pain. The program that produces more QALYs per dollar spent is generally considered more cost-effective.
Both CEA and CUA involve several steps:
- Identifying costs: This includes direct costs (e.g., personnel, materials) and indirect costs (e.g., lost productivity).
- Measuring outcomes: This necessitates choosing appropriate metrics and collecting reliable data.
- Analyzing the data: This involves calculating cost-effectiveness ratios (e.g., cost per QALY) and performing statistical analysis to determine the uncertainty associated with the results.
- Interpreting the findings: This requires understanding the limitations of the analysis and drawing conclusions about the relative cost-effectiveness of the interventions.
Ultimately, the goal is to inform decision-making by providing evidence-based insights into the allocation of scarce resources. A cost-effective intervention achieves significant results at a lower cost, maximizing the impact of available funding.
Q 23. Explain your experience with using different data visualization techniques.
Data visualization is critical for communicating research findings clearly and effectively. My experience encompasses a wide range of techniques, each chosen strategically depending on the data type and the intended audience.
- Bar charts and histograms: Excellent for comparing categorical data or showing the distribution of a continuous variable. For instance, I’ve used bar charts to compare the prevalence of a disease across different age groups.
- Line graphs: Ideal for illustrating trends over time. I used line graphs in a study to demonstrate the change in patient satisfaction scores over the course of an intervention.
- Scatter plots: Effective for exploring relationships between two continuous variables. In one project, a scatter plot helped us visualize the correlation between exercise levels and blood pressure.
- Box plots: Useful for displaying the distribution of data, including outliers and quartiles. I used box plots to compare the distribution of test scores across different treatment groups.
- Heatmaps: Show the relationship between two categorical variables, using color intensity to represent the magnitude of the relationship. I used a heatmap to represent the correlation between different types of medical conditions.
- Interactive dashboards: Allow for exploration of complex datasets through filtering and dynamic visualization. This was incredibly useful for disseminating the findings of a large-scale epidemiological study to different stakeholders simultaneously.
Choosing the right visualization is paramount. A poorly chosen chart can obscure important information or mislead the audience. I always prioritize clarity and accuracy in my visualizations, using appropriate scales and labels to avoid misinterpretations.
Q 24. How do you communicate the limitations of your research?
Transparency regarding limitations is crucial for maintaining the integrity of research. I address limitations in several ways, aiming for both thoroughness and clarity.
First, I explicitly state the study’s limitations in the discussion section of any report or publication. This includes acknowledging factors such as sample size, study design limitations (e.g., observational study, lack of randomization), potential biases (e.g., selection bias, recall bias), and the generalizability of the findings to other populations or contexts. For instance, if our study sample was predominantly female, I would clearly state that the findings might not be generalizable to males.
Secondly, I use visual aids like tables and figures to illustrate the uncertainties associated with my findings. This might include confidence intervals around effect estimates or p-values indicating statistical significance. I also frequently use sensitivity analysis to determine how sensitive the results are to changes in assumptions or data inputs. These processes improve robustness of the study.
Finally, I communicate the limitations in a way that’s accessible to the intended audience. Whether it’s a technical report for fellow researchers or a presentation for policymakers, I tailor the language and level of detail to ensure understanding. I often use analogies to explain complex statistical concepts. For example, I might explain the concept of a confidence interval using a target analogy – the further the shots are from the bullseye, the less accurate is the aim. By presenting limitations clearly and honestly, I enhance the credibility of the research and encourage responsible interpretation of the results.
Q 25. What are some emerging trends in research and outcome measurement?
The field of research and outcome measurement is constantly evolving, driven by technological advancements and a growing demand for evidence-based decision-making.
- Big data and AI: The increasing availability of large datasets presents opportunities for more sophisticated analyses. Machine learning algorithms can be used to identify patterns and predict outcomes, though careful consideration of bias and interpretability is crucial.
- Real-world evidence (RWE): There’s a growing emphasis on using data from real-world settings (e.g., electronic health records) to evaluate the effectiveness of interventions in diverse populations.
- Patient-reported outcomes (PROs): The incorporation of patient perspectives is becoming increasingly important. This means using questionnaires and other tools to capture patients’ experiences and quality of life, alongside traditional clinical measures.
- Mixed-methods approaches: Combining quantitative and qualitative data allows for a richer understanding of complex phenomena. I’ve seen successful projects using qualitative interviews to supplement quantitative data, providing greater insight into why certain outcomes were observed.
- Focus on equity and health disparities: There’s a growing recognition of the importance of addressing health disparities and ensuring equitable access to healthcare services. This involves using outcome measures that are sensitive to these issues.
Staying at the forefront of these trends requires continuous learning and engagement with the research community. Keeping up with the advancements is crucial for producing rigorous and impactful research.
Q 26. Describe a time you had to adapt your research methodology due to unforeseen circumstances.
During a study evaluating a new diabetes management program, we encountered an unforeseen challenge: a significant number of participants dropped out of the intervention group due to unforeseen personal circumstances (illness, job loss, family emergencies).
Initially, our plan was a randomized controlled trial with a pre-defined sample size. The high dropout rate threatened the validity of our findings. To address this, we didn’t simply ignore the dropouts; that would be unethical and statistically unsound. We adapted our methodology in several ways:
- Imputation techniques: We used statistical methods to estimate missing data, carefully considering the potential bias introduced by this approach.
- Modified analysis plan: We adjusted our statistical analysis to account for the imbalance in participant numbers between groups. This involved using appropriate statistical tests that handle missing data and potentially unequal sample sizes.
- Qualitative data collection: To understand the reasons for participant dropout, we conducted follow-up interviews. This rich qualitative data complemented our quantitative findings, providing valuable insights into the barriers to program participation.
- Transparency: We clearly documented the challenges we faced and the steps we took to mitigate the impact of the high dropout rate in our final report. This transparency increased the credibility of our findings.
This experience highlighted the importance of flexibility and adaptability in research. While it’s impossible to foresee every challenge, having a plan for addressing unforeseen circumstances is essential.
Q 27. How do you prioritize different research objectives when resources are limited?
Prioritizing research objectives with limited resources requires a strategic approach. I usually employ a framework that considers several factors:
- Relevance and feasibility: Which objectives are most relevant to the overall research goals, and which are feasible to accomplish given the available resources (time, budget, personnel)?
- Impact and potential benefit: Which objectives have the greatest potential to contribute meaningful insights and generate impactful results? This involves assessing the potential societal, clinical, or economic impact.
- Ethical considerations: Are all objectives aligned with ethical research principles and participant well-being? Any ethical compromises should be flagged immediately.
- Data availability: Do we have, or can we reasonably access, the data necessary to address each objective? I assess if obtaining necessary data would be within the constraints of resources.
- Urgency: Are some objectives time-sensitive or more critical than others? In case of emergencies, these might need prioritisation.
Often, I use a decision matrix to weigh these factors, assigning scores to each objective based on its performance across the various criteria. This provides a systematic approach to prioritization and ensures that resources are allocated efficiently to maximize the overall impact of the research.
Sometimes, it’s necessary to postpone or eliminate certain objectives completely if resources are truly extremely limited. This is a difficult decision, but prioritizing realistically is vital for maintaining project feasibility and producing high-quality results.
Q 28. How do you stay up-to-date with the latest advancements in your field?
Staying current in a rapidly evolving field like research and outcome measurement requires a multi-faceted approach.
- Peer-reviewed publications: I regularly read journals such as JAMA, The Lancet, The BMJ, and other specialized journals relevant to my research area. I focus on high-impact journals and reputable publishers.
- Conferences and workshops: Attending conferences and workshops provides opportunities to learn about the latest research findings and network with other researchers. I try to participate in at least one major conference a year.
- Online resources: I regularly consult online databases like PubMed, Google Scholar, and other relevant databases to keep track of new publications and research developments. Many professional organizations also offer online resources, webinars, and training programs.
- Professional networks: I maintain professional networks through membership in relevant professional organizations and online communities. These provide opportunities to learn from colleagues and discuss new ideas.
- Mentorship and collaborations: Engaging with mentors and collaborators exposes me to different perspectives and approaches, stimulating my own thinking and keeping my research fresh and relevant.
Continuous learning isn’t just about passive consumption of information; it’s about actively engaging with new ideas, challenging existing assumptions, and adapting my own approaches in response to emerging trends. This ongoing effort ensures my research remains at the cutting edge and is impactful.
Key Topics to Learn for Research and Outcome Measurement Interviews
- Research Design & Methodology: Understand various research designs (e.g., experimental, quasi-experimental, observational), sampling techniques, data collection methods (qualitative and quantitative), and their appropriate application in different contexts. Consider the strengths and limitations of each approach.
- Data Analysis & Interpretation: Master statistical software (e.g., SPSS, R, SAS) to analyze data effectively. Focus on descriptive statistics, inferential statistics, and the interpretation of results in relation to the research question. Practice communicating findings clearly and concisely.
- Outcome Measurement Frameworks: Familiarize yourself with established frameworks for measuring outcomes (e.g., logic models, theory of change). Understand how to define and operationalize key outcomes, select appropriate indicators, and develop robust measurement strategies.
- Program Evaluation & Impact Assessment: Learn how to design and conduct program evaluations to assess the effectiveness of interventions. Understand different evaluation approaches (e.g., process evaluation, impact evaluation) and how to address challenges in attribution and causality.
- Reporting & Communication of Findings: Practice presenting research findings clearly and persuasively to diverse audiences, both verbally and in writing. Develop skills in creating effective reports, presentations, and visualizations of data.
- Ethical Considerations in Research: Understand and apply ethical principles in all aspects of research, including informed consent, data privacy, and responsible data handling.
- Critical Appraisal of Research: Develop skills in critically evaluating research studies, identifying biases, and assessing the validity and reliability of findings. This includes understanding study limitations and potential confounding factors.
Next Steps
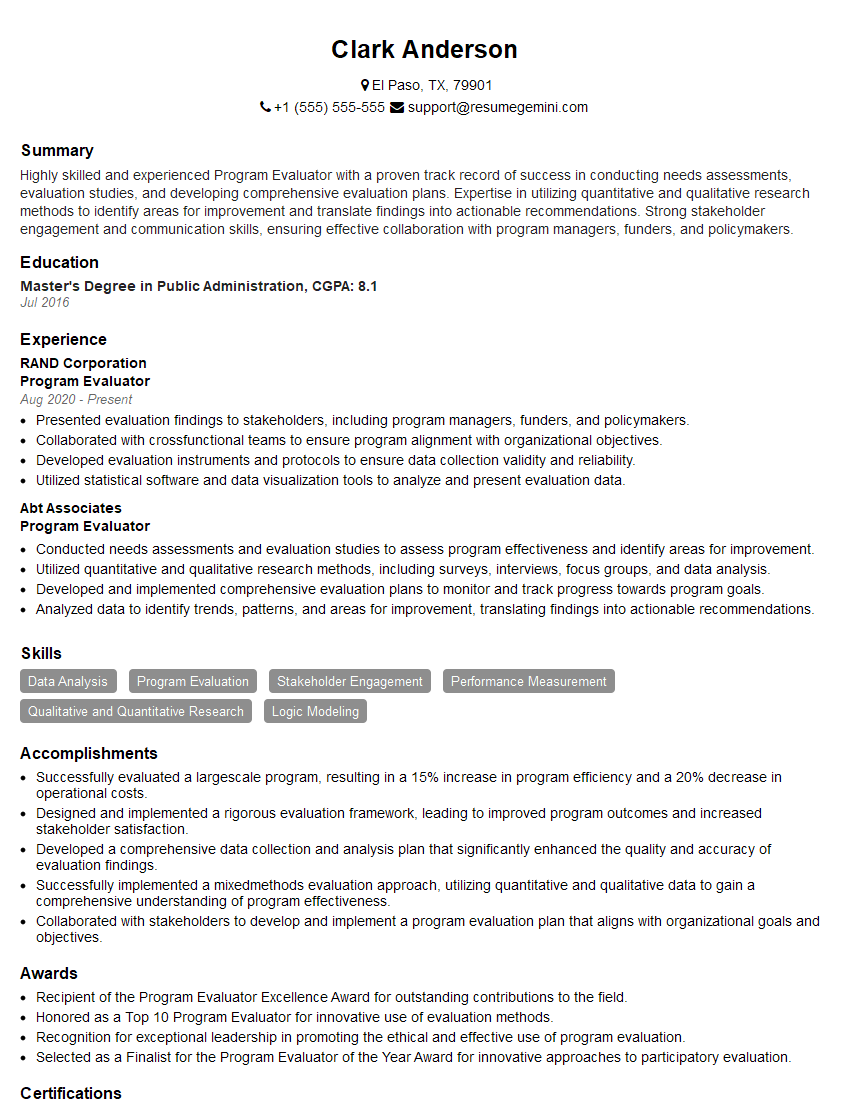
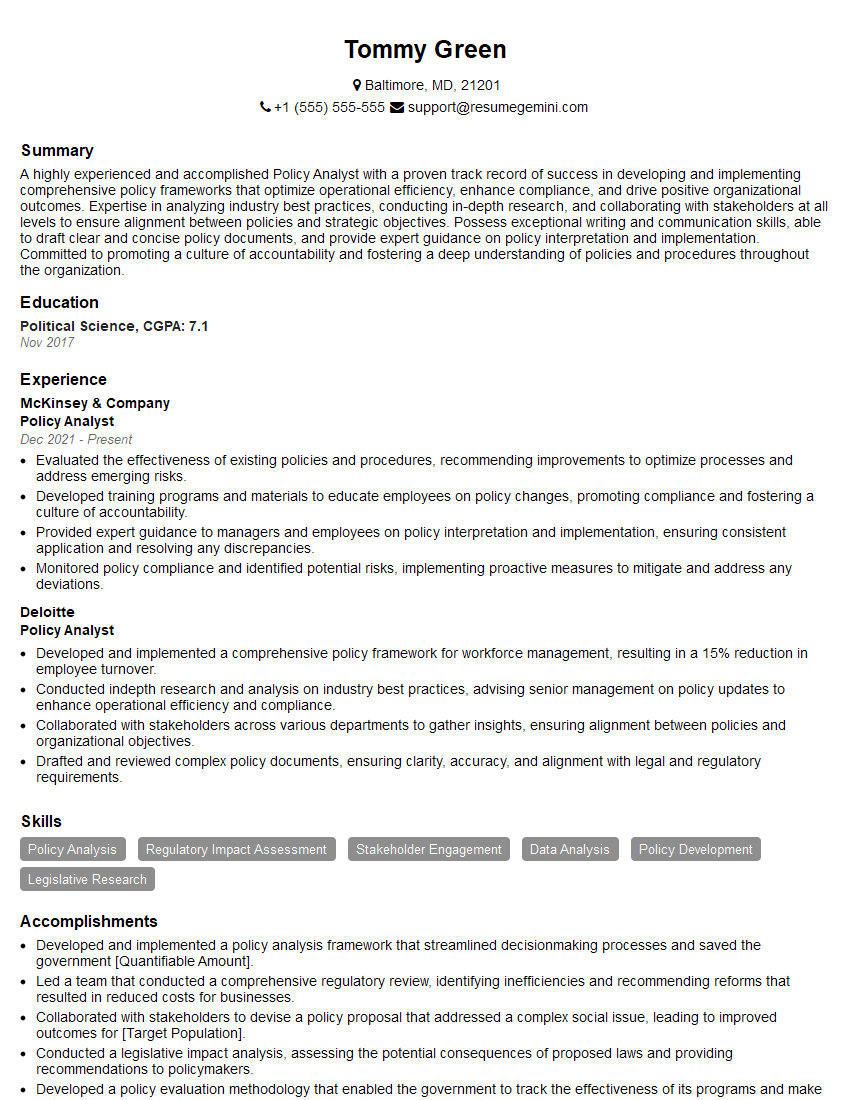
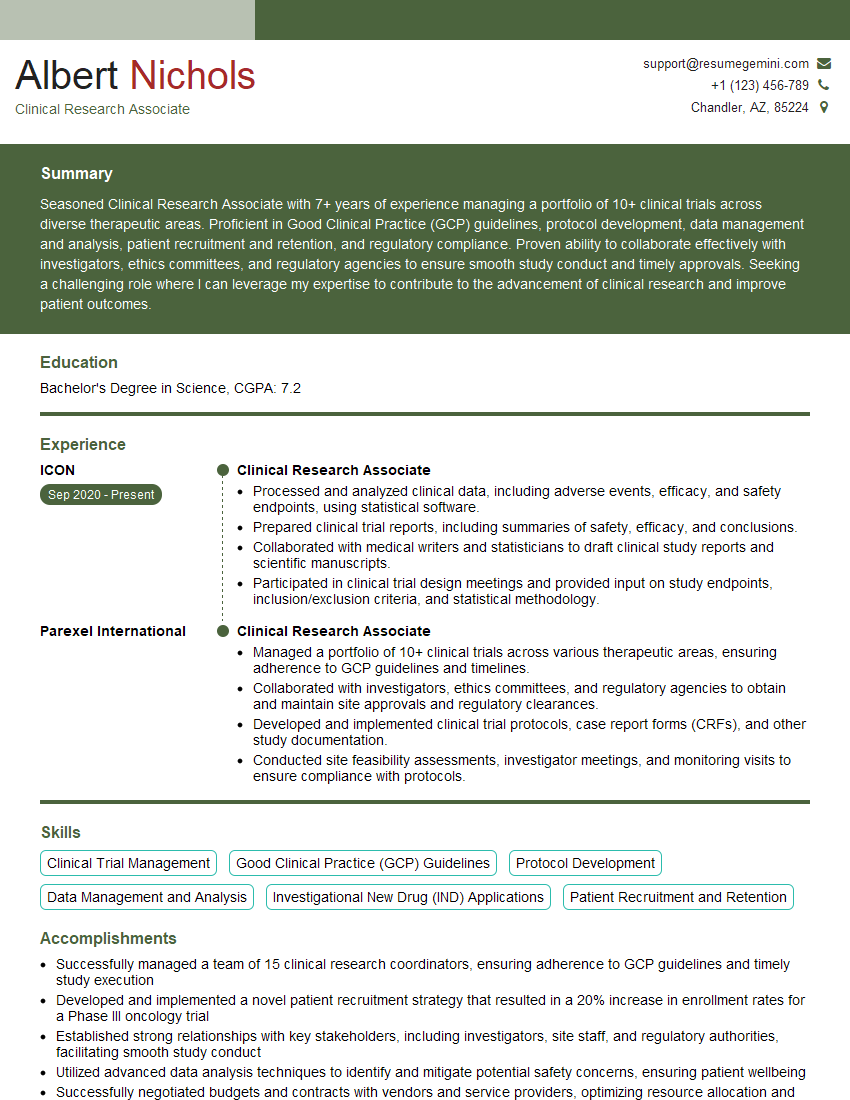
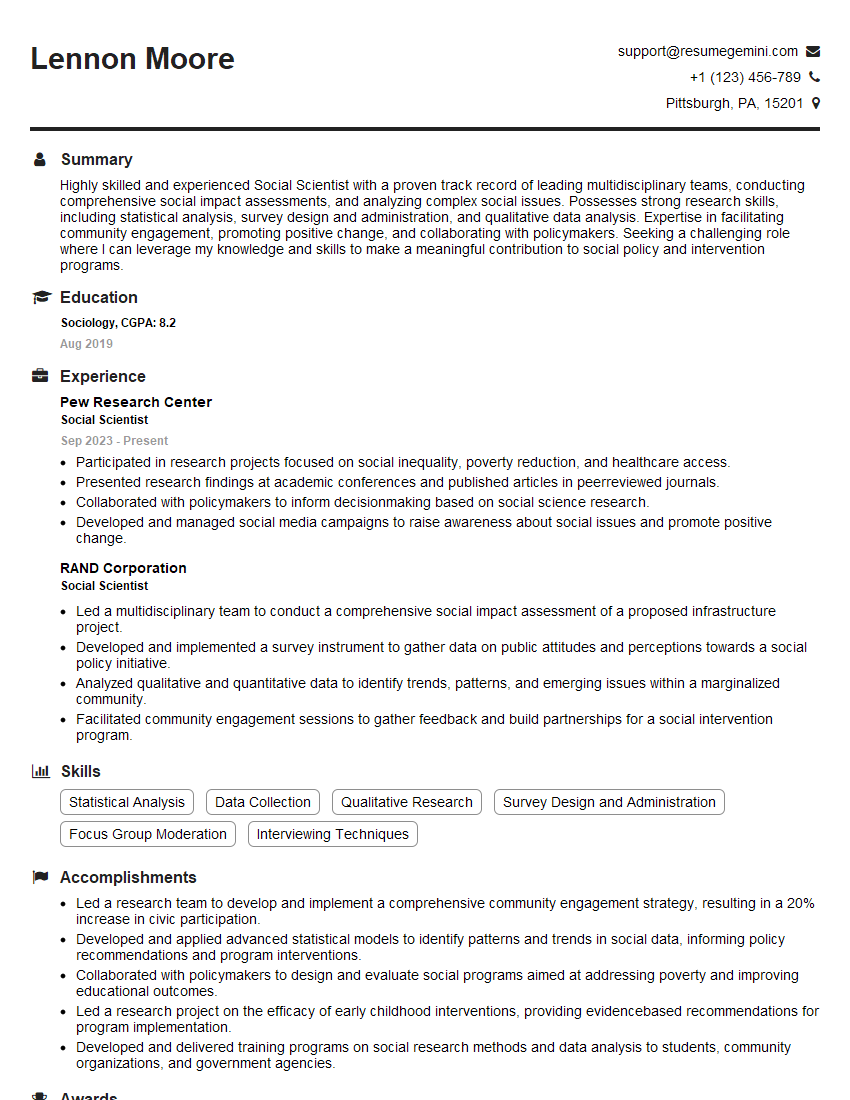
Mastering research and outcome measurement is crucial for career advancement in many fields, opening doors to leadership roles and impactful contributions. A strong resume is your key to unlocking these opportunities. Building an ATS-friendly resume that highlights your skills and experience is essential for getting your application noticed. ResumeGemini can help you craft a professional and effective resume tailored to your specific experience. Take advantage of our resources, including examples of resumes specifically designed for professionals in research and outcome measurement, to showcase your expertise and land your dream job.
Explore more articles
Users Rating of Our Blogs
Share Your Experience
We value your feedback! Please rate our content and share your thoughts (optional).
What Readers Say About Our Blog
This was kind of a unique content I found around the specialized skills. Very helpful questions and good detailed answers.
Very Helpful blog, thank you Interviewgemini team.
