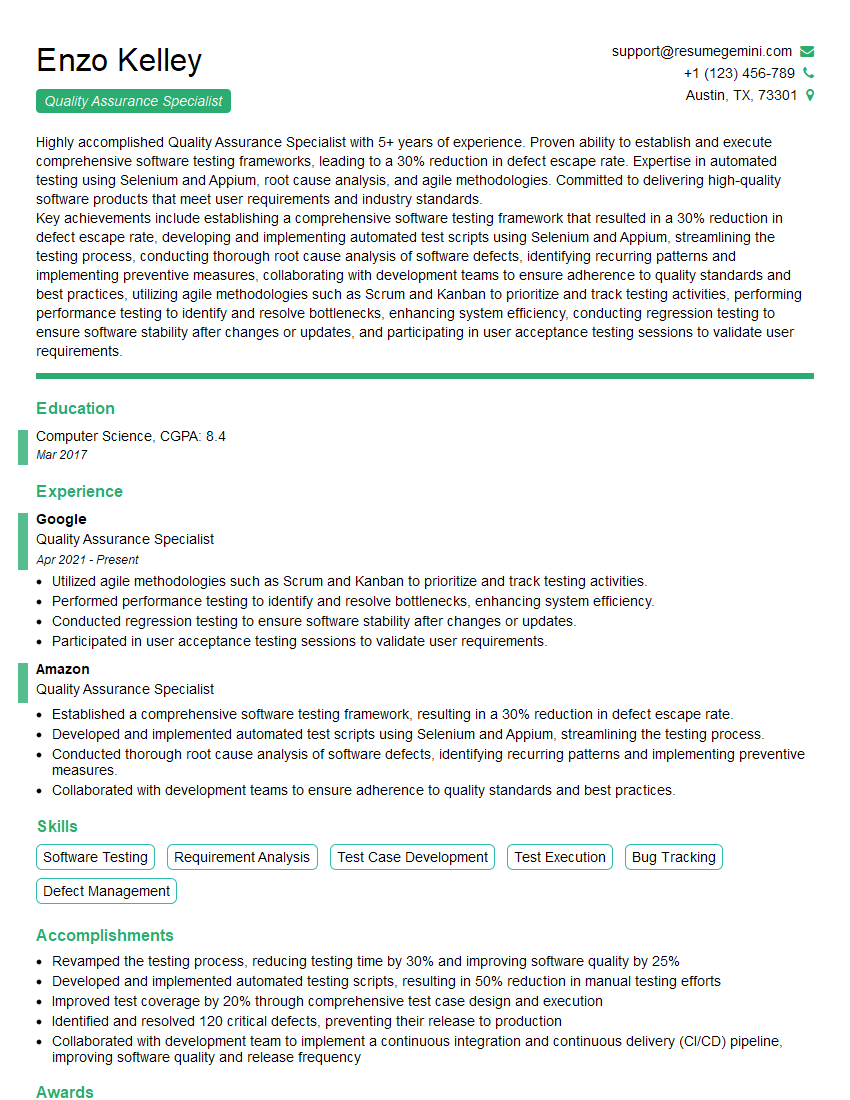
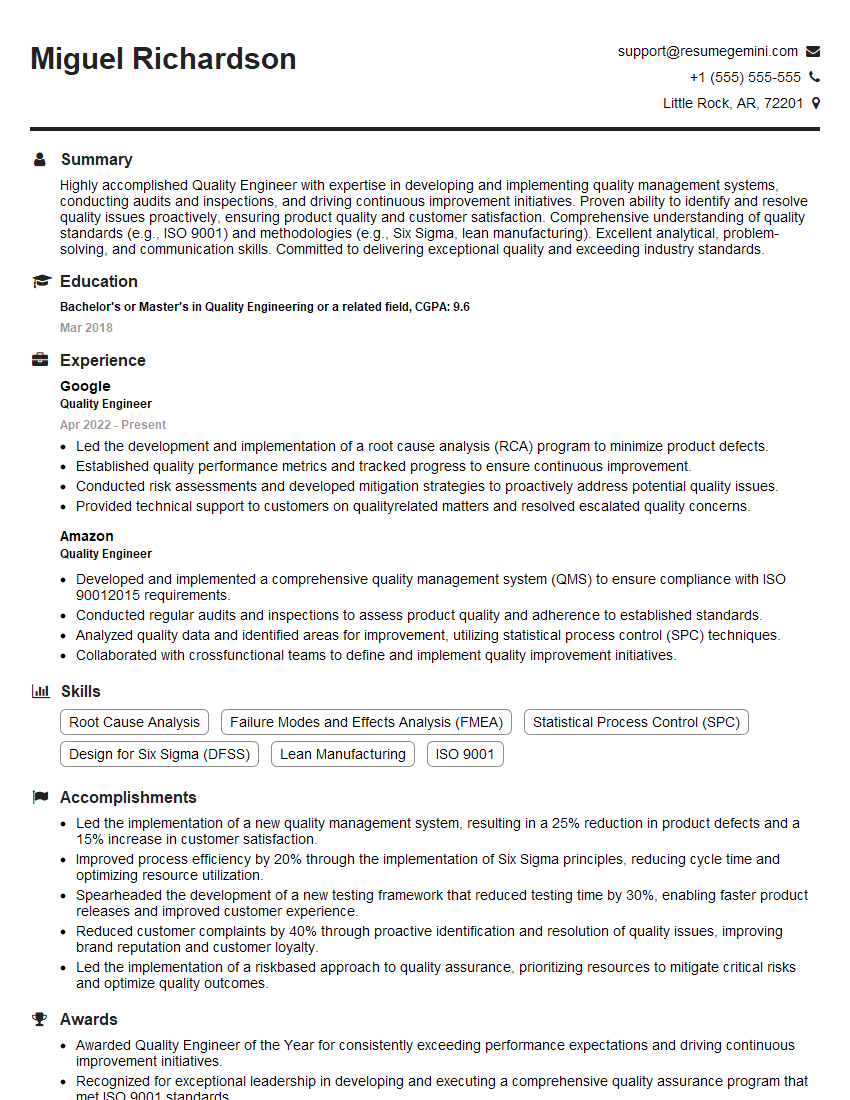
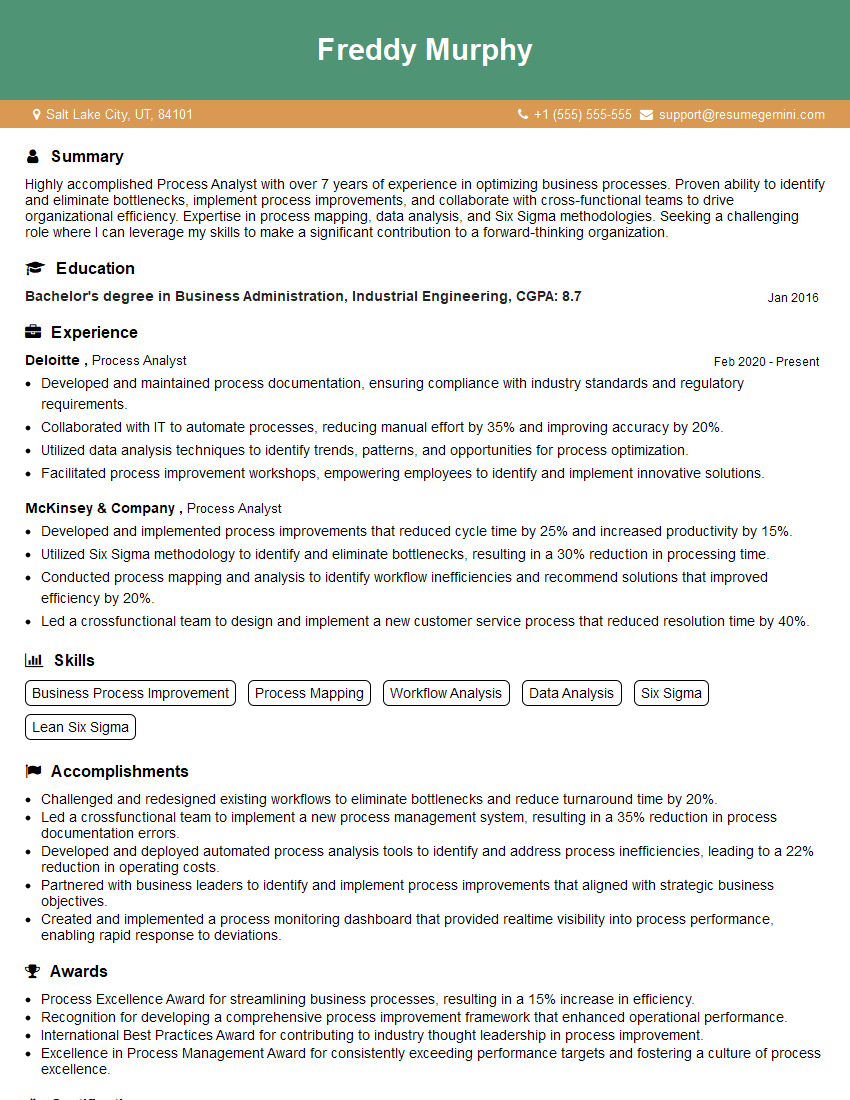
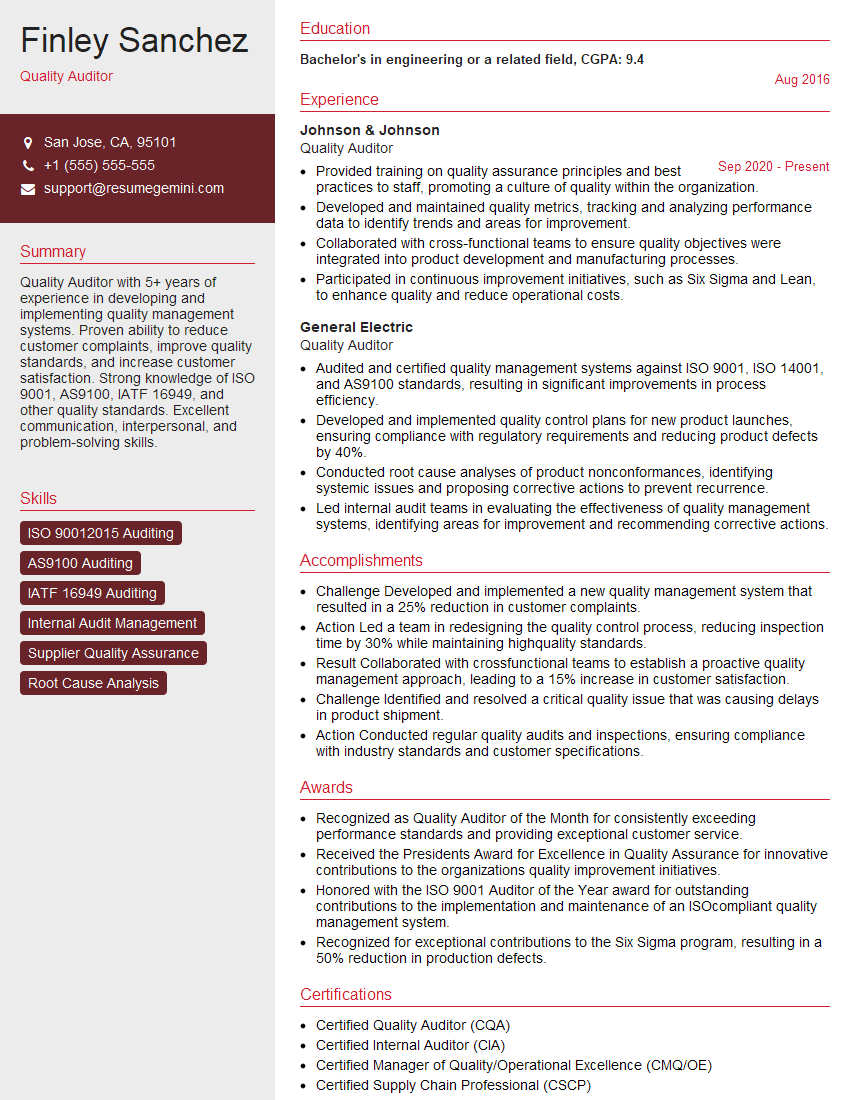
Interviews are opportunities to demonstrate your expertise, and this guide is here to help you shine. Explore the essential Six Sigma and Quality Management interview questions that employers frequently ask, paired with strategies for crafting responses that set you apart from the competition.
Questions Asked in Six Sigma and Quality Management Interview
Q 1. Define Six Sigma and its core principles.
Six Sigma is a data-driven methodology aimed at improving processes by reducing variation and defects. Think of it like a highly precise rifle shot – instead of scattering bullets, Six Sigma strives for pinpoint accuracy. Its core principles revolve around:
- Customer Focus: Understanding and meeting customer needs is paramount. Every improvement initiative begins and ends with the customer.
- Data-Driven Decision Making: Reliance on facts and statistical analysis, rather than assumptions, guides all improvement efforts.
- Process Improvement: Focusing on identifying and eliminating the root causes of variation and defects in processes.
- Continuous Improvement (Kaizen): Embracing a culture of ongoing improvement and learning.
- People Involvement: Empowering employees at all levels to participate actively in the improvement process.
For example, a manufacturing company might use Six Sigma to reduce the number of defective parts produced, while a hospital might use it to decrease patient wait times.
Q 2. Explain the DMAIC methodology.
DMAIC is a structured five-phase problem-solving methodology used extensively in Six Sigma projects. It provides a roadmap for systematically improving processes.
- Define: Clearly defining the problem, project goals, and customer requirements. This involves gathering data and understanding the current state of the process. Imagine defining the target—where you want to end up.
- Measure: Collecting data to understand the current performance of the process. This step involves identifying key metrics and gathering baseline data. This is mapping the current reality.
- Analyze: Identifying the root causes of variation and defects in the process. This often involves using statistical tools to analyze data and pinpoint the key drivers of the problem. This is identifying why the current reality exists.
- Improve: Developing and implementing solutions to address the root causes identified in the analysis phase. This includes testing and validating the effectiveness of proposed solutions. This is suggesting solutions and testing them.
- Control: Implementing processes to sustain the improvements and prevent regression. This often involves developing monitoring systems and implementing controls to maintain the desired level of performance. This is sustaining the improvement.
For instance, a call center might use DMAIC to reduce customer wait times. They would define the target wait time, measure the current wait times, analyze the root causes (e.g., insufficient staffing, slow systems), improve staffing levels and streamline processes, and then control the system to maintain the improved wait times.
Q 3. Describe the different Six Sigma belts and their roles.
Six Sigma belts represent different levels of training and expertise within the Six Sigma framework. They are analogous to different levels of martial arts belts.
- White Belt: Individuals with basic awareness of Six Sigma principles. They are typically involved in supporting Six Sigma projects.
- Yellow Belt: Participants with a foundational understanding of Six Sigma and DMAIC, often involved in specific project tasks.
- Green Belt: Professionals trained to lead and manage small to medium-sized Six Sigma projects under the guidance of a Black Belt. This is a pivotal step in becoming a Six Sigma expert.
- Black Belt: Highly trained individuals capable of leading complex Six Sigma projects independently. They often mentor Green Belts and serve as internal consultants for improvement initiatives.
- Master Black Belt: Senior Six Sigma experts responsible for strategic direction, training, and mentoring Black and Green Belts. They are the highest level of Six Sigma expertise.
Think of it like a team: White and Yellow Belts provide support, Green Belts execute projects, and Black Belts lead them, while Master Black Belts ensure the organization maintains its expertise and implements its best practices.
Q 4. What are the key tools used in Six Sigma projects?
Six Sigma leverages a wide array of statistical and process improvement tools. The specific tools used depend on the project phase and the nature of the problem. Some of the most common tools include:
- Check Sheets: Simple data collection forms.
- Flowcharts: Visual representations of process steps.
- Pareto Charts: Identifying the most significant factors contributing to a problem (the “vital few”).
- Histograms: Showing the distribution of data.
- Control Charts: Monitoring process stability over time.
- Cause-and-Effect Diagrams (Fishbone Diagrams): Identifying potential root causes of a problem.
- Scatter Diagrams: Examining the relationship between two variables.
- FMEA (Failure Mode and Effects Analysis): Identifying potential failures and their impact.
- Design of Experiments (DOE): Optimizing processes by systematically changing inputs.
For example, a Pareto chart might reveal that 80% of customer complaints stem from just 20% of the causes, allowing you to focus your improvement efforts effectively.
Q 5. How do you identify and prioritize projects for Six Sigma improvement?
Project selection is crucial for Six Sigma success. Projects should be strategically aligned with business goals and offer significant potential for improvement. Several criteria can be used for selection and prioritization:
- Financial Impact: Projects with the potential for significant cost savings or revenue increases should be prioritized.
- Strategic Alignment: Projects that support key business objectives should be favored.
- Feasibility: Projects that are realistically achievable within the available resources and timeframe.
- Impact on Customers: Projects that will significantly improve customer satisfaction or reduce customer complaints.
- Data Availability: Projects with sufficient data to support effective analysis and measurement.
A popular prioritization matrix uses a combination of impact and feasibility to quickly rank potential projects. High impact, high feasibility projects get top priority. Projects with low impact or low feasibility are typically rejected.
Q 6. Explain the concept of process capability and its indices (Cp, Cpk).
Process capability refers to the ability of a process to consistently produce output within specified customer requirements or specifications (also known as tolerances). Indices like Cp and Cpk quantify this capability.
- Cp (Process Capability Index): Measures the potential capability of a process, assuming the process is centered on the target value. It compares the spread of the process data to the tolerance width. A Cp of 1 indicates the process is capable of meeting the specifications. Higher Cp values indicate better capability.
- Cpk (Process Capability Index): Measures the actual capability of a process, considering both the spread of the data and the process mean relative to the target value. It accounts for the fact that the process may not be perfectly centered. A Cpk of 1 indicates the process is capable of meeting the specifications, but only if it is centered. Higher Cpk values are better.
Cp = (USL - LSL) / (6σ)
Cpk = MIN[(USL - μ) / (3σ), (μ - LSL) / (3σ)]
(Where USL = Upper Specification Limit, LSL = Lower Specification Limit, μ = Process Mean, σ = Process Standard Deviation)
For instance, a manufacturing process with a Cpk of 1.5 is more capable than one with a Cpk of 1.0, meaning fewer defects are likely.
Q 7. How do you measure and analyze process variation?
Analyzing process variation is key to Six Sigma improvement. Tools and techniques include:
- Control Charts: Visual tools used to monitor process stability and identify out-of-control points or special causes of variation. Examples include X-bar and R charts, p-charts, and c-charts.
- Statistical Process Control (SPC): A collection of methods for monitoring and controlling processes using statistical techniques.
- Histograms: Display the frequency distribution of data and help identify the shape of the distribution (normal, skewed, etc.).
- Box Plots (Box-and-Whisker Plots): Visually show the median, quartiles, and outliers in a dataset. They’re useful for comparing different groups of data.
- Root Cause Analysis: Techniques such as the 5 Whys, Fishbone diagrams, and Fault Tree Analysis help identify the underlying causes of variation.
For example, if a control chart shows points consistently outside the control limits, it signals that the process is unstable and needs investigation. Identifying the root causes can lead to implementing corrective actions.
Q 8. Describe your experience with statistical process control (SPC).
Statistical Process Control (SPC) is a powerful collection of methods used to monitor and control a process’s variation over time. It helps us understand if a process is stable and predictable, or if it’s drifting out of control and producing unacceptable results. My experience with SPC spans various industries, from manufacturing to healthcare. I’ve extensively used SPC techniques to analyze production line data, identify trends, and implement improvements resulting in reduced defects and increased efficiency. For instance, in a previous role, we used SPC to monitor the fill weight of a pharmaceutical product. By analyzing control charts, we identified a recurring pattern of underfilling during specific shifts, ultimately leading to an adjustment in the filling machine’s settings and eliminating the issue.
I’m proficient in using various SPC tools including control charts (X-bar and R charts, p-charts, c-charts, etc.), capability analysis, and process performance metrics like Cp and Cpk. I have a deep understanding of how to interpret control chart patterns and differentiate between common cause and special cause variation. My experience extends to training personnel in proper SPC methodology and its practical application within their daily tasks.
Q 9. What are control charts and how are they used?
Control charts are graphical tools used in SPC to monitor process behavior over time. They display data points plotted against control limits, giving a visual representation of process stability. These charts help identify whether the process is operating within its expected range or if there are deviations indicating potential problems. Think of them as a dashboard for your process, highlighting potential issues before they lead to significant defects or losses. There are various types of control charts, chosen depending on the type of data being monitored.
- X-bar and R charts: Used for continuous data (e.g., weight, length, temperature) to monitor the average and range of the data.
- p-charts: Used for attribute data representing the proportion of nonconforming units (e.g., percentage of defective items).
- c-charts: Used for attribute data representing the number of defects per unit (e.g., number of scratches on a painted surface).
By analyzing the plotted points and their relation to the control limits (typically 3 standard deviations from the mean), we can identify patterns and trends that signal process instability. For example, a point outside the control limits suggests a special cause variation, warranting investigation and corrective action. Several points consistently trending upwards or downwards also suggest a problem requiring attention. Control charts are not just for identifying problems; they also serve as evidence of a stable process, enabling better prediction and decision-making.
Q 10. How do you handle outliers in your data?
Outliers, or data points significantly deviating from the rest of the data, require careful handling. Simply removing them without investigation is usually inappropriate. My approach involves a multi-step process:
- Investigation: First, I investigate the potential causes of the outlier. Was there a measurement error? Was there an unusual event or condition during the process? This may involve reviewing the raw data, process logs, and talking to operators.
- Verification: If a clear cause is identified (e.g., a known equipment malfunction), and the outlier is confirmed to be erroneous, it can be removed or corrected. If the cause remains unclear, further investigation is necessary.
- Data Transformation (if appropriate): In some cases, data transformation (e.g., logarithmic transformation) can help mitigate the influence of outliers without removing them entirely.
- Robust Statistical Methods: Consider using statistical methods less sensitive to outliers, such as the median instead of the mean, or robust regression techniques.
- Documentation: All steps taken regarding outliers should be documented meticulously, including the reason for any action (removal, correction, transformation). This ensures transparency and traceability.
Ignoring outliers can lead to inaccurate conclusions and inappropriate decisions. For instance, an outlier in a process capability study might falsely indicate a poor performing process when the root cause is simply a data entry error.
Q 11. Explain the concept of root cause analysis.
Root cause analysis (RCA) is a systematic process for identifying the underlying causes of problems, rather than just treating symptoms. It’s crucial for preventing recurrence and achieving sustainable improvements. Think of it as detective work – you’re not just looking for whodunnit, but why they did it, and how to prevent it from happening again.
A well-conducted RCA follows a structured approach. It typically involves collecting data, analyzing the situation, brainstorming potential causes, verifying the root causes, and finally developing solutions to prevent recurrence. This ensures that the problem is addressed at its core, not just patched up temporarily.
For example, imagine a manufacturing process producing too many defective parts. A simple fix might be to re-train operators or increase inspection frequency. However, RCA might reveal that the underlying problem is machine wear leading to inconsistent tolerances. This requires a different solution, such as machine maintenance or replacement, which addresses the root cause and prevents future problems.
Q 12. What are the different root cause analysis tools you have used?
Over the years, I’ve employed several root cause analysis tools, each suitable for different contexts. These include:
- 5 Whys: A simple yet effective technique involving repeatedly asking “Why?” to drill down to the root cause. While simple, it’s surprisingly powerful in uncovering deeper issues.
- Fishbone Diagram (Ishikawa Diagram): A visual tool that helps brainstorm potential causes categorized by factors like manpower, materials, machinery, methods, measurement, and environment. This promotes collaborative thinking.
- Fault Tree Analysis (FTA): A top-down, deductive approach for analyzing the potential causes that lead to a specific undesirable event (failure). It is particularly useful for complex systems.
- Pareto Chart: Identifies the vital few causes contributing to the majority of problems. This helps focus efforts on addressing the most impactful issues first.
The choice of tool depends on the complexity of the problem and the available data. Often, I combine different techniques for a more comprehensive analysis.
Q 13. How do you develop and implement a control plan?
Developing and implementing a control plan is a crucial step in ensuring that improvements made after an RCA are sustained. It’s a documented set of actions that ensures the implemented solutions prevent problems from recurring. Think of it as a maintenance plan for your process, regularly checking if everything is still working correctly.
The development of a control plan usually involves:
- Identifying Key Process Characteristics (KPCs): These are the critical elements of your process that must be controlled to maintain quality. They’re often derived from the RCA.
- Defining Control Methods: This involves specifying the methods used to monitor and control the KPCs. This might include SPC charts, regular equipment maintenance checks, operator training, or standardized work instructions.
- Establishing Control Limits: Control limits are set based on historical data or process capability analysis, defining acceptable variation.
- Defining Responsibilities: Clearly assigning roles and responsibilities for monitoring and maintaining the process.
- Scheduling Monitoring Activities: Establishing a schedule for regular monitoring and data collection.
- Establishing Response Plans: Defining actions to take if the process goes out of control, including corrective actions and escalation procedures.
- Documentation: All aspects of the control plan should be clearly documented and readily accessible.
Regular review and updating of the control plan are essential to maintain its effectiveness. It’s a living document, adapted as needed to reflect changes in the process or external factors.
Q 14. Describe your experience with Design of Experiments (DOE).
Design of Experiments (DOE) is a powerful statistical methodology used to efficiently investigate the impact of multiple factors on a response variable. Instead of changing one factor at a time, DOE allows us to systematically vary several factors simultaneously, providing a more comprehensive understanding of their interactions and effects. This is extremely useful in optimizing processes and product designs.
My experience with DOE includes designing and conducting experiments using various designs such as full factorial designs, fractional factorial designs, and Taguchi methods. I’m proficient in using statistical software packages to analyze the experimental data, identifying significant factors and their interactions. This allows for the selection of optimal factor settings to improve product quality or process efficiency.
For example, in a previous project, we used DOE to optimize the baking process of a food product. We varied factors such as baking temperature, time, and humidity. The DOE analysis revealed the optimal combination of these factors that resulted in a significant improvement in product quality and reduced waste. DOE is not just about optimizing existing processes; it can be used in the design phase to develop better products and processes from the outset.
Q 15. What is the difference between Lean and Six Sigma?
Lean and Six Sigma are both powerful quality improvement methodologies, but they focus on different aspects. Lean focuses on eliminating waste and maximizing efficiency in processes, while Six Sigma focuses on reducing variation and defects to achieve near-perfection. Think of it this way: Lean is about doing things faster and better with less waste, while Six Sigma is about doing things right every time, with minimal errors.
- Lean: Emphasizes value stream mapping, identifying and removing waste (muda), continuous improvement (Kaizen), and empowering employees. It’s often visualized using tools like value stream maps and kanban boards. The goal is to streamline processes to deliver maximum value to the customer with minimal effort.
- Six Sigma: Uses statistical methods to identify and reduce process variation, aiming to achieve a level of quality where defects are extremely rare (3.4 defects per million opportunities or DPMO). It employs defined methodologies like DMAIC (Define, Measure, Analyze, Improve, Control) and DMADV (Define, Measure, Analyze, Design, Verify).
In short, Lean helps you do things faster and more efficiently, while Six Sigma helps you ensure that what you’re doing is consistently high quality.
Career Expert Tips:
- Ace those interviews! Prepare effectively by reviewing the Top 50 Most Common Interview Questions on ResumeGemini.
- Navigate your job search with confidence! Explore a wide range of Career Tips on ResumeGemini. Learn about common challenges and recommendations to overcome them.
- Craft the perfect resume! Master the Art of Resume Writing with ResumeGemini’s guide. Showcase your unique qualifications and achievements effectively.
- Don’t miss out on holiday savings! Build your dream resume with ResumeGemini’s ATS optimized templates.
Q 16. How do you integrate Lean principles into a Six Sigma project?
Integrating Lean principles into a Six Sigma project significantly enhances its effectiveness. Lean’s focus on waste reduction complements Six Sigma’s emphasis on reducing variation. Here’s how we can integrate them:
- Value Stream Mapping: Before starting the DMAIC cycle, use value stream mapping to understand the current state of the process. This helps identify areas where waste exists (e.g., excess inventory, waiting time, unnecessary steps), which can then be targeted for improvement during the Six Sigma project.
- Kaizen Events: Incorporate short, focused improvement events (Kaizen) during the ‘Improve’ phase of DMAIC. These events involve cross-functional teams working collaboratively to quickly implement solutions and test their effectiveness.
- 5S Methodology: Implement 5S (Sort, Set in Order, Shine, Standardize, Sustain) to create a more organized and efficient work environment. This reduces waste and makes it easier to identify and address problems.
- Visual Management: Use visual management tools, like kanban boards or control charts, to monitor progress and make process improvements more transparent to all team members.
For example, in a manufacturing setting, we might use value stream mapping to identify bottlenecks in the production line. Then, using Six Sigma’s DMAIC methodology, we’d analyze the root causes of the bottlenecks and implement solutions. Kaizen events would help quickly test and refine those solutions, and 5S would ensure a clean and organized workplace to support the improvements.
Q 17. Describe a time you used data analysis to solve a problem.
During my time at a logistics company, we were experiencing significant delays in order fulfillment. Customer satisfaction was plummeting. I used data analysis to pinpoint the problem.
First, I gathered data on order processing times, including steps like order entry, picking, packing, and shipping. I used Minitab to perform descriptive statistics, identifying significant variation in processing times across different product categories and order sizes. Then, I used control charts to monitor process stability and identify outliers. I found that a significant portion of the delays stemmed from inaccurate picking due to outdated inventory management software. The software wasn’t accurately reflecting real-time inventory levels.
Through regression analysis, I found a strong correlation between the accuracy of inventory data and order fulfillment times. Based on this data-driven insight, I recommended implementing a new, real-time inventory tracking system. Following the implementation, the average order processing time decreased by 25%, and customer satisfaction scores improved significantly.
Q 18. What is your experience with Minitab or other statistical software?
I have extensive experience with Minitab, JMP, and R. Minitab is my primary tool for statistical analysis in Six Sigma projects. I’m proficient in using its features for descriptive statistics, hypothesis testing, regression analysis, ANOVA, control charting, and design of experiments (DOE). I regularly use Minitab to analyze process capability, identify sources of variation, and validate process improvements.
My experience with JMP allows for more advanced statistical modeling and data visualization capabilities. R provides a powerful and flexible platform for more customized analysis and scripting, often used for more complex statistical modeling requirements beyond the scope of standard software.
Q 19. How do you manage stakeholders during a Six Sigma project?
Managing stakeholders effectively is crucial for the success of any Six Sigma project. I employ a proactive communication strategy that includes:
- Regular Communication: I schedule regular meetings with key stakeholders to keep them informed of progress, challenges, and changes in project scope. These meetings involve presentations of key findings and the next steps in the project.
- Clearly Defined Roles and Responsibilities: At the outset, I clearly define the roles and responsibilities of each stakeholder, ensuring everyone understands their contribution to the project.
- Visual Progress Tracking: I utilize dashboards and visual aids to communicate project status and progress transparently. This makes it easy for stakeholders to monitor the project’s progress and quickly understand its performance.
- Proactive Issue Management: I establish a process for identifying and addressing potential issues proactively, ensuring that concerns are raised and addressed promptly to avoid project delays.
- Executive Summaries: I provide concise executive summaries for senior stakeholders, focusing on key findings, recommendations, and impact on the business.
By fostering open communication and managing expectations, I ensure that stakeholders remain engaged and supportive throughout the project lifecycle.
Q 20. Describe your experience with project management methodologies.
I’m proficient in various project management methodologies, including Agile, Waterfall, and PRINCE2. My approach often combines elements of these methodologies based on the specific project requirements. For Six Sigma projects, I typically employ a structured approach similar to the Waterfall methodology, utilizing the DMAIC or DMADV framework. However, I also incorporate Agile principles, such as iterative development and frequent feedback loops, to enhance flexibility and responsiveness to change.
My experience includes developing project plans, managing resources, tracking progress against milestones, managing risks, and ensuring projects are completed on time and within budget. I use tools like Microsoft Project and Jira for project planning and tracking.
Q 21. How do you measure the success of a Six Sigma project?
The success of a Six Sigma project is measured by its impact on key performance indicators (KPIs) and its ability to deliver tangible benefits to the organization. This is done both quantitatively and qualitatively.
- Quantitative Metrics: We use quantifiable metrics, such as reduction in defects (DPMO), improved process cycle time, reduced costs, and increased customer satisfaction scores, to assess the project’s success. The improvement in these metrics compared to the baseline should be significant and statistically significant.
- Qualitative Metrics: Beyond numbers, we also consider qualitative factors such as improvements in employee morale, process efficiency, and overall business performance. Feedback surveys and interviews are used to gauge these aspects.
- Sustainment Plan: A critical element is the development and implementation of a robust sustainment plan to ensure that the improvements achieved during the project are maintained long-term. This includes standardized work instructions, training programs, and ongoing monitoring of key metrics.
For example, a successful Six Sigma project aimed at reducing manufacturing defects might demonstrate a significant reduction in DPMO, a decrease in scrap and rework costs, and an increase in customer satisfaction resulting from higher-quality products. A strong sustainment plan will ensure these improvements are not temporary.
Q 22. What are some common challenges in Six Sigma implementation?
Six Sigma, while a powerful methodology for process improvement, faces several common implementation challenges. These often stem from a lack of understanding, inadequate resources, or resistance to change within the organization.
- Lack of Top Management Support: Without buy-in from leadership, Six Sigma initiatives can struggle to gain traction. Resources may be insufficient, and champions may lack the authority to drive necessary changes.
- Insufficient Training and Expertise: Six Sigma requires a skilled workforce proficient in DMAIC (Define, Measure, Analyze, Improve, Control) or DMADV (Define, Measure, Analyze, Design, Verify) methodologies. Inadequate training can lead to flawed projects and poor results.
- Resistance to Change: Employees accustomed to established processes may resist change, even if it’s for the better. This resistance can manifest as passive-aggressive behavior, lack of cooperation, or outright sabotage.
- Data Collection and Analysis Challenges: Accurate and reliable data is the cornerstone of Six Sigma. Difficulties in collecting, cleaning, and analyzing data can derail projects.
- Lack of Defined Metrics and Goals: Without clearly defined, measurable goals, it’s impossible to determine if a project has been successful. Ambiguous targets lead to wasted effort and unclear outcomes.
- Sustaining Improvements: Implementing changes is only half the battle. Organizations need to establish mechanisms to sustain the improvements achieved through Six Sigma projects, preventing a regression to previous inefficiencies.
For example, in a previous role, we faced challenges in data collection due to outdated systems. We overcame this by implementing a new data management system and providing thorough training to the team. This ensured accurate data for our analysis, ultimately leading to significant process improvements.
Q 23. How do you overcome resistance to change during improvement initiatives?
Overcoming resistance to change is crucial for the success of any improvement initiative. It requires a multi-faceted approach that combines communication, education, and engagement.
- Proactive Communication: Clearly communicate the reasons for change, the benefits it will bring, and the potential impact on employees. Address concerns head-on and involve employees in the process.
- Education and Training: Provide training on the new processes and tools. This will equip employees with the skills and knowledge needed to succeed in the changed environment.
- Employee Involvement: Involve employees in the design and implementation of the changes. This fosters ownership and buy-in, reducing resistance and increasing acceptance.
- Leadership Support: Strong leadership is essential. Leaders need to champion the change, actively participate in the process, and clearly communicate their commitment to the initiative.
- Celebrate Successes: Acknowledge and celebrate successes along the way to reinforce positive behaviors and build momentum.
- Address Concerns and Feedback: Actively listen to concerns and feedback, addressing them appropriately. This shows that employees’ opinions are valued, reducing anxiety and improving morale.
In one instance, a team was initially resistant to adopting a new software system. By actively involving them in the training process, customizing the system to address their specific needs, and highlighting the improved efficiency, we were able to overcome the initial resistance and secure their buy-in. We even established a forum for ongoing feedback and iterative improvements to the system, fostering a more collaborative and positive atmosphere.
Q 24. Describe your experience with various quality management systems (e.g., ISO 9001).
I have extensive experience with various quality management systems, most notably ISO 9001. My experience spans from internal audits to implementation and maintenance.
- ISO 9001: I’ve been involved in the implementation and maintenance of ISO 9001 in several organizations. This included developing and documenting quality management systems, conducting internal audits, ensuring compliance with standards, and participating in external audits. I understand the importance of the Plan-Do-Check-Act (PDCA) cycle in continuous improvement and its central role within ISO 9001.
- Other QMS: While ISO 9001 is my primary focus, I’m also familiar with other standards and frameworks, including those specific to certain industries (e.g., medical devices, automotive). The core principles of quality management, such as continuous improvement and customer focus, remain consistent across these various systems.
In one project, we successfully transitioned a company to ISO 9001 certification. This involved a thorough assessment of existing processes, gap analysis, documentation development, employee training, and implementation of corrective actions. The successful certification resulted in improved efficiency, reduced errors, and enhanced customer satisfaction. The certification also opened up new business opportunities and reinforced customer confidence.
Q 25. How do you ensure data accuracy and integrity in your projects?
Data accuracy and integrity are paramount in Six Sigma projects. Compromised data leads to flawed conclusions and ineffective improvements. My approach involves a multi-step process:
- Data Source Validation: Identify and verify the reliability and accuracy of data sources. This might involve examining data collection methods, assessing potential biases, and evaluating the completeness of the data sets.
- Data Cleaning and Transformation: Cleanse the data to remove outliers, inconsistencies, and errors. This might involve techniques like outlier detection, data imputation, and data transformation.
- Data Validation: Validate the cleaned data to ensure it’s accurate and reliable. This might involve cross-referencing data with other sources, performing reasonableness checks, and using statistical methods to verify data quality.
- Data Security: Protect the data from unauthorized access, modification, or deletion. This involves implementing appropriate security measures, such as access controls and encryption.
- Documentation: Meticulously document all data collection, cleaning, and analysis processes. This ensures traceability and facilitates audits.
For example, in a project involving customer satisfaction data, we discovered inconsistencies in the data collection process. We addressed this by standardizing the data collection methodology, implementing data validation rules, and retraining the data collectors. This resulted in significantly more reliable and accurate data for our analysis.
Q 26. Explain your understanding of risk assessment and mitigation.
Risk assessment and mitigation are crucial for project success. They involve identifying potential problems, analyzing their likelihood and impact, and developing strategies to reduce or eliminate these risks.
- Risk Identification: Systematically identify potential risks that could impact the project. This can involve brainstorming sessions, reviewing past project experiences, and analyzing project plans.
- Risk Analysis: Assess the likelihood and potential impact of each identified risk. This often involves using a risk matrix that plots likelihood against impact to prioritize risks.
- Risk Response Planning: Develop strategies to address each risk. These strategies might include risk avoidance, risk mitigation, risk transfer (e.g., insurance), or risk acceptance.
- Risk Monitoring and Control: Continuously monitor and control risks throughout the project lifecycle. This involves regularly reviewing the risk register, tracking risk events, and adapting risk response plans as needed.
Imagine a project deploying a new software system. A potential risk is insufficient user training. By identifying this risk early, we can develop a robust training program, minimizing the likelihood of user errors and system downtime, thereby mitigating the risk effectively.
Q 27. What is your experience with Kaizen events or other rapid improvement techniques?
I have significant experience with Kaizen events, also known as Kaizen workshops or rapid improvement events. These focused, short-term events aim to achieve rapid and significant improvements in a specific process.
- Kaizen Event Methodology: Kaizen events typically involve a cross-functional team working together for a defined period (e.g., a week) to identify and eliminate waste in a specific process. The team utilizes various lean manufacturing tools and techniques, such as value stream mapping, 5S, and root cause analysis.
- My Experience: I’ve led and participated in numerous Kaizen events, focusing on various processes such as manufacturing, supply chain, and administrative workflows. I’m proficient in facilitating these events, guiding teams through the process, and ensuring the identification and implementation of sustainable improvements.
- Other Rapid Improvement Techniques: Besides Kaizen events, I’m familiar with other rapid improvement techniques, such as Lean Six Sigma, which combines lean principles with Six Sigma methodologies for faster and more efficient process improvements. I’ve utilized these techniques in various projects to achieve immediate and long-term process enhancements.
In one instance, a Kaizen event focused on streamlining a manufacturing process reduced production time by 15% and improved product quality. The success of this event was attributable to the team’s focused effort, the use of data-driven analysis, and a commitment to implementing sustainable changes.
Key Topics to Learn for Six Sigma and Quality Management Interview
- DMAIC Methodology: Understand the Define, Measure, Analyze, Improve, and Control phases, and be prepared to discuss their application in real-world scenarios.
- Statistical Process Control (SPC): Familiarize yourself with control charts (e.g., X-bar and R charts, p-charts, c-charts), their interpretation, and how they’re used to monitor process stability.
- Lean Principles: Discuss the principles of waste reduction (Muda), value stream mapping, and Kaizen events. Be ready to provide examples of how these principles improve efficiency and quality.
- Process Capability Analysis: Understand Cp, Cpk, and Pp, and how these metrics are used to assess process performance and capability.
- Root Cause Analysis (RCA): Be familiar with various RCA techniques like 5 Whys, Fishbone diagrams (Ishikawa diagrams), and Fault Tree Analysis. Be prepared to explain how to effectively identify and address root causes of defects.
- Design of Experiments (DOE): Understand the basics of DOE, including the purpose and application of factorial designs and other experimental designs to optimize processes.
- Quality Management Systems (QMS): Be familiar with ISO 9001 principles and how organizations implement and maintain quality management systems.
- Problem-Solving Techniques: Showcase your proficiency in structured problem-solving methodologies beyond Six Sigma tools. This demonstrates adaptability and a broader skillset.
- Metrics and KPIs: Be able to discuss relevant key performance indicators (KPIs) used to measure process performance and overall quality in various industries.
Next Steps
Mastering Six Sigma and Quality Management significantly enhances your career prospects, opening doors to leadership roles and high-impact projects. To maximize your job search success, creating a strong, ATS-friendly resume is crucial. ResumeGemini is a trusted resource that can help you build a professional and impactful resume tailored to your skills and experience. We provide examples of resumes specifically designed for Six Sigma and Quality Management professionals to help you showcase your expertise effectively. Invest time in crafting a compelling resume – it’s your first impression on potential employers.
Explore more articles
Users Rating of Our Blogs
Share Your Experience
We value your feedback! Please rate our content and share your thoughts (optional).
What Readers Say About Our Blog
This was kind of a unique content I found around the specialized skills. Very helpful questions and good detailed answers.
Very Helpful blog, thank you Interviewgemini team.

