Cracking a skill-specific interview, like one for Communication software (e.g., Microsoft Office Suite, Google Workspace), requires understanding the nuances of the role. In this blog, we present the questions you’re most likely to encounter, along with insights into how to answer them effectively. Let’s ensure you’re ready to make a strong impression.
Questions Asked in Communication software (e.g., Microsoft Office Suite, Google Workspace) Interview
Q 1. Explain your experience using Microsoft Word’s advanced features, such as mail merge and track changes.
Mail merge in Microsoft Word is a powerful tool that allows you to create personalized documents from a single template. Imagine sending out hundreds of customized letters – mail merge automates this process. You create a main document containing placeholders for personalized information and a data source (like an Excel spreadsheet) containing the recipient details. Word then merges the data with the template, generating individual documents for each recipient. Track Changes, on the other hand, is invaluable for collaborative writing. It allows multiple authors to work on the same document simultaneously, recording all edits and comments. This makes it easy to see who made what changes, and to accept or reject revisions before finalizing the document. I’ve extensively used both features in projects ranging from creating personalized marketing materials to managing team edits on large reports. For example, I once used mail merge to generate over 500 personalized thank-you letters to conference attendees, significantly saving time and effort. With Track Changes, I’ve successfully managed collaborative projects with multiple authors, ensuring everyone’s input is considered and the final document is consistent and polished.
Q 2. How proficient are you with Excel formulas and functions (e.g., VLOOKUP, Pivot Tables)?
I’m highly proficient in Excel formulas and functions. My expertise extends beyond basic formulas to encompass advanced functions like VLOOKUP, INDEX-MATCH, Pivot Tables, and array formulas. VLOOKUP is excellent for retrieving data from one table based on a match in another. Imagine having a list of customer IDs and needing their corresponding names from a separate database. VLOOKUP efficiently retrieves that information. However, INDEX-MATCH is even more versatile as it allows for more flexible lookups (both vertical and horizontal, and doesn’t require a sorted data set as VLOOKUP does). Pivot Tables are indispensable for summarizing and analyzing large datasets. They allow you to quickly group data, calculate aggregates (sums, averages, etc.), and create interactive reports to identify trends. For instance, I used Pivot Tables to analyze sales data to identify top-performing products and regions, a key factor in informing business strategies. I frequently employ array formulas for more complex calculations requiring simultaneous processing of multiple cells. I consider these skills essential for data-driven decision making.
Q 3. Describe your experience creating and managing presentations in PowerPoint.
My PowerPoint experience encompasses everything from creating basic presentations to designing sophisticated, visually engaging presentations with animations, transitions, and embedded multimedia. I’m adept at structuring presentations logically, incorporating compelling visuals like charts and graphs, and delivering impactful presentations. I’ve presented to small teams and large audiences, tailoring my presentations to the audience and the message. I utilize PowerPoint’s features for consistency and professional appeal: master slides for consistent branding, SmartArt for creating visually appealing diagrams, and animations to highlight key points. For example, I created a compelling presentation for a product launch which incorporated interactive elements and data visualizations to engage the audience and effectively communicate the product’s key features and benefits.
Q 4. How would you use Excel to analyze a large dataset and identify key trends?
Analyzing large datasets in Excel involves a multi-step process. First, I would clean and organize the data, handling missing values and inconsistencies. Then, I would use Pivot Tables to summarize the data, grouping it by relevant variables and calculating key statistics like averages, sums, and counts. To identify trends, I would use charting tools to visualize the data. Scatter plots can reveal correlations, line charts display trends over time, and bar charts compare values across different categories. Conditional formatting can help highlight outliers or significant data points. Advanced functions like regression analysis (using the `LINEST` function or data analysis toolpak) can be used to model relationships between variables and make predictions. Finally, I would document my findings and communicate them clearly through concise reports and visualizations. For example, I analyzed a dataset of customer transactions to identify seasonal purchasing patterns, leading to more effective inventory management strategies.
Q 5. What are your preferred methods for formatting documents in Word to ensure consistency and readability?
Consistent and readable document formatting is crucial for professional communication. My approach involves utilizing Word’s built-in styles and templates to maintain uniformity. I define styles for headings, paragraphs, lists, and other elements, ensuring consistency in font, size, spacing, and indentation throughout the document. I use templates to maintain a consistent look and feel across multiple documents. I also pay close attention to visual hierarchy, using headings and subheadings effectively, adding white space to improve readability, and employing visuals (tables, charts) to enhance understanding. Finally, I thoroughly proofread and edit to catch any formatting inconsistencies or errors before finalizing the document. For instance, I developed a standardized template for all project reports within my team, ensuring consistency and saving considerable formatting time.
Q 6. How familiar are you with Google Sheets’ collaboration features?
I’m very familiar with Google Sheets’ collaboration features. Real-time co-editing allows multiple users to work simultaneously on the same spreadsheet, seeing each other’s changes instantly. Version history allows tracking changes and reverting to previous versions if needed. Commenting features facilitate discussions and feedback directly within the spreadsheet. This collaborative environment is incredibly efficient, allowing for quick iteration and feedback cycles. For example, I regularly use these features with my team to collaboratively build and update financial models, enabling efficient project management and immediate feedback on budget forecasts.
Q 7. Describe your experience using Google Docs for collaborative writing and editing.
Google Docs provides a seamless collaborative writing and editing experience. Real-time co-editing allows multiple authors to work simultaneously, similar to Google Sheets. The commenting and suggestion features enable clear communication and feedback. Version history makes tracking changes simple, allowing easy rollback if necessary. I’ve extensively used Google Docs for collaborative projects like writing proposals, reports, and marketing materials. The ability to simultaneously edit documents with multiple team members has streamlined workflows and drastically reduced turnaround times. The comment feature allows for precise feedback and efficient editing. For instance, I used Google Docs to write a large research paper with three other authors, managing various comments and edits efficiently.
Q 8. How would you utilize Google Slides to create an engaging presentation for a diverse audience?
Creating an engaging presentation in Google Slides for a diverse audience requires careful consideration of visuals, content, and accessibility. I’d start by choosing a visually appealing yet unobtrusive template. Overly busy backgrounds can be distracting. Then, I’d focus on clear, concise messaging, using bullet points and short sentences to avoid overwhelming the audience.
To cater to diverse learning styles, I’d incorporate a variety of media: images, videos, charts, and data visualizations. Visual aids should be high-quality and relevant to the message, not just decorative. I would also consider using animations and transitions subtly to maintain audience interest but avoid excessive clutter.
Accessibility is crucial. I’d ensure sufficient color contrast for readability, use alt text for all images to aid visually impaired users, and keep font sizes large enough for everyone to read easily. I’d also provide a handout or transcript for those who prefer to follow along in a different format. For example, I might offer a version with larger fonts or simplified language if needed. Finally, I would preview the presentation on different devices (laptop, tablet, phone) to ensure consistent quality and readability across platforms.
Q 9. Explain your experience using Google Forms for data collection and analysis.
Google Forms is a powerful tool for data collection and analysis. I have extensive experience creating forms for surveys, feedback collection, and event registration. My process typically involves designing a clear, logical flow of questions, utilizing various question types (multiple choice, short answer, scales) depending on the type of data needed.
For example, in a recent project, I used Google Forms to collect customer feedback on a new software release. The form included multiple-choice questions for satisfaction ratings, open-ended questions for suggestions, and a Likert scale to measure user agreement with various statements. After collecting the responses, I leveraged Google Sheets’ built-in functions like COUNTIF, AVERAGE, and SUM to analyze the data. I also used data visualization tools like charts and graphs to visually represent the findings and create reports that communicated key insights effectively to stakeholders. I can also utilize Google Sheets’ pivot tables to summarize large datasets and perform more complex data analysis. This whole process streamlined our feedback collection and analysis, leading to more informed product development decisions.
Q 10. How do you manage multiple versions of a document using version control in Google Docs or Microsoft Word?
Managing multiple versions of a document is critical for collaboration and avoiding data loss. In Google Docs, the built-in version history automatically tracks all changes. You can easily revert to previous versions by accessing the ‘File’ menu and selecting ‘Version history’. This allows multiple collaborators to work concurrently without overwriting each other’s work.
Microsoft Word offers similar functionality, though the specific method for accessing version history might vary slightly depending on the version. In many cases, it is achieved via the ‘File’ menu and then looking for ‘Info’ and ‘Version History’. Both platforms provide a record of revisions, allowing you to compare changes and revert to specific points in the document’s evolution. For more complex projects or when collaboration is extensive, considering utilizing a dedicated version control system like Git might be beneficial, though it’s usually overkill for simple documents.
Q 11. Describe a time you had to troubleshoot a technical issue within Microsoft Office or Google Workspace.
During the launch of a major marketing campaign, our team experienced an issue where several users could not access shared Google Sheets. The error message suggested a permission problem. After initial troubleshooting (checking individual user permissions and network connectivity), I discovered that the issue stemmed from a recently implemented Google Workspace update that had inadvertently altered the sharing settings of our spreadsheets.
My solution involved systematically reviewing the sharing settings of all relevant spreadsheets, ensuring that the correct permissions were applied to all team members. I also consulted Google Workspace’s help documentation and community forums to ensure my approach was accurate. The problem was resolved within an hour, preventing a significant delay to the campaign launch. This highlighted the importance of staying up-to-date on platform updates and proactively checking settings after significant changes.
Q 12. How would you use conditional formatting in Excel to highlight specific data points?
Conditional formatting in Excel allows you to automatically highlight cells that meet specific criteria. This is extremely useful for quickly identifying important data points. For example, let’s say you have a spreadsheet of sales data with sales figures in column A. You want to highlight all cells with sales exceeding $10,000.
To accomplish this, you would select the column (column A), then navigate to the ‘Home’ tab and click ‘Conditional Formatting’. You’d choose ‘Highlight Cells Rules’ and then select ‘Greater Than’. You’ll then enter the value ‘10000’ and select a formatting style (like a bold font and a fill color). Excel will now automatically highlight all cells in column A with values greater than $10,000. You can extend this to other conditions like ‘Less Than’, ‘Between’, ‘Text that Contains’, and many more, based on your specific data analysis needs.
Q 13. What are some best practices for creating effective charts and graphs in Excel or Google Sheets?
Creating effective charts and graphs in Excel or Google Sheets hinges on clarity, accuracy, and relevance. The type of chart you use should reflect the data you’re presenting. Bar charts are great for comparing categories, while line charts are best for showing trends over time. Pie charts show proportions of a whole, but should be used sparingly as they can become difficult to read with too many segments.
Key best practices include using clear and concise titles and labels, choosing appropriate scales, and avoiding unnecessary clutter or embellishments. Ensure the chart accurately reflects the data, and consider your audience when making design choices. For example, a visually appealing chart that is difficult to interpret is ultimately ineffective. Properly labeled axes, a legend when needed, and data-driven colors enhance comprehension, avoiding color choices simply for aesthetics. Remember to select a chart type that accurately reflects your data; using the wrong chart type can misrepresent the findings.
Q 14. How familiar are you with macros in Microsoft Excel or Google Apps Script?
I am proficient in both macros in Microsoft Excel and Google Apps Script. Macros in Excel automate repetitive tasks using VBA (Visual Basic for Applications). For instance, I’ve used macros to automate the process of formatting reports, generating invoices, or processing large datasets. A simple example would be a macro to automatically apply formatting styles to a report, saving considerable time and ensuring consistency.
Google Apps Script offers a JavaScript-based approach to automating tasks within Google Workspace. It allows for integration across various Google services, such as Google Sheets, Docs, and Drive. For example, I could use Apps Script to create a script that automatically emails a report generated from a Google Sheet every Monday morning. I find that understanding both VBA and Apps Script offers a powerful suite of tools to increase productivity and efficiency across various platforms and workflows. The choice between the two largely depends on the specific application and the environment you’re working in.
Q 15. How would you use PowerPoint or Google Slides to create a visually appealing and informative presentation?
Creating a visually appealing and informative presentation hinges on a thoughtful design process. It’s not just about putting words on slides; it’s about crafting a compelling narrative. I start by defining the key message and target audience. This helps me choose the right visual style and tone. For example, a presentation for investors will differ significantly from one for a team brainstorming session.
In PowerPoint or Google Slides, I leverage features like:
- Master Slides: Ensuring consistent branding and formatting across all slides, saving time and maintaining a professional look.
- High-Quality Images and Graphics: Using royalty-free images or creating custom graphics to enhance engagement and avoid cluttered slides. A picture is worth a thousand words – choose impactful ones.
- Effective Charts and Graphs: Data visualization is key. I choose the right chart type (bar, line, pie, etc.) to accurately represent the data and make it easily digestible. I avoid overwhelming the audience with too much detail.
- Strategic Use of Animation and Transitions: Subtle animations can guide the audience’s eye and highlight key points, but overuse can be distracting. Smooth transitions between slides maintain flow.
- White Space: Leaving ample white space prevents a cluttered look and improves readability.
- Consistent Font and Color Schemes: Using a limited, well-coordinated palette enhances professionalism and makes the presentation easy on the eyes.
For example, in a recent presentation on sales growth, I used a line chart to clearly illustrate the upward trend over time, supplemented by high-quality images representing our key products. This ensured the data was both accurate and engaging.
Career Expert Tips:
- Ace those interviews! Prepare effectively by reviewing the Top 50 Most Common Interview Questions on ResumeGemini.
- Navigate your job search with confidence! Explore a wide range of Career Tips on ResumeGemini. Learn about common challenges and recommendations to overcome them.
- Craft the perfect resume! Master the Art of Resume Writing with ResumeGemini’s guide. Showcase your unique qualifications and achievements effectively.
- Don’t miss out on holiday savings! Build your dream resume with ResumeGemini’s ATS optimized templates.
Q 16. Explain your experience with data visualization tools within Microsoft Office or Google Workspace.
I’m highly proficient in data visualization using tools within both Microsoft Office and Google Workspace. My experience goes beyond simply creating charts; it involves selecting the most appropriate visualization for the data and the audience. The goal is always clarity and understanding.
In Excel, I extensively utilize charts and PivotTables to analyze and present data. PivotTables allow me to summarize large datasets and create dynamic reports. I also use conditional formatting to highlight trends and patterns within the data. For example, I recently used conditional formatting to highlight sales figures that exceeded targets, making it instantly clear which regions were outperforming expectations.
In Google Sheets, I find the charting capabilities equally robust, with the added benefit of real-time collaboration. I’ve used Google Sheets to create interactive dashboards that allow multiple stakeholders to track key performance indicators (KPIs) simultaneously. The ability to share and update these dashboards in real-time is extremely beneficial for collaborative projects.
Q 17. How would you use Microsoft Outlook or Google Gmail to manage your inbox efficiently?
Efficient inbox management is critical for productivity. My approach in Outlook and Gmail revolves around a multi-pronged strategy.
- Filtering and Rules: I create filters and rules to automatically sort emails into folders based on sender, subject, or keywords. This prevents important emails from getting lost in the clutter. For example, I have a rule that automatically moves emails from my boss to a designated ‘High Priority’ folder.
- Regular Purging: I regularly delete or archive unnecessary emails to keep my inbox clean and manageable. This might involve a weekly or bi-weekly review of emails.
- Utilizing Folders and Labels: I organize emails into folders or labels based on projects or topics. This allows for quick and easy retrieval of specific information.
- Scheduled Email Checking: Instead of constantly checking emails, I schedule specific times throughout the day to review and respond. This prevents interruptions and improves focus.
- Using Canned Responses: I use canned responses for frequently asked questions or routine communications, saving significant time.
- Unsubscribe from Unnecessary Mailing Lists: Regularly unsubscribing from irrelevant email lists keeps the inbox cleaner and reduces distractions.
These strategies, combined with utilizing the search function effectively, allow me to manage even a high volume of emails efficiently.
Q 18. How proficient are you with creating and managing shared calendars in Google Calendar or Outlook?
I’m very proficient in creating and managing shared calendars. This is crucial for coordinating teams and projects. Both Outlook and Google Calendar offer robust features for collaboration.
In Google Calendar, the ease of sharing and real-time updates is a major advantage. I frequently create shared calendars for team projects, allowing everyone to see appointments, deadlines, and availability at a glance. The color-coding options help differentiate various events and assignments.
In Outlook, I utilize similar features to create and manage shared calendars. I ensure access permissions are correctly configured to prevent unauthorized access. This includes setting up different permission levels for different users, allowing for flexibility depending on the project.
For example, in a recent project, I created a shared calendar for a cross-functional team working on a product launch. This ensured everyone was aware of meeting schedules, deadlines, and individual task assignments, streamlining the entire process and minimizing scheduling conflicts.
Q 19. How do you ensure data accuracy and integrity when working with spreadsheets?
Data accuracy and integrity are paramount. My approach involves a multi-layered strategy that begins even before data entry.
- Data Validation: I use data validation rules in spreadsheets to restrict the type of data entered into specific cells. This helps prevent errors like entering text into numerical columns.
- Formulas and Functions: I leverage formulas and functions to automate calculations and minimize manual data entry, reducing the risk of human error. For example, using SUM, AVERAGE, and other functions reduces the chance of calculation errors.
- Cross-Checking Data: I cross-check data from multiple sources whenever possible, ensuring consistency and accuracy. This might involve comparing data from different spreadsheets or databases.
- Regular Audits: Periodic audits of the spreadsheet help identify and rectify any discrepancies or inconsistencies that may have slipped through earlier checks.
- Version Control: Keeping track of changes made to the spreadsheet (using version history features) helps trace errors and enables quick reverts to previous versions if needed.
- Data Cleaning: I regularly clean the data by removing duplicates, handling missing values, and correcting inconsistencies. This includes using features like ‘Remove Duplicates’ in Excel or Google Sheets.
These practices minimize errors and enhance the reliability of the data analysis.
Q 20. Describe your experience using Microsoft Access or Google Data Studio.
I have experience using both Microsoft Access and Google Data Studio, each serving different purposes in data management and reporting.
Microsoft Access is a powerful relational database management system (RDBMS). I’ve used it to design and manage databases, creating tables, defining relationships between them, and developing queries to extract specific information. I can also create forms and reports to interact with and present the data in a user-friendly way.
Google Data Studio excels in data visualization and reporting. I’ve used it to create interactive dashboards by connecting it to various data sources (Google Sheets, Google Analytics, etc.). This allows for dynamic data visualization and easy sharing of reports with stakeholders. It’s excellent for creating visually appealing reports from large datasets that would be cumbersome to manage and present solely within a spreadsheet.
For instance, I recently used Access to build a database to track customer information and orders, while I utilized Google Data Studio to build a dashboard visualizing key sales metrics extracted from that database, allowing for real-time analysis of sales performance.
Q 21. How would you create a professional-looking email using Microsoft Outlook or Google Gmail?
Crafting a professional-looking email involves more than just typing words. It requires attention to detail and a clear understanding of your audience and purpose.
- Clear and Concise Subject Line: The subject line is crucial; it should accurately reflect the email’s content and entice the recipient to open it.
- Professional Salutation: Use an appropriate salutation, such as ‘Dear [Name]’, unless you have an established informal relationship with the recipient.
- Well-Structured Body: Organize the email logically with short paragraphs and bullet points where appropriate. This ensures readability and avoids overwhelming the recipient.
- Proper Grammar and Spelling: Proofread carefully before sending to maintain professionalism.
- Professional Closing: Use a professional closing, such as ‘Sincerely’, ‘Regards’, or ‘Best regards’.
- Appropriate Signature: Include a professional signature with your name, title, contact information, and company logo (if applicable).
- Attachments (if needed): Name attachments clearly and ensure they are relevant to the email’s content.
For example, when emailing a potential client, I would use a concise subject line like ‘Proposal for [Project Name]’ and a professional salutation like ‘Dear Mr./Ms. [Last Name]’. The email body would be structured clearly, focusing on the key benefits and value proposition. The use of a professional signature would leave a lasting positive impression.
Q 22. What are the key differences between Microsoft Office and Google Workspace?
Microsoft Office and Google Workspace are both comprehensive suites of communication and productivity software, but they differ significantly in their approach and functionality. Microsoft Office is a locally installed suite (though cloud integration is increasingly prominent), emphasizing individual control and offline access. Google Workspace, on the other hand, is primarily cloud-based, focusing on collaboration and real-time editing.
- Licensing: Microsoft Office uses a perpetual license model (you buy it once) or subscription-based options (Microsoft 365), while Google Workspace operates on a subscription model only.
- Accessibility: Microsoft Office requires installation on individual devices, while Google Workspace is accessible from any device with an internet connection and a browser.
- Collaboration: Google Workspace excels in real-time collaboration with features like simultaneous editing and integrated commenting. Microsoft Office offers co-authoring but with some limitations depending on the version and application.
- File Storage: Microsoft Office relies on local storage or OneDrive (cloud storage), while Google Workspace integrates seamlessly with Google Drive, offering abundant cloud storage.
- Integration: Google Workspace tightly integrates all its applications, allowing for a smooth workflow between Docs, Sheets, Slides, etc. Microsoft Office offers integration within its suite but requires more manual steps for cross-application workflow.
Think of it like this: Microsoft Office is a powerful desktop application, perfect for working offline and needing full control over your files. Google Workspace is a dynamic, collaborative platform best suited for team projects and real-time interaction.
Q 23. Which software do you prefer for specific tasks, and why?
My software preference depends heavily on the task. For tasks requiring extensive offline work, complex data analysis, or advanced desktop publishing features, I prefer Microsoft Office, specifically Excel for its robust data manipulation capabilities and PowerPoint for its advanced presentation design features. For instance, building a detailed financial model with complex formulas and pivot tables is significantly easier in Excel than in Google Sheets.
However, for collaborative projects where real-time feedback and simultaneous editing are crucial, or when quick document creation and sharing are needed, I prefer Google Workspace. For example, brainstorming a marketing campaign outline with a team is far more efficient using Google Docs due to its simultaneous editing feature. The immediate feedback loop and ease of version control make it ideal for these collaborative efforts.
Q 24. How do you stay up-to-date with new features and updates in communication software?
Staying updated is critical in this rapidly evolving field. I utilize a multi-pronged approach:
- Official Blogs and Newsletters: I regularly follow the official blogs and newsletters from Microsoft and Google Workspace, which announce new features and provide tutorials.
- Industry Publications and Websites: I read reputable technology publications and websites dedicated to productivity software. These often offer in-depth reviews and comparisons of new features.
- Webinars and Online Courses: Participating in webinars and online courses helps me understand the practical applications of new updates and features. Hands-on training is invaluable.
- User Forums and Communities: Engaging with online communities and forums helps me learn about users’ experiences and discover hidden tips and tricks related to the software.
This holistic approach ensures I’m not only aware of new features but also understand their practical implications and best practices for implementation.
Q 25. Describe your experience with automating tasks using communication software.
I have extensive experience automating tasks using both Microsoft Office and Google Workspace. In Microsoft Office, I frequently leverage VBA (Visual Basic for Applications) to automate repetitive tasks such as data entry, report generation, and email distribution. For example, I’ve created macros in Excel to automatically format and consolidate data from multiple spreadsheets, saving hours of manual work.
In Google Workspace, I utilize Google Apps Script, a JavaScript-based scripting language, for similar automation tasks. I’ve automated email notifications, created custom functions in Google Sheets, and developed simple web applications integrated with Google Drive to streamline workflows. For example, I developed a script that automatically generates reports based on updated spreadsheet data and sends them to relevant stakeholders via email.
Q 26. How would you handle a situation where a collaborator is not following formatting guidelines?
Handling inconsistent formatting is a common challenge in collaborative projects. My approach is to combine proactive measures with a collaborative problem-solving strategy:
- Establish Clear Guidelines: Before starting any project, I ensure clear formatting guidelines are established and shared with all collaborators. This includes style guides, templates, and examples.
- Provide Training or Resources: If collaborators are unfamiliar with the formatting guidelines, I provide training or access to relevant resources, such as style guides or tutorials.
- Gentle Feedback and Collaboration: I initiate a conversation with the collaborator, politely pointing out the inconsistencies and offering constructive feedback. I emphasize the importance of consistent formatting for readability and professional presentation. I focus on collaboration rather than criticism.
- Utilize Software Features: Leverage built-in formatting tools like style sheets in Word and Google Docs to enforce consistency.
- Version Control: Utilize version control features to track changes and revert to previously formatted versions if necessary.
The key is to be proactive, helpful, and collaborative. The goal is not to blame but to improve the quality of the final product through constructive feedback and support.
Q 27. How would you ensure data security when sharing documents via Google Workspace or Microsoft Office?
Data security is paramount when sharing documents. My approach incorporates several key strategies:
- Access Control: I always utilize the access control features offered by both Google Workspace and Microsoft Office. This includes setting permissions to limit access to authorized individuals only – for example, setting specific user permissions to view, edit, or comment on documents.
- Two-Factor Authentication (2FA): I ensure 2FA is enabled on all my accounts to add an extra layer of security. This significantly reduces the risk of unauthorized access even if passwords are compromised.
- Data Encryption: I leverage built-in encryption features and consider using end-to-end encrypted solutions for sensitive data. Both platforms offer options for encrypting files either at rest or in transit.
- Regular Audits and Reviews: Periodically reviewing access permissions and ensuring that only necessary individuals have access to sensitive data is crucial.
- Security Awareness Training: Emphasizing the importance of data security with collaborators and ensuring they understand safe practices is essential to collective security.
By combining these strategies, I can significantly reduce the risk of data breaches and maintain the confidentiality of sensitive information.
Q 28. Describe your experience using communication software in a team environment.
My experience using communication software in team environments has been extensive and consistently positive. I’ve used these tools to facilitate seamless collaboration on diverse projects, from marketing campaigns to complex research studies.
I’ve found that effective communication software helps streamline workflows, enhance team coordination, and reduce ambiguity. For example, using shared documents allows all team members to access the same information, reducing confusion and ensuring everyone is on the same page. Real-time collaborative editing facilitates quicker feedback loops and speeds up the overall project process. Effective use of these tools also improves transparency and accountability within the team.
In larger teams, using features like commenting and task assignment within documents helps maintain organization and track progress effectively. In addition, utilizing video conferencing features for meetings and quick check-ins helps bridge geographical barriers and improve face-to-face interactions even for remote teams. The successful implementation of these technologies has fostered efficient, communicative, and successful team projects.
Key Topics to Learn for Communication Software (e.g., Microsoft Office Suite, Google Workspace) Interview
- Word Processing (e.g., Microsoft Word, Google Docs): Mastering formatting, styles, tables, mail merge, and advanced features like track changes and collaboration tools is crucial. Understand how to create professional-looking documents quickly and efficiently.
- Spreadsheet Software (e.g., Microsoft Excel, Google Sheets): Focus on data entry, formula creation (including VLOOKUP, SUMIF, and pivot tables), data visualization (charts and graphs), and data analysis techniques. Practice creating effective and insightful reports.
- Presentation Software (e.g., Microsoft PowerPoint, Google Slides): Learn to create engaging presentations with strong visual aids, effective storytelling, and polished animations. Practice delivering presentations confidently and adapting to different audiences.
- Email and Calendar Management (e.g., Outlook, Gmail): Showcase proficiency in organizing your inbox, managing multiple calendars, scheduling meetings, and using effective communication etiquette in email correspondence. Understand best practices for professional email communication.
- Collaboration Tools (e.g., SharePoint, Google Drive): Understand how to effectively share and collaborate on documents, spreadsheets, and presentations in a team environment. Highlight your experience with version control and collaborative editing features.
- Problem-Solving & Application: Be prepared to discuss how you’ve used these tools to solve real-world problems, improve efficiency, or contribute to team projects. Focus on quantifiable results whenever possible.
Next Steps
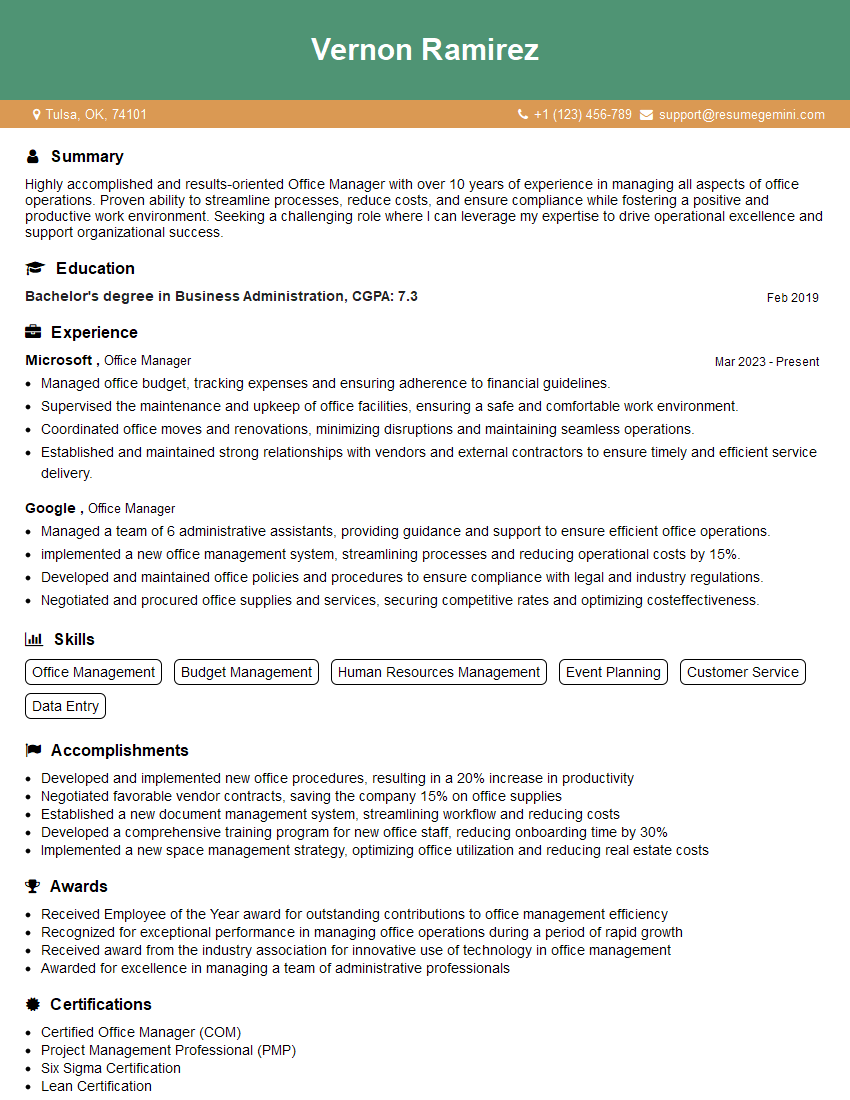
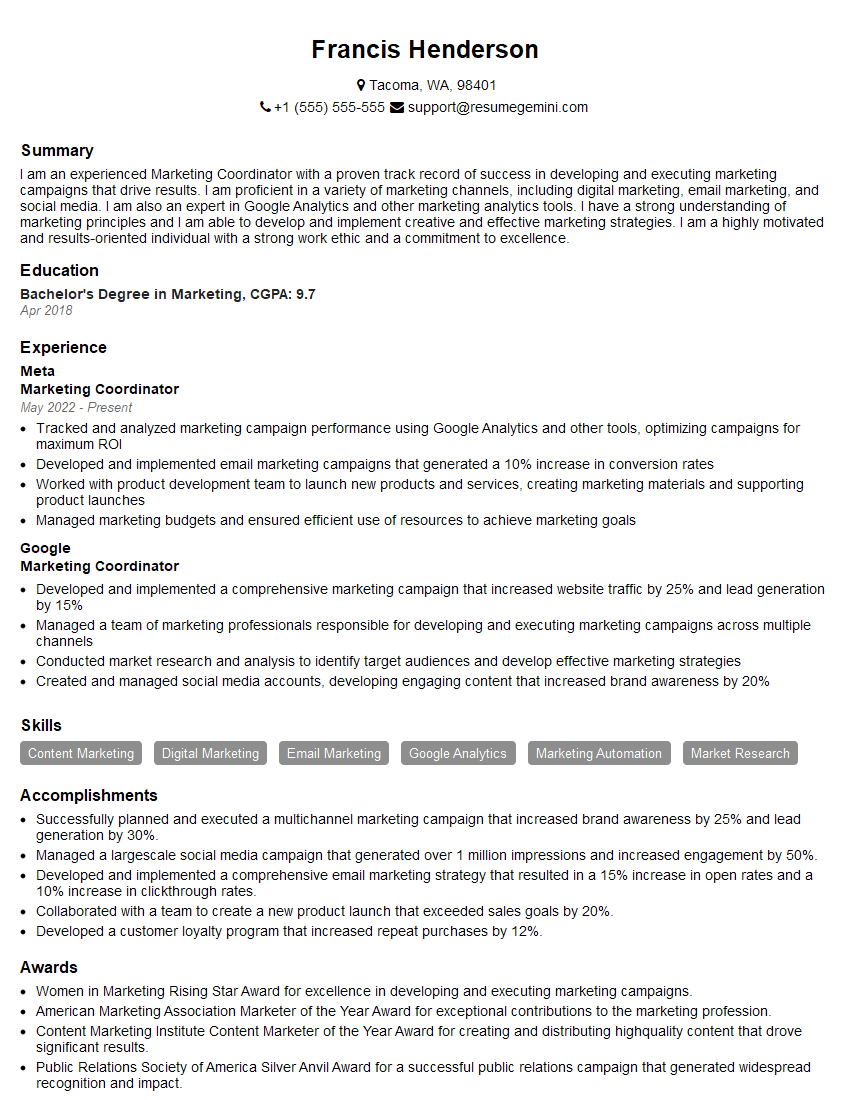
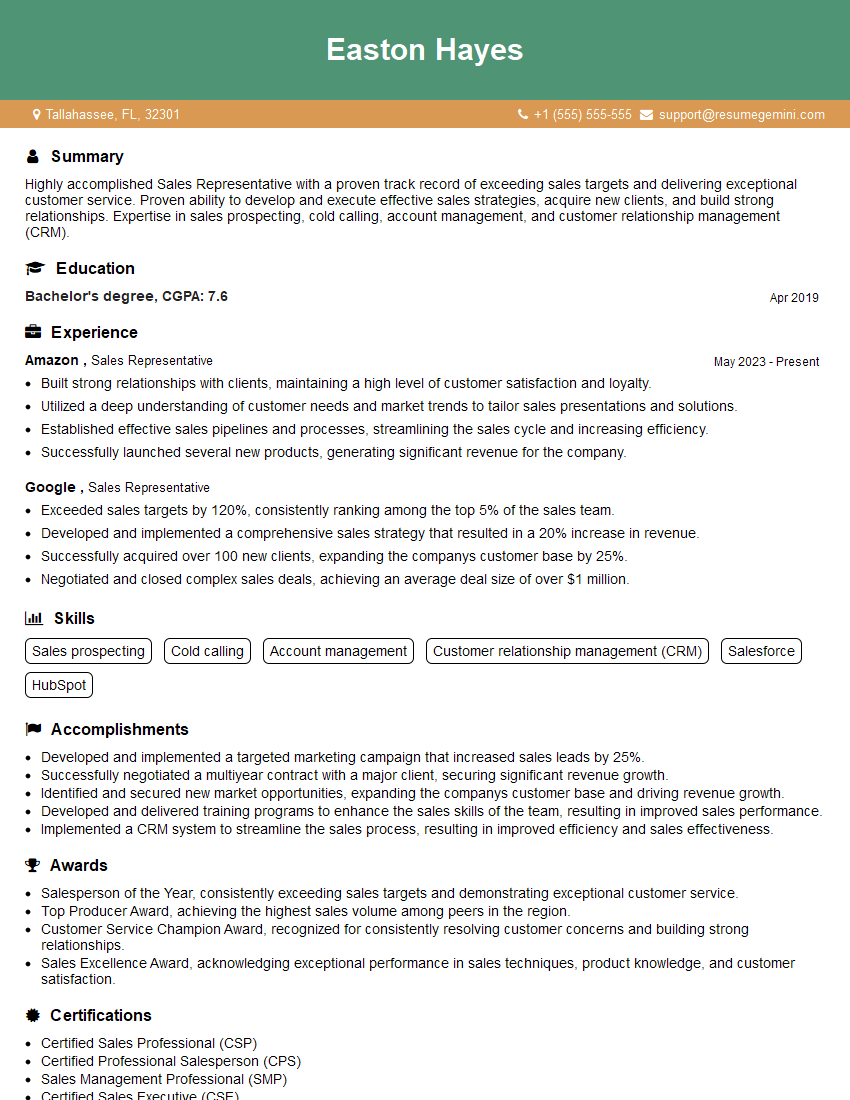
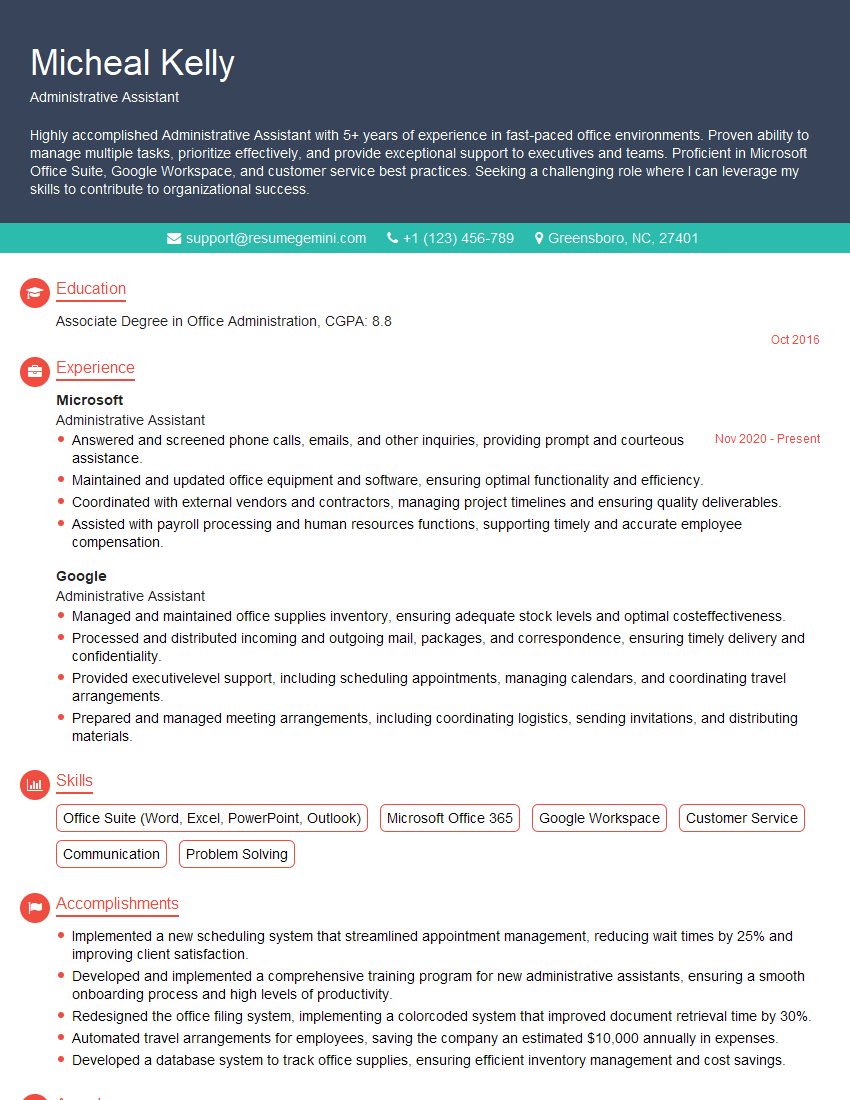
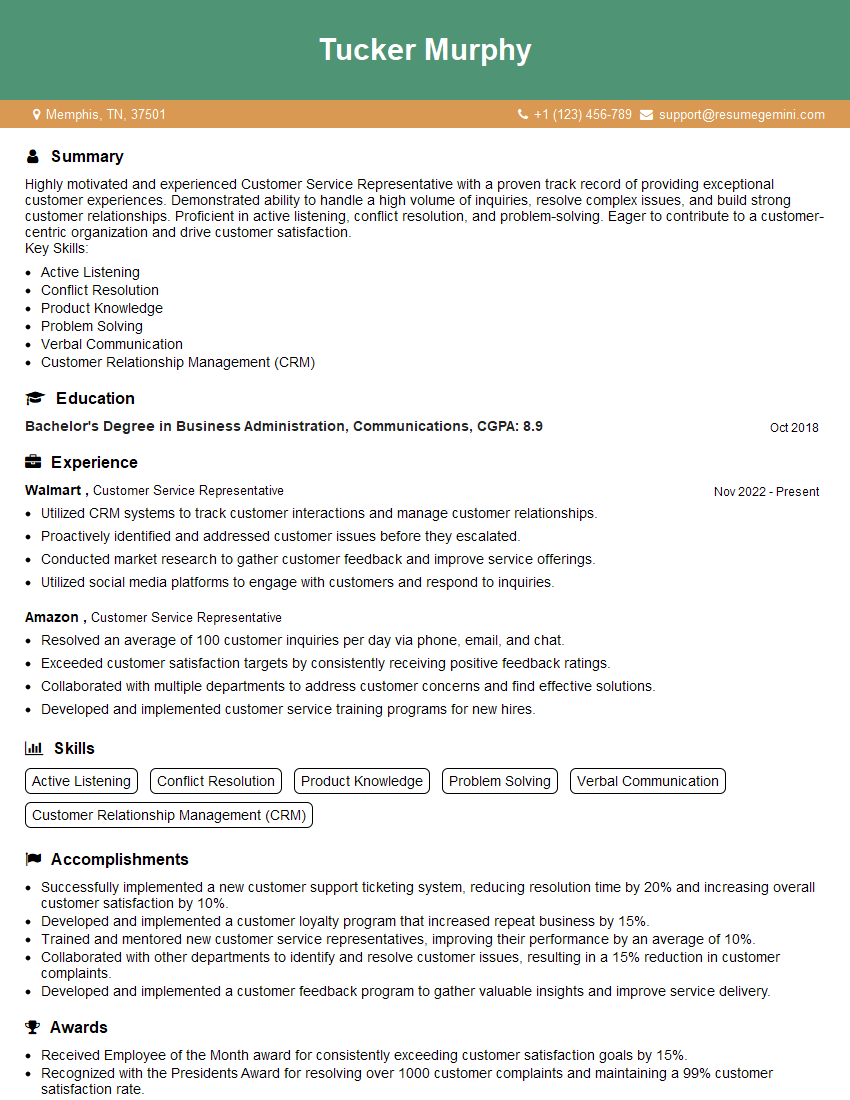
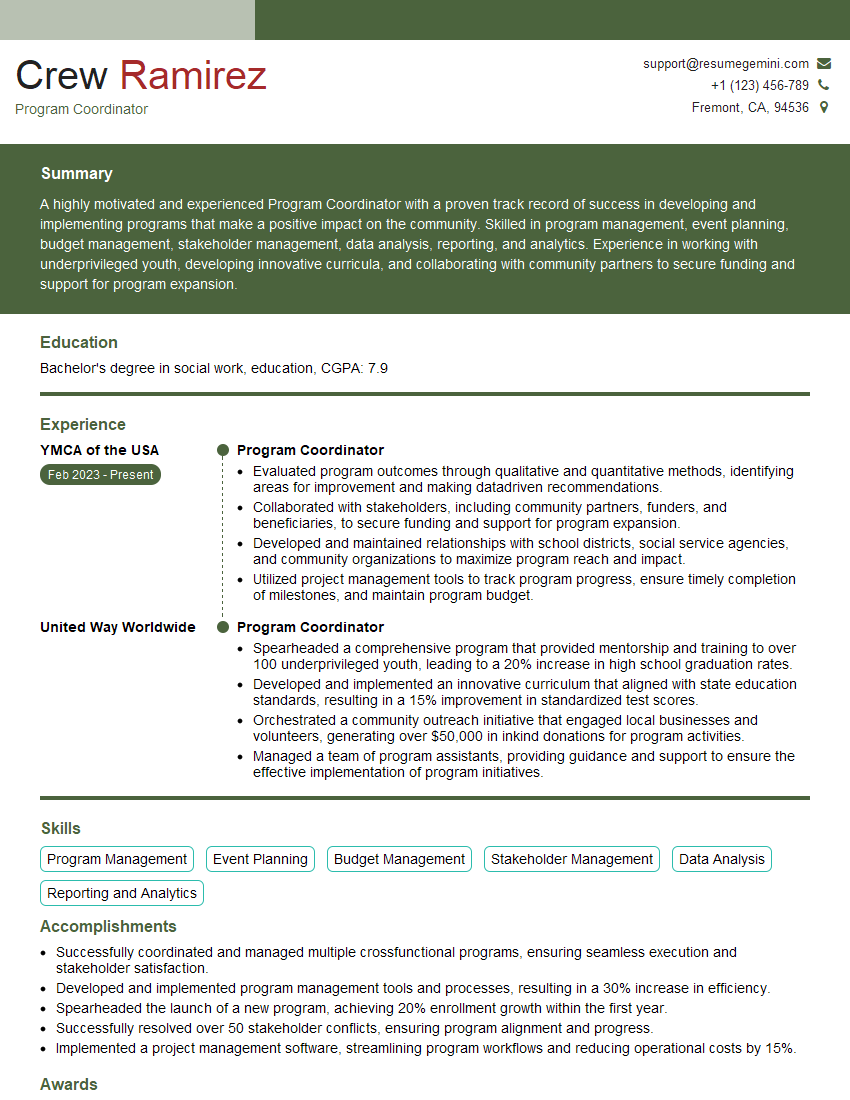
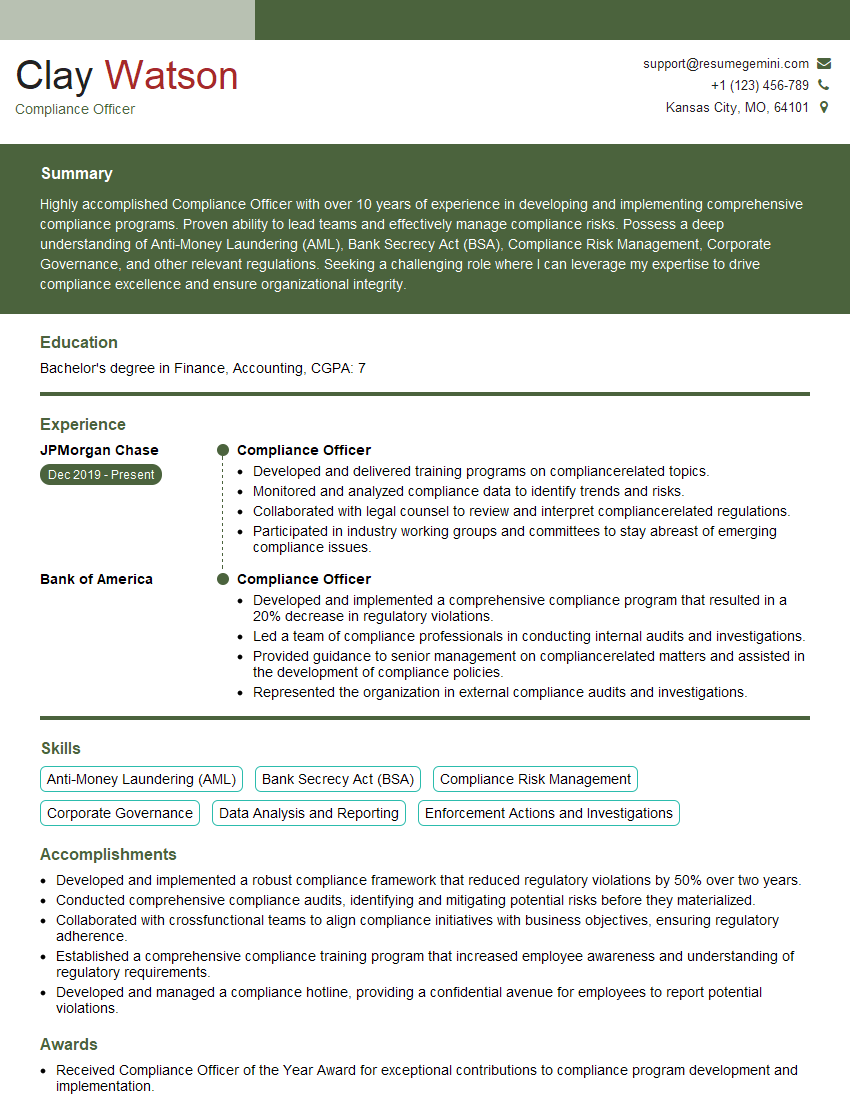
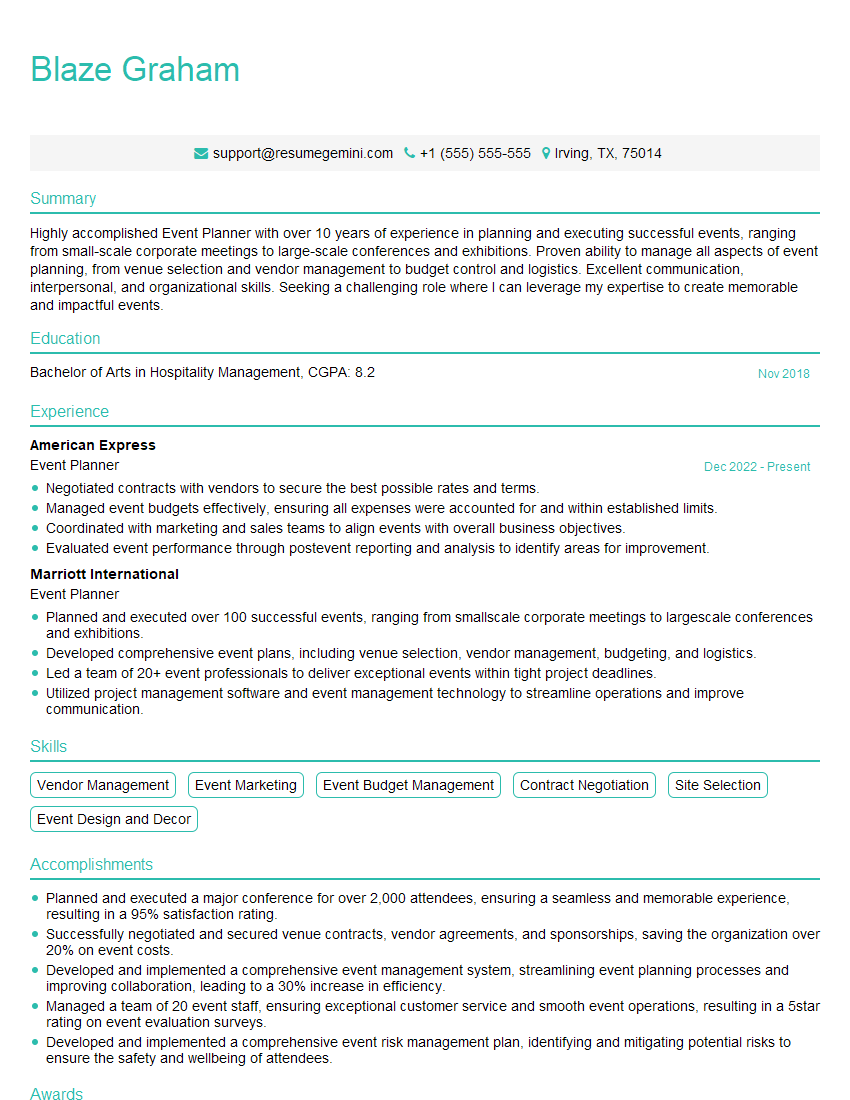
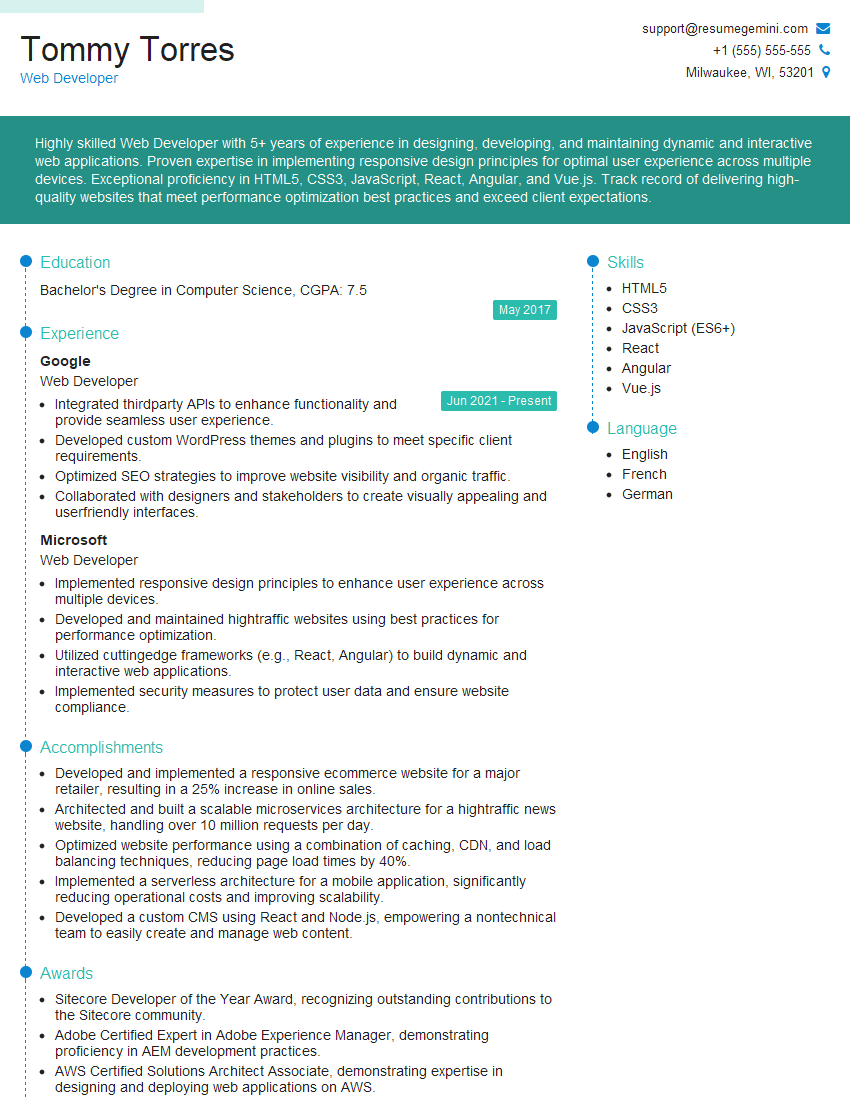
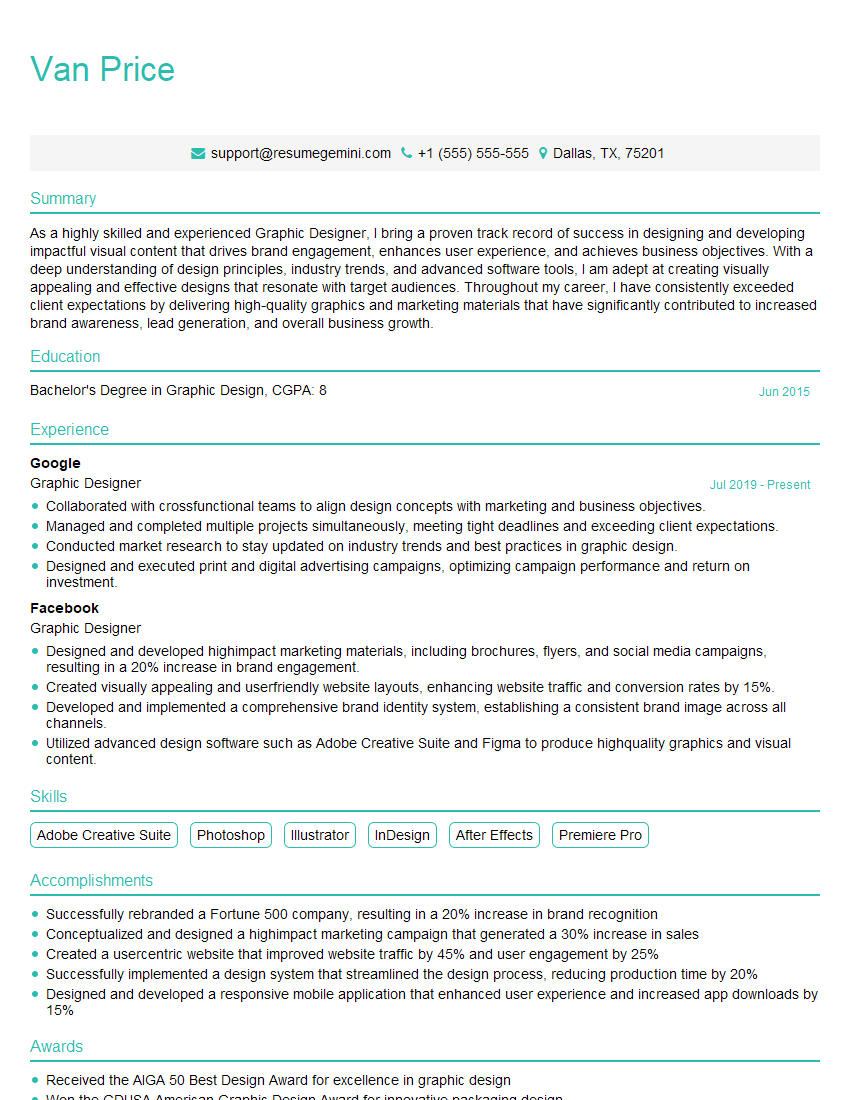
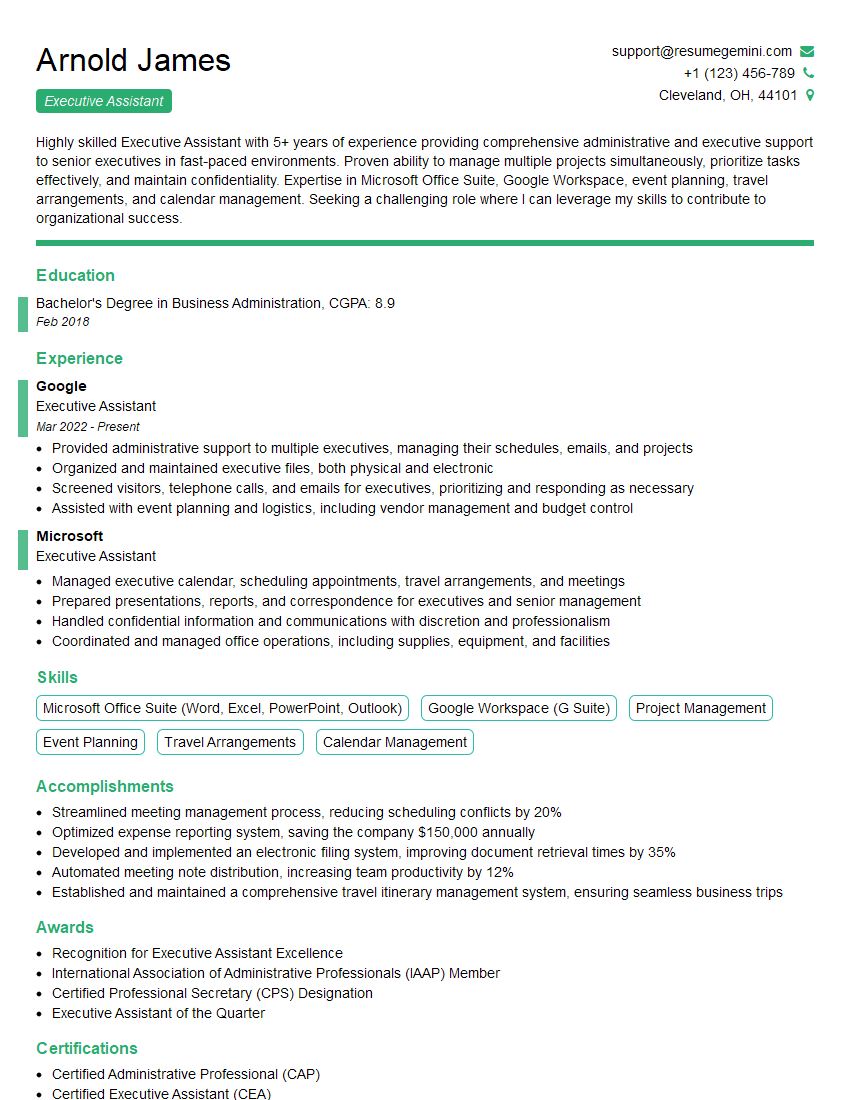
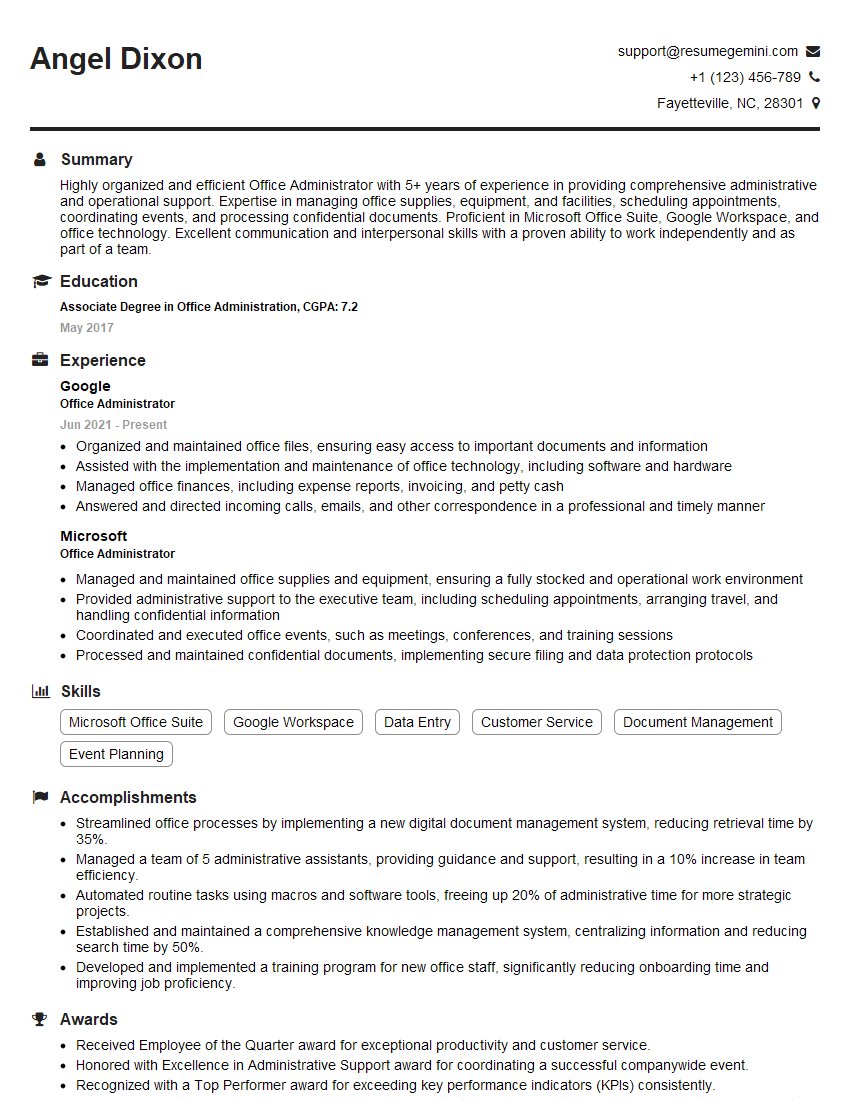
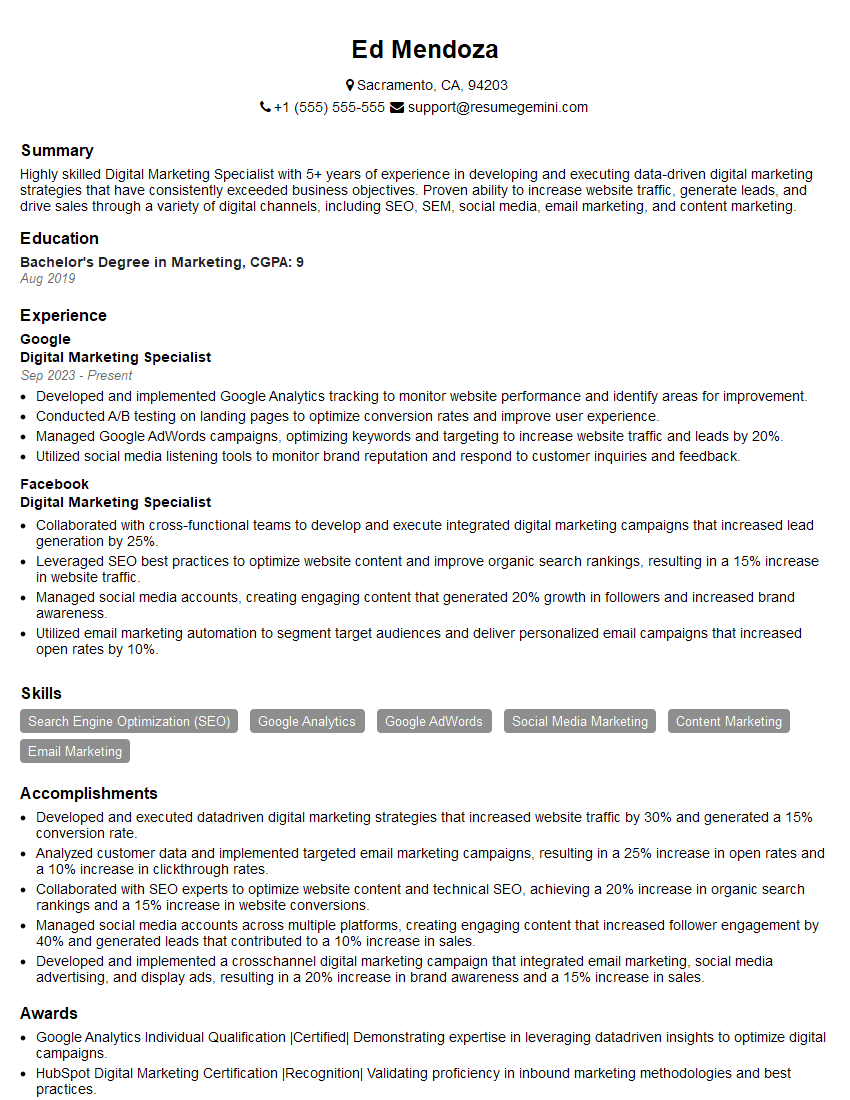
Mastering communication software is essential for success in today’s competitive job market. Proficiency in these tools demonstrates valuable skills and increases your efficiency across various roles. To enhance your job prospects, create an ATS-friendly resume that highlights your skills and experience effectively. ResumeGemini is a trusted resource that can help you build a professional and impactful resume. Examples of resumes tailored to showcasing expertise in communication software like Microsoft Office Suite and Google Workspace are available to help you get started. Take the next step and craft a resume that reflects your abilities and secures your dream job.
Explore more articles
Users Rating of Our Blogs
Share Your Experience
We value your feedback! Please rate our content and share your thoughts (optional).
What Readers Say About Our Blog
This was kind of a unique content I found around the specialized skills. Very helpful questions and good detailed answers.
Very Helpful blog, thank you Interviewgemini team.
