Interviews are more than just a Q&A session—they’re a chance to prove your worth. This blog dives into essential Geographic Orientation and Navigation interview questions and expert tips to help you align your answers with what hiring managers are looking for. Start preparing to shine!
Questions Asked in Geographic Orientation and Navigation Interview
Q 1. Explain the difference between latitude and longitude.
Latitude and longitude are the two coordinates that specify a location on the Earth’s surface. Think of it like a grid system wrapped around a sphere.
Latitude measures the distance north or south of the Equator. The Equator is 0 degrees latitude. Lines of latitude, also called parallels, run east-west. They range from 0° at the Equator to 90° North at the North Pole and 90° South at the South Pole.
Longitude measures the distance east or west of the Prime Meridian, which runs through Greenwich, England. The Prime Meridian is 0 degrees longitude. Lines of longitude, also called meridians, run north-south and converge at the poles. They range from 0° to 180° east and west.
For example, the coordinates 40.7128° N, 74.0060° W represent a location in New York City. The latitude (40.7128° N) tells us it’s about 40.7 degrees north of the Equator, and the longitude (74.0060° W) tells us it’s about 74 degrees west of the Prime Meridian.
Q 2. Describe the various map projections and their applications.
Map projections are methods of transforming the three-dimensional Earth’s surface onto a two-dimensional map. Because it’s impossible to perfectly flatten a sphere without distortion, all projections involve some compromise. Different projections prioritize different properties, leading to a variety of types.
- Mercator Projection: This projection preserves direction and shape locally, making it excellent for navigation. However, it significantly distorts area, especially at higher latitudes. Think of Greenland appearing much larger than it actually is compared to South America.
- Lambert Conformal Conic Projection: This projection is commonly used for mid-latitude regions. It minimizes distortion of shape and direction along standard parallels (lines of latitude). It is often used in aviation and topographic mapping.
- Albers Equal-Area Conic Projection: This projection preserves area accurately, making it suitable for thematic mapping (e.g., population density maps). However, it distorts shape and angles.
- Gnomonic Projection: This projection displays great circles as straight lines, making it useful for plotting long-distance air routes. However, it severely distorts areas away from the point of tangency (the point where the map touches the globe).
The choice of projection depends heavily on the intended use of the map. For example, a navigational chart might use a Mercator projection, while a map showing population distributions would likely use an equal-area projection.
Q 3. How do GPS satellites determine location?
GPS (Global Positioning System) determines location using a technique called trilateration. A GPS receiver needs signals from at least four satellites to pinpoint its location. Each satellite transmits a precise time signal and its own location.
Here’s how it works:
- Signal Reception: The GPS receiver receives signals from multiple satellites.
- Time Measurement: The receiver measures the time it takes for the signal to travel from each satellite.
- Distance Calculation: Knowing the speed of light, the receiver calculates the distance to each satellite.
- Trilateration: The receiver uses the distances to three satellites to determine its position on a sphere. A fourth satellite is needed to resolve the ambiguity of the location (multiple possible points on the sphere).
- Position Calculation: The receiver’s software performs complex calculations to determine the latitude, longitude, and altitude.
Think of it like drawing circles on a map: the distance to each satellite is the radius of a circle. The intersection of these circles is your location.
Q 4. What are the limitations of GPS technology?
While GPS is incredibly useful, it has several limitations:
- Signal Blockage: Buildings, trees, and even heavy cloud cover can obstruct GPS signals, leading to inaccurate or no position data. This is often referred to as ‘urban canyon effect’.
- Atmospheric Effects: The ionosphere and troposphere can affect the speed of GPS signals, introducing errors in distance calculations.
- Multipath Errors: Signals can bounce off surfaces before reaching the receiver, causing delays and inaccurate readings.
- Satellite Geometry: The relative positions of the satellites influence the accuracy of the position fix. Poor satellite geometry (e.g., satellites clustered together) can lead to lower precision.
- Selective Availability (SA): Although no longer active, SA was a deliberate degradation of GPS accuracy for civilian use.
- Receiver Limitations: The quality and sensitivity of the GPS receiver also impact accuracy and reliability. Cheaper receivers are more susceptible to interference.
These limitations necessitate understanding the context in which GPS is being used and employing appropriate mitigation strategies.
Q 5. Explain the concept of georeferencing.
Georeferencing is the process of assigning geographic coordinates (latitude and longitude) to points on a map or image. This allows the digital data to be spatially located on the Earth’s surface. It’s crucial for integrating different datasets and analyzing spatial relationships.
Imagine you have a scanned historical map. Georeferencing involves aligning it with a known coordinate system by identifying corresponding points on both the map and a base map with accurate coordinates. Software then uses these control points to transform the scanned map into a geographically accurate representation.
Applications of georeferencing include:
- Creating geographic information systems (GIS) layers
- Integrating remotely sensed data (satellite imagery, aerial photos)
- Analyzing spatial patterns and relationships
- Overlaying different datasets (e.g., land use, population data)
Q 6. Describe different types of coordinate systems.
Coordinate systems define how locations are represented numerically on a map. Different coordinate systems are suited to various purposes and regions.
- Geographic Coordinate System (GCS): Uses latitude and longitude to define positions on a sphere. It is a spherical coordinate system.
- Projected Coordinate System (PCS): Transforms the 3D Earth surface onto a 2D plane, using a map projection. Examples include UTM (Universal Transverse Mercator) and State Plane Coordinate Systems. These are planar coordinate systems.
- Universal Transverse Mercator (UTM): Divides the Earth into 60 zones, each with its own projected coordinate system. Minimizes distortion within each zone, making it useful for large-scale mapping.
- State Plane Coordinate System (SPCS): A set of projected coordinate systems designed specifically for individual states or regions within a country. It uses different projections to minimize distortion within each state’s boundaries.
The choice of coordinate system depends on factors like the size of the area being mapped and the type of analysis being performed. Large-scale maps often use UTM or SPCS, while smaller-scale maps might use a geographic coordinate system.
Q 7. What is a datum and why is it important?
A datum is a reference model of the Earth’s shape and size, serving as a foundation for a coordinate system. It defines the origin and orientation of the coordinate system and the relationship between the coordinates and actual locations on the Earth’s surface. Think of it as the blueprint upon which our map grid is built.
Different datums exist because the Earth is not a perfect sphere; its shape is more accurately described as an oblate spheroid (slightly flattened at the poles and bulging at the equator). These differences mean that different datums can produce slightly different coordinates for the same location.
The importance of datums lies in ensuring consistency and accuracy. Using incompatible datums when combining data from different sources can lead to significant positional errors. For example, a map using the WGS84 datum will show slightly different coordinates than one using NAD83, even though they are both referencing the same point on Earth. Choosing the correct datum is crucial for any GIS application where precise spatial accuracy is critical.
Q 8. How do you interpret topographic maps?
Topographic maps are detailed representations of the Earth’s surface, showing both natural and man-made features and, crucially, elevation. Interpreting them involves understanding their symbology – the system of lines, colors, and symbols used to convey information.
Imagine a topographic map as a 3D model flattened onto a 2D surface. Contour lines are the key; these are lines connecting points of equal elevation. Closely spaced contour lines indicate steep slopes; widely spaced lines show gentle slopes. The elevation value of each contour line is usually indicated on the map itself. Other important elements include:
- Elevation points (spot heights): Precise elevations marked with numbers.
- Relief shading: Uses shading to create a 3D effect, enhancing the perception of slope.
- Symbols: Represent various features like buildings, roads, rivers, and vegetation. A legend explains each symbol’s meaning.
For example, identifying a mountain peak involves locating the highest closed contour line and possibly a spot height that indicates the precise elevation. Similarly, navigating across a steep ravine involves observing the closely-spaced contour lines, indicating potential challenges.
Q 9. Explain the concept of spatial resolution.
Spatial resolution refers to the level of detail visible on a map or image. It essentially determines the smallest discernible feature size. Think of it like the resolution on your computer screen: higher resolution means more detail, smaller pixels, and a clearer image. In geographic data, higher spatial resolution means you can see smaller features.
For instance, a satellite image with a high spatial resolution (e.g., 1-meter resolution) might clearly show individual houses and trees. In contrast, a lower spatial resolution image (e.g., 10-meter resolution) might only show larger features like blocks of houses or forest patches. The resolution is expressed as the size of a pixel (e.g., 1 meter x 1 meter) or the distance between data points.
The choice of spatial resolution depends on the application. If you need to analyze individual trees in a forest, high resolution is necessary. For mapping large-scale features like road networks, a lower resolution might suffice.
Q 10. What are the different types of map scales?
Map scales define the relationship between the distance on a map and the corresponding distance on the ground. There are three primary ways to represent map scale:
- Representative Fraction (RF): A ratio, such as 1:100,000, meaning 1 unit on the map represents 100,000 units on the ground. This is a unitless ratio and universally understood.
- Verbal Scale: A descriptive statement, such as ‘1 inch equals 1 mile.’ This is easily understood but less precise than RF.
- Graphical Scale: A visual representation using a bar that shows the equivalent distance on the map and ground. This is convenient for direct measurement but depends on the physical size of the map.
The choice of scale depends on the map’s purpose and the area it covers. Large-scale maps (e.g., 1:1,000) show small areas with great detail, whereas small-scale maps (e.g., 1:1,000,000) depict large areas but with less detail.
Q 11. How do you calculate distances using a map and scale?
Calculating distances on a map using the scale is straightforward. First, measure the distance on the map using a ruler or other suitable measuring tool. Next, apply the map’s scale to convert the map distance to the actual ground distance.
Example: Let’s say the distance between two points on a map with a scale of 1:50,000 is 5 cm.
1. Convert units: If the scale is in cm and your measurement is in cm, no conversion is needed. But if the scale is in inches or other units, you need to convert your measurement to match. 2. Apply the scale: 5 cm (map) * 50,000 = 250,000 cm. 3. Convert to a more manageable unit: 250,000 cm / 100 cm/meter = 2,500 meters; 2,500 meters / 1000 meters/kilometer = 2.5 kilometers. Thus, the actual distance between the two points is approximately 2.5 kilometers.
Q 12. Describe your experience with GIS software (e.g., ArcGIS, QGIS).
I have extensive experience with both ArcGIS and QGIS, using them for various geospatial tasks throughout my career. In ArcGIS, I’ve worked extensively with spatial analysis tools for tasks like overlay analysis, network analysis, and geoprocessing. I’m proficient in creating and managing geodatabases, performing data conversion and cleaning, and generating various map products. I’ve used ArcGIS Pro for more advanced 3D analysis and visualization.
In QGIS, I have expertise in utilizing its open-source capabilities for tasks such as raster processing, vector editing, and creating custom map styles. The flexibility and free nature of QGIS have made it an invaluable tool for various projects, particularly when budget limitations are a concern. My experience spans from basic data visualization and map creation to complex spatial modelling tasks, with examples including analyzing land use changes over time and creating detailed hydrological models.
Q 13. Explain your experience with data visualization techniques.
My experience in data visualization encompasses a wide range of techniques tailored to effectively communicate geospatial information. I’m proficient in creating various map types, including choropleth maps (showing data variation using color), dot density maps (representing point data density), and isopleth maps (showing lines of equal value). I’m also experienced with 3D visualization techniques and use of interactive web maps, which allow for more dynamic exploration of datasets.
For instance, I’ve developed interactive dashboards that allowed users to explore population density changes over time, layering demographic data with spatial context, creating easily-digestible information for various audiences. I also value using appropriate cartographic principles, selecting effective color schemes and symbols, and incorporating clear legends to enhance map readability and comprehension. The goal is always to select visualization methods that best communicate the data’s story to the intended audience.
Q 14. How do you handle errors and inconsistencies in geospatial data?
Handling errors and inconsistencies in geospatial data is critical for accurate analysis. My approach involves several steps:
- Data validation: Thorough checks for attribute errors (e.g., incorrect data types, inconsistent units) and spatial errors (e.g., overlapping polygons, gaps in lines). This often involves utilizing tools within GIS software to identify these inconsistencies automatically.
- Data cleaning: Employing data editing techniques to correct identified errors. This may involve manual editing of features or using scripting tools to automate error correction for large datasets.
- Data transformation: Converting data into a consistent format and coordinate system before analysis. This ensures compatibility and avoids inconsistencies that might arise from using data from different sources.
- Spatial analysis and error propagation: After cleaning, analysis techniques should consider and report on potential errors. For example, using buffer zones around features to account for uncertainties in their location.
- Metadata management: Creating and maintaining detailed metadata about the data, including its sources, accuracy, and any known limitations. This allows others to understand the data’s limitations and potential errors.
A real-world example: In a project involving land cover mapping, we discovered inconsistencies in polygon boundaries between different data layers. We applied a geometric error correction method, followed by manual editing, and careful documentation of the changes made in the metadata.
Q 15. Describe your experience with spatial analysis techniques.
Spatial analysis techniques are the heart of Geographic Information Systems (GIS), allowing us to extract meaning and insights from geographic data. I’m proficient in a range of techniques, from basic descriptive statistics to complex modeling. For example, I’ve extensively used spatial interpolation methods like Kriging to estimate values at unsampled locations, such as predicting rainfall across a region based on point measurements. Another crucial aspect of my work involves overlay analysis, where I combine different datasets – say, land use maps and elevation models – to identify areas suitable for specific purposes, like assessing flood risk in urban areas. I also have experience in network analysis, optimizing routes for delivery services or emergency response, utilizing tools to find the shortest paths or optimal flow networks. My skills extend to spatial autocorrelation analysis, identifying clustering patterns in data, helping to understand the spatial distribution of diseases or crime rates. Finally, I frequently leverage geostatistics to model and predict spatial variability in phenomena such as soil properties or air pollution.
Career Expert Tips:
- Ace those interviews! Prepare effectively by reviewing the Top 50 Most Common Interview Questions on ResumeGemini.
- Navigate your job search with confidence! Explore a wide range of Career Tips on ResumeGemini. Learn about common challenges and recommendations to overcome them.
- Craft the perfect resume! Master the Art of Resume Writing with ResumeGemini’s guide. Showcase your unique qualifications and achievements effectively.
- Don’t miss out on holiday savings! Build your dream resume with ResumeGemini’s ATS optimized templates.
Q 16. How do you ensure data accuracy and integrity in geospatial projects?
Data accuracy and integrity are paramount in geospatial projects. My approach is multi-faceted. First, I meticulously check the source of data, verifying its reliability and accuracy from credible organizations. For instance, I would prefer elevation data from a well-respected government agency over a less-verified source. Second, I perform rigorous quality control checks at every stage, employing techniques like data validation and error detection to identify outliers or inconsistencies. This might involve checking coordinate systems or ensuring attribute fields are correctly populated. Third, I use data cleaning techniques to address errors or inconsistencies. This could include correcting spatial errors or removing duplicate data points. I also leverage metadata extensively, carefully documenting data sources, processing steps, and any known limitations. Properly documented metadata is crucial for reproducibility and transparency, enabling future users to understand the data’s context and limitations. Lastly, using robust data management practices including version control ensures that the project maintains a clean and well-organized data structure and facilitates collaboration.
Q 17. Describe your experience with remote sensing data.
Remote sensing data plays a vital role in many of my projects. I have extensive experience working with various satellite imagery (Landsat, Sentinel) and aerial photography. I’m proficient in pre-processing techniques like geometric correction and atmospheric correction, ensuring data is accurate and ready for analysis. For example, in a recent project, I used Landsat imagery to monitor deforestation in the Amazon rainforest, utilizing image classification techniques to identify changes in land cover over time. This involved supervised classification where I trained the algorithm using labeled data to distinguish between forest and non-forest areas. I’ve also used remote sensing data to monitor changes in coastal erosion, creating time-series analysis to assess the rate of change along the coastline. Another key application involved multispectral image analysis for precision agriculture; analyzing spectral signatures from crop fields to assess plant health and yield prediction.
Q 18. Explain your experience working with different data formats (e.g., shapefiles, GeoTIFF).
Working with diverse data formats is a routine aspect of my work. I’m comfortable handling common geospatial formats like shapefiles (.shp, .shx, .dbf), which are excellent for vector data representing points, lines, and polygons, such as roads or buildings. I also regularly work with raster data formats like GeoTIFF (.tif), ideal for imagery and gridded data like elevation models. My experience extends to other formats like KML (.kml) for displaying geographic data in Google Earth, and GeoJSON (.geojson), a text-based format suitable for web mapping applications. Data format conversion is a common task, and I utilize GIS software to seamlessly translate between these formats as needed. Understanding the strengths and limitations of each format is key to choosing the most appropriate one for a particular task. For instance, shapefiles are great for storing spatial features, while GeoTIFFs are best for continuous surface data.
Q 19. How do you manage large geospatial datasets?
Managing large geospatial datasets requires strategic planning and the use of specialized tools. My approach begins with efficient data storage, leveraging cloud-based storage solutions like Amazon S3 or Google Cloud Storage, which offer scalable and cost-effective solutions. I also employ data compression techniques to reduce file sizes without significant loss of information. In terms of processing, I use parallel processing techniques and distributed computing frameworks like Hadoop or Spark to handle large datasets efficiently. Further, I make use of geospatial databases such as PostGIS, enabling optimized spatial queries and analysis. I employ techniques such as tiling and spatial indexing to improve query performance, significantly reducing processing time. For example, instead of loading an entire raster dataset into memory at once, I might process it in tiles, allowing analysis on smaller, more manageable chunks.
Q 20. Describe your experience with spatial databases.
Spatial databases are indispensable for managing and analyzing large geospatial datasets. I’ve extensively used PostGIS, an open-source spatial extension for PostgreSQL. PostGIS allows for efficient storage and retrieval of geographic data, enabling complex spatial queries. For example, I’ve used PostGIS to identify all buildings within a specific distance of a proposed highway, using spatial functions like ST_DWithin. I also use spatial databases to manage attribute data associated with geographic features, creating relationships and enabling powerful data analysis capabilities. The ability to perform spatial joins and spatial aggregations within the database environment significantly improves efficiency compared to processing large datasets in a desktop GIS environment. My experience includes designing and implementing spatial database schemas, optimizing query performance, and integrating spatial databases into larger data analysis workflows.
Q 21. Explain your experience with creating maps and cartographic products.
Creating clear, effective maps and cartographic products is crucial for communicating spatial information. I’m proficient in using GIS software like ArcGIS and QGIS to produce various map types, from thematic maps showing spatial patterns of a particular variable to topographic maps depicting elevation. My work includes selecting appropriate map projections, defining symbology, and designing map layouts that effectively convey the information to the target audience. I pay close attention to cartographic principles like visual hierarchy and color selection to make maps easily understandable. For example, I’ve developed interactive web maps using tools like Leaflet and OpenLayers, enabling users to explore data dynamically. In a recent project, I created a series of maps illustrating the impact of climate change on coastal communities, incorporating elements like elevation models, flood zones, and population density to clearly communicate the risks involved. I strive to create maps that are not just visually appealing but also accurate, informative, and easily understood.
Q 22. How do you communicate complex geospatial information to a non-technical audience?
Communicating complex geospatial information to a non-technical audience requires translating technical jargon into everyday language and utilizing visual aids effectively. Instead of using terms like ‘georeferencing’ or ‘spatial autocorrelation,’ I would explain the core concept in a simpler way. For example, instead of saying ‘The spatial autocorrelation analysis revealed clustering of high-poverty areas,’ I might say, ‘Our analysis showed that areas with high poverty tend to be grouped together.’
I rely heavily on visual representations like maps, charts, and infographics. A well-designed map, for instance, can instantly communicate patterns and relationships that would take pages of text to explain. I often use analogies to bridge the gap between technical concepts and everyday experiences. For example, to explain the concept of a geographic information system (GIS), I might compare it to a layered map, where each layer represents a different type of information (roads, buildings, population density). Interactive elements, such as demonstrations or simulations, also greatly enhance understanding.
Finally, active listening and tailoring my communication style to the audience are critical. I ensure I understand their background and adjust the complexity of my explanation accordingly. Asking questions and incorporating feedback during the presentation helps ensure comprehension and engagement.
Q 23. Describe a time you had to troubleshoot a navigation or mapping problem.
During a project involving the creation of a hiking trail map, we encountered a significant discrepancy between the GPS data collected and the actual terrain. The GPS coordinates showed a trail section traversing a steep cliff face, clearly impossible. Initial troubleshooting focused on verifying the GPS data’s accuracy, checking for signal interference, and reviewing the data collection methodology. We found no errors in the procedures.
The problem was resolved by examining high-resolution aerial imagery. We discovered that the trail had been recently rerouted due to landslides, and the GPS data was outdated. The solution involved updating the trail route on the map based on the aerial imagery and conducting a ground survey to verify the new route’s accuracy. This experience reinforced the importance of using multiple data sources and verifying information through multiple methods, especially when dealing with dynamic environments.
Q 24. What are some common challenges in geographic orientation and navigation?
Geographic orientation and navigation present several challenges, particularly in complex or dynamic environments. One common issue is the accuracy of data. GPS signals can be unreliable in areas with dense foliage, tall buildings, or atmospheric interference. Data from different sources may also have inconsistencies, requiring careful integration and validation.
Another significant challenge is interpreting and visualizing geographic data effectively. Large datasets can be overwhelming, and presenting them clearly and concisely requires significant skill. Furthermore, the ever-changing nature of geography – due to construction, natural disasters, or even simple vegetation growth – requires continuous updating of maps and navigation systems. Finally, human factors such as fatigue, stress, and poor decision-making can also contribute to errors in navigation and orientation.
Q 25. How do you stay up-to-date with advancements in geospatial technology?
Staying current in geospatial technology involves a multi-faceted approach. I regularly attend conferences and workshops, such as those organized by the GIS user groups, to learn about the latest software, techniques, and research. This provides an opportunity to network with other professionals and learn about their experiences. I actively participate in online communities and forums, engaging in discussions and sharing knowledge with peers.
Professional journals, like the ‘Journal of Spatial Science’, and reputable online resources are invaluable for staying informed about new developments and research findings. I also subscribe to newsletters and podcasts dedicated to GIS and related fields. Furthermore, I actively seek out online courses and tutorials to improve my skills with new software and techniques. This continuous learning approach ensures I remain at the forefront of the field.
Q 26. Describe your proficiency with relevant software and tools.
My proficiency encompasses a wide range of software and tools commonly used in geographic orientation and navigation. I’m highly skilled in GIS software such as ArcGIS Pro and QGIS, proficient in using various spatial analysis techniques like overlay analysis, proximity analysis, and network analysis within these platforms. My expertise also extends to remote sensing software such as ENVI and ERDAS Imagine for processing satellite and aerial imagery. Furthermore, I am skilled in using programming languages such as Python with libraries like GDAL and GeoPandas for automating geospatial tasks and developing custom solutions. I’m also comfortable using GPS devices and related software for data collection and processing.
Q 27. What is your experience with different mapping software (ArcGIS, QGIS, Google Earth)?
I have extensive experience with ArcGIS, QGIS, and Google Earth, each serving distinct purposes. ArcGIS is my primary platform for large-scale, complex geospatial analysis, offering a robust suite of tools for data management, analysis, and visualization. QGIS, an open-source alternative, is equally useful for many tasks, and I use it for specific projects where cost-effectiveness is critical or when dealing with large datasets. Google Earth excels in its visualization capabilities, particularly for presenting data to non-technical audiences and for quick exploratory analysis. The choice of software depends on the project’s specific needs and requirements, as well as the available resources.
Q 28. How would you approach creating a route plan in an unfamiliar environment?
Creating a route plan in an unfamiliar environment requires a systematic approach. First, I would gather available map data using sources like online mapping services (Google Maps, OpenStreetMap), paper maps, or specialized navigation apps. If possible, I’d leverage any available topographic data to assess the terrain’s features (elevation changes, obstacles).
Next, I would identify the start and end points and determine the most suitable route based on factors like distance, terrain difficulty, safety, and accessibility. This might involve considering multiple options and weighing their pros and cons. I would utilize tools like route-planning software or even manually plot a route on the map, paying attention to potential hazards and challenges along the way. Finally, I would verify my chosen route using multiple data sources if possible and ensure I have backup plans or alternative routes to account for unexpected events. Carrying offline map data and a GPS device with sufficient battery life are always essential precautions.
Key Topics to Learn for Geographic Orientation and Navigation Interview
- Map Projections and Coordinate Systems: Understanding different map projections (e.g., Mercator, UTM) and their implications for distance, area, and shape calculations. Practical application: Analyzing geographic data from various sources and ensuring accuracy in spatial analysis.
- GPS Technology and Principles: How GPS receivers work, understanding signal acquisition, triangulation, and error sources (e.g., atmospheric effects, multipath). Practical application: Evaluating the accuracy and reliability of GPS data in different environments and using appropriate error correction techniques.
- Spatial Data Handling and Analysis: Working with GIS software (e.g., ArcGIS, QGIS), performing spatial queries, geoprocessing, and data visualization. Practical application: Creating maps, analyzing spatial relationships between features, and extracting meaningful insights from geographic data.
- Navigation Techniques and Methods: Traditional navigation methods (e.g., compass, map reading), modern navigation tools (e.g., GPS, inertial navigation systems), and understanding their limitations and strengths. Practical application: Planning routes, estimating travel times, and navigating in various environments (e.g., urban, wilderness).
- Cartography and Map Design: Principles of effective map design, symbolization, and communication of spatial information. Practical application: Creating clear and informative maps for diverse audiences and purposes.
- Geographic Information Systems (GIS) Applications: Understanding the application of GIS in different fields (e.g., environmental management, urban planning, transportation). Practical application: Demonstrating familiarity with real-world applications and problem-solving using GIS.
Next Steps
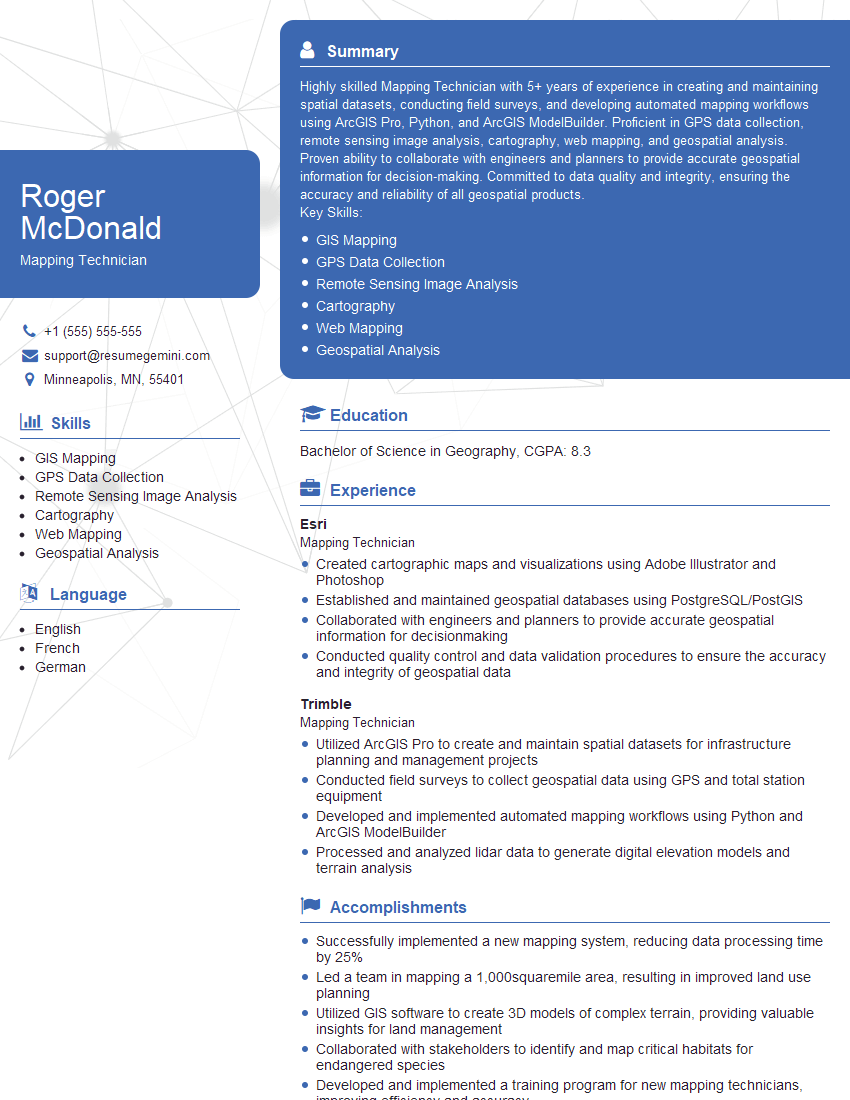
Mastering Geographic Orientation and Navigation is crucial for career advancement in many exciting fields, offering opportunities for innovation and problem-solving. A strong understanding of these concepts significantly improves your candidacy and opens doors to a wider range of roles. To boost your job prospects, focus on creating an ATS-friendly resume that highlights your skills and experience effectively. ResumeGemini is a trusted resource that can help you build a professional and impactful resume tailored to your specific field. Examples of resumes tailored to Geographic Orientation and Navigation are available to guide you through the process.
Explore more articles
Users Rating of Our Blogs
Share Your Experience
We value your feedback! Please rate our content and share your thoughts (optional).
What Readers Say About Our Blog
Hi, I have something for you and recorded a quick Loom video to show the kind of value I can bring to you.
Even if we don’t work together, I’m confident you’ll take away something valuable and learn a few new ideas.
Here’s the link: https://bit.ly/loom-video-daniel
Would love your thoughts after watching!
– Daniel
This was kind of a unique content I found around the specialized skills. Very helpful questions and good detailed answers.
Very Helpful blog, thank you Interviewgemini team.
