The thought of an interview can be nerve-wracking, but the right preparation can make all the difference. Explore this comprehensive guide to Hampson-Russell interview questions and gain the confidence you need to showcase your abilities and secure the role.
Questions Asked in Hampson-Russell Interview
Q 1. Explain the concept of pre-stack seismic inversion.
Pre-stack seismic inversion is a powerful technique used to estimate rock properties directly from seismic data before the data is stacked. Unlike post-stack inversion, which uses already summed seismic traces, pre-stack inversion leverages the amplitude variations with offset (AVO) information present in the individual pre-stack seismic gathers. This allows for a more accurate and detailed characterization of reservoir properties, especially in distinguishing between different lithologies with similar acoustic impedances.
Imagine you’re trying to understand the contents of a box by listening to the sound it makes when you hit it from different angles and distances. Pre-stack inversion is akin to analyzing the variations in sound based on the angle and distance of your hits, giving you a much richer understanding than just hearing a single averaged sound (post-stack). The AVO analysis inherently provides information on the elastic properties of the subsurface, giving us a better handle on things like porosity and fluid saturation.
In practice, pre-stack inversion involves sophisticated algorithms that use seismic reflectivity equations and well log data to estimate parameters such as P-wave impedance, S-wave impedance, and density. These are then used to predict other reservoir properties. Hampson-Russell provides robust tools for performing these complex calculations and incorporating uncertainties.
Q 2. Describe the different types of seismic attributes and their applications.
Seismic attributes are quantitative measurements derived from seismic data that enhance the interpretation of subsurface features. They provide additional information beyond the basic seismic amplitude and travel time. There are countless types, but some key ones are:
- Amplitude attributes: These include instantaneous amplitude, RMS amplitude, and various measures of energy. They are useful for identifying bright spots (potential hydrocarbon indicators) or identifying zones of differing lithology.
- Frequency attributes: These describe the frequency content of the seismic signal, like dominant frequency and spectral decomposition. Changes in frequency can indicate changes in rock properties or fluid content.
- Geometric attributes: These include things like curvature (describing the shape of the reflector) and dip (describing the slope of the reflector). These are crucial for identifying faults, channels, and other geological features.
- AVO attributes: These are derived from the pre-stack seismic data and quantify the changes in reflectivity as a function of offset. They are extremely useful in identifying hydrocarbon reservoirs.
Applications: Attributes are applied in various stages of reservoir characterization: from identifying potential prospects during exploration to mapping fluid contacts and reservoir boundaries during development and production. For instance, curvature attributes can help delineate subtle fault systems, while AVO attributes help differentiate between gas-saturated and water-saturated sands.
Q 3. How do you use Hampson-Russell software for AVO analysis?
Hampson-Russell’s software provides comprehensive tools for AVO analysis. It typically starts with importing the pre-stack seismic gathers and well log data. The workflow often involves these steps:
- AVO pre-processing: This involves correcting for various effects like statics, multiple reflections, and noise to improve the quality of the seismic data before the AVO analysis.
- AVO modeling: This step involves creating synthetic seismograms based on well log data and rock physics models. This helps to calibrate the seismic data to known reservoir properties.
- AVO analysis: Using different AVO techniques (e.g., crossplot analysis, fluid factor analysis), we analyze the pre-stack gathers to identify AVO anomalies, which could indicate the presence of hydrocarbons.
- AVO inversion: This process is often used to extract quantitative information about rock properties (e.g., P-impedance, S-impedance, density) directly from the pre-stack data, providing more detailed reservoir characterization.
- Uncertainty analysis: Assessing the uncertainties associated with the AVO analysis results is crucial for decision-making. Hampson-Russell’s software provides tools for quantifying the uncertainty in AVO parameters.
For example, a crossplot of the near-offset and far-offset amplitudes can reveal trends associated with different lithologies or fluid types, allowing for identification of potential hydrocarbon reservoirs. Hampson-Russell’s intuitive interface makes these complex tasks easier to perform.
Q 4. What are the key steps involved in building a reservoir model using Hampson-Russell?
Building a reservoir model in Hampson-Russell typically involves a workflow integrating seismic data, well log data, and geological information. Key steps include:
- Data integration and preprocessing: This includes importing seismic data, well logs (density, porosity, sonic, etc.), and geological maps. Data quality control and necessary preprocessing steps (e.g., noise reduction, corrections) are crucial.
- Seismic interpretation: This is where horizons, faults, and other geological features are interpreted and mapped on the seismic data. This forms the structural framework of the reservoir model.
- Petrophysical analysis: We derive relationships between seismic attributes and reservoir properties (porosity, water saturation, permeability) from well log data. This is crucial for linking the seismic data to the reservoir properties.
- Seismic inversion: Pre-stack or post-stack inversion (as discussed earlier) transforms seismic data into rock property volumes (impedance, density).
- Geostatistical modeling: This step uses geostatistical techniques to generate a 3D reservoir model honoring the well data and the inverted seismic volumes, handling the spatial variability in reservoir properties.
- Model validation and uncertainty quantification: This involves comparing the model’s predictions to available data (e.g., production data) to ensure the model’s reliability and quantifying the uncertainties inherent in the model.
Hampson-Russell provides the tools to manage and analyze all these data types, streamlining the entire workflow and enabling accurate and comprehensive reservoir modeling.
Q 5. Explain the difference between deterministic and stochastic reservoir modeling.
Deterministic and stochastic reservoir modeling represent different approaches to handling the uncertainties associated with subsurface characterization.
Deterministic modeling assumes that all parameters are known with certainty. It relies on direct measurements and interpretations to create a single, most likely model of the reservoir. It’s like creating a detailed blueprint of a house, based on exact measurements and plans. The resulting model is highly detailed but does not explicitly represent the uncertainties in our knowledge of the subsurface.
Stochastic modeling acknowledges that there are inherent uncertainties associated with subsurface properties. It uses statistical methods and probability distributions to create multiple realizations of the reservoir model, each representing a plausible scenario. This is like designing multiple plausible layouts for a house based on the same set of constraints and some probability distributions for unknown details such as room sizes. The result is a range of possible outcomes, each with its own probability, rather than a single deterministic model. It’s particularly useful in areas with limited well control.
In practice, a combination of deterministic and stochastic approaches is often employed. Deterministic modeling provides a baseline model, while stochastic modeling accounts for the inherent uncertainties.
Q 6. How do you handle uncertainty in reservoir characterization?
Uncertainty in reservoir characterization is inherent due to the limited amount of subsurface data we can obtain. Hampson-Russell offers several ways to address this:
- Geostatistical methods: These methods incorporate the spatial variability of reservoir properties and account for uncertainty through multiple model realizations (as seen in stochastic modeling).
- Monte Carlo simulations: These simulations use random sampling to generate multiple models based on probability distributions for uncertain parameters. This provides a range of possible outcomes and quantifies the probability associated with each.
- Rock physics modeling: Incorporating rock physics models helps to reduce uncertainty by linking seismic attributes to reservoir properties more realistically.
- Sensitivity analysis: This technique assesses the impact of uncertainties in input parameters on the model’s predictions. It helps to identify parameters that significantly influence the results, allowing for focused data acquisition or improved modeling techniques.
By systematically addressing and quantifying uncertainty, we can make more informed decisions regarding reservoir management and development strategies.
Q 7. Describe your experience with seismic data processing and interpretation.
My experience encompasses the entire seismic data processing and interpretation workflow. I’m proficient in various seismic processing techniques, including:
- Pre-processing: Noise attenuation (random, coherent), multiple attenuation, deconvolution, velocity analysis, and statics correction.
- Seismic imaging: Migration (Kirchhoff, F-K, RTM), improving the accuracy of subsurface imaging.
- Seismic interpretation: Horizon picking, fault interpretation, structural modeling, using various seismic attributes for detailed reservoir characterization.
I have practical experience using industry-standard software packages, including Hampson-Russell and others, for both processing and interpretation. I can effectively manage large datasets, perform quality control, and troubleshoot processing challenges. I have worked on diverse projects spanning various geological settings and have contributed to successful exploration and development projects through accurate and insightful seismic interpretations. A recent project involved interpreting 3D seismic data in a complex carbonate reservoir, using a combination of seismic attributes and AVO analysis to successfully delineate reservoir boundaries and identify potential drilling locations. This resulted in a significant reduction in exploration risk and increased production efficiency.
Q 8. Explain your understanding of different rock physics models used in Hampson-Russell.
Hampson-Russell offers a suite of rock physics models crucial for bridging the gap between seismic data and reservoir properties. These models describe the relationship between the elastic properties of rocks (e.g., P-wave and S-wave velocities, density) and their petrophysical properties (e.g., porosity, saturation, lithology). Understanding these relationships is fundamental for accurate seismic interpretation and reservoir characterization.
- Empirical Models: These models rely on established relationships derived from well log data. A common example is the Wyllie time-average equation, which relates P-wave velocity to porosity. These are easy to implement but might lack accuracy if the underlying assumptions (e.g., homogenous rock composition) are violated.
- Theoretical Models: These models are based on the physics of wave propagation in porous media. Examples include the Gassmann equation (for fluid substitution), the Biot-Gassmann equation (incorporating frame moduli), and various effective medium theories (e.g., Hashin-Shtrikman bounds). These offer more physical insights but often require more input parameters and can be computationally intensive.
- Hybrid Models: These combine aspects of empirical and theoretical models, leveraging the strengths of both. They often involve calibrating theoretical models to well log data to improve accuracy.
For example, in a clastic reservoir, I might use the Gassmann equation to predict velocity changes due to variations in fluid saturation, while calibrating it with empirical relationships derived from nearby wells to account for specific rock matrix properties. The choice of model depends heavily on the data quality and the specific geological setting.
Q 9. How do you integrate well log data with seismic data in Hampson-Russell?
Integrating well log and seismic data in Hampson-Russell is a cornerstone of reservoir characterization. This integration typically involves several steps:
- Well Log Conditioning and Editing: This involves checking for errors, removing spurious data points, and potentially interpolating missing values.
- Rock Physics Analysis: This establishes the link between well log properties and seismic attributes using rock physics models (as discussed in the previous answer). Crossplots and regression analyses are used to identify key relationships.
- Seismic Pre-processing and Attribute Extraction: Seismic data undergoes various processing steps to enhance signal quality. Relevant seismic attributes (e.g., amplitude, frequency, impedance) are then extracted.
- Pre-stack or Post-stack Seismic Inversion: This uses the established rock physics relationships to predict reservoir properties from seismic data. Pre-stack inversion utilizes more information from the seismic data (angle-dependent reflectivity) but is more complex. Post-stack inversion is simpler, but information is reduced.
- Seismic Attribute Modeling: This involves generating 3D models of key reservoir properties (e.g., impedance, porosity, saturation) using geostatistical techniques.
- Well-to-Seismic Tie: Comparing the well log derived properties with those predicted from seismic data helps to validate the inversion and the rock physics model.
For instance, I’ve worked on projects where we used impedance inversion in Hampson-Russell, followed by a deterministic or stochastic modeling step, to create a 3D model of porosity based on the integration of sonic, density logs, and seismic data. The accuracy of this 3D model was crucial for evaluating reservoir potential and production planning.
Q 10. Describe your experience with geostatistical techniques.
My experience with geostatistical techniques within Hampson-Russell is extensive. These techniques are critical for creating realistic 3D models of reservoir properties from limited well data. The software provides tools for several methods:
- Kriging: A powerful interpolation technique that accounts for spatial correlation in data. Ordinary kriging is commonly used, but other variations (e.g., universal kriging) can be applied to incorporate external data.
- Sequential Gaussian Simulation (SGS): A stochastic method that generates multiple equiprobable realizations, capturing the uncertainty inherent in the prediction. This helps in risk assessment and decision-making.
- Conditional Simulation: Techniques like SGS allow for honouring the well data while generating multiple plausible models that capture the geological variability in the reservoir.
In a real-world example, I used SGS within Hampson-Russell to create multiple realizations of porosity distribution in a carbonate reservoir. By analyzing the range of possible porosity values at specific locations, I was able to assess the uncertainty associated with production forecasts and optimize well placement strategies.
Q 11. What are the limitations of seismic inversion?
Seismic inversion, while a powerful tool, has limitations:
- Non-uniqueness: Multiple earth models can produce similar seismic responses, leading to ambiguous interpretations. This is particularly true in areas with complex geology or limited well control.
- Resolution Limits: Seismic data inherently has limited resolution, which restricts the detail that can be resolved in the inverted models. Fine-scale heterogeneities within the reservoir may be smoothed out during the inversion process.
- Assumption Dependence: The accuracy of seismic inversion is strongly dependent on the assumptions made about the rock physics model and the subsurface geology. Incorrect assumptions can lead to significant errors in the results.
- Data Quality: The success of seismic inversion heavily relies on the quality of the seismic data. Noise, multiples, and other artifacts can significantly affect the accuracy of the inversion.
- Computational Cost: Advanced inversion techniques, especially pre-stack methods, can be computationally expensive, requiring significant processing power and time.
For example, in a complex subsalt environment, the high-frequency content of the seismic data might be attenuated due to absorption and scattering effects, limiting the ability to accurately resolve thin reservoir layers.
Q 12. How do you assess the quality of seismic data?
Assessing seismic data quality is crucial for the success of any seismic interpretation workflow. This involves examining various aspects of the data:
- Signal-to-Noise Ratio (SNR): A high SNR indicates a strong signal relative to the background noise, leading to more reliable interpretations.
- Frequency Content: Higher frequencies provide better resolution but are often more attenuated. Analyzing the frequency content helps to understand the resolution limits of the data.
- Multiple Reflections: These are unwanted reflections that can interfere with primary reflections and complicate interpretation. Identifying and attenuating multiples is important.
- Pre-processing Quality: Evaluating the quality of pre-processing steps, including deconvolution, noise attenuation, and velocity analysis, is essential to ensure the data are fit for use.
- Consistency Checks: Checking for consistency between different seismic datasets (e.g., from different surveys or different processing flows) helps to identify potential problems.
I routinely use Hampson-Russell’s visualization tools to examine seismic gathers, sections, and attributes to assess data quality. For instance, I would analyze velocity gathers to identify areas with poor velocity analysis and examine common-midpoint (CMP) gathers to detect the presence of noise or multiples before proceeding with further analysis.
Q 13. Explain your experience with different types of seismic surveys (e.g., 3D, 4D).
My experience encompasses various seismic survey types, each with its strengths and limitations:
- 3D Seismic Surveys: These provide a detailed three-dimensional image of the subsurface, allowing for better spatial resolution and a more comprehensive understanding of the reservoir geometry. Hampson-Russell provides tools for visualizing and analyzing 3D seismic data, including attributes and inversion results.
- 4D Seismic Surveys (Time-lapse): These involve acquiring multiple seismic surveys over time to monitor changes in the reservoir caused by production or injection. Hampson-Russell helps analyze these changes to optimize reservoir management strategies by quantifying differences between surveys.
In one project, we used 3D seismic data to map a fault system that impacted reservoir connectivity. In another, 4D seismic data in Hampson-Russell revealed changes in fluid saturation associated with water injection, providing valuable insights for optimizing the enhanced oil recovery process.
Q 14. How do you use Hampson-Russell to perform reservoir simulation?
Hampson-Russell itself doesn’t directly perform reservoir simulation in the same way as dedicated reservoir simulation software (e.g., Eclipse, CMG). However, it plays a crucial role in providing the essential input data for these simulations. The results from seismic inversion, geostatistical modeling, and rock physics analysis in Hampson-Russell are frequently used to create:
- Property Models: Detailed 3D models of reservoir properties (porosity, permeability, saturation) are generated using the tools available in Hampson-Russell. These models serve as essential inputs for reservoir simulators.
- Geological Models: Hampson-Russell helps to create detailed geological models, including fault networks and stratigraphic layers, that are crucial for representing the reservoir’s geometry and connectivity in the simulator.
Therefore, Hampson-Russell acts as a vital pre-processing step, generating high-quality input models that significantly improve the accuracy and reliability of reservoir simulations. In my experience, I’ve used Hampson-Russell to create these input models, then imported them into dedicated reservoir simulation software for the production forecasting and optimization stages.
Q 15. Describe your experience with different types of well logs and their interpretation.
My experience with well logs encompasses a wide range of log types, including but not limited to density, neutron, sonic, resistivity, gamma ray, and nuclear magnetic resonance (NMR) logs. Understanding these logs is crucial for reservoir characterization. Each log provides unique insights into the subsurface. For example, the gamma ray log helps identify shale content, a key indicator of reservoir quality. Density and neutron logs are used to estimate porosity, a critical parameter for calculating hydrocarbon volume. Resistivity logs measure the ability of the formation to conduct electricity, which is directly related to the presence and type of fluids. Sonic logs measure the speed of sound waves through the formation and are used to estimate porosity and lithology. Finally, NMR logs provide detailed information about pore size distribution and fluid properties. My interpretation process usually involves a visual inspection of individual logs, cross-plotting various logs to identify relationships, and using established empirical relationships and petrophysical models to quantify reservoir parameters.
In a recent project, I utilized a combination of density, neutron, and resistivity logs to delineate a heterogeneous sandstone reservoir. By cross-plotting density-neutron and density-resistivity, I was able to identify zones with different porosity and water saturation values, leading to a refined reservoir model. The understanding of the log response and their limitations allowed for a more accurate reservoir characterization and ultimately, a more effective development plan.
Career Expert Tips:
- Ace those interviews! Prepare effectively by reviewing the Top 50 Most Common Interview Questions on ResumeGemini.
- Navigate your job search with confidence! Explore a wide range of Career Tips on ResumeGemini. Learn about common challenges and recommendations to overcome them.
- Craft the perfect resume! Master the Art of Resume Writing with ResumeGemini’s guide. Showcase your unique qualifications and achievements effectively.
- Don’t miss out on holiday savings! Build your dream resume with ResumeGemini’s ATS optimized templates.
Q 16. Explain the concept of porosity and permeability and how they are estimated.
Porosity is the fraction of the total rock volume that is void space (pores), while permeability is the ability of a rock to allow fluids to flow through its interconnected pore network. Both are crucial for hydrocarbon exploration and production. Porosity is typically estimated from well logs such as density, neutron, and sonic logs using established empirical relationships. For instance, the density porosity is calculated using the formula: ΦD = (ρma - ρb) / (ρma - ρfl) where ρma is the matrix density, ρb is the bulk density (from density log), and ρfl is the fluid density. Permeability, on the other hand, is more challenging to directly measure from logs and often requires core analysis data or empirical correlations between porosity and permeability derived from core data. We often use relationships like the Kozeny-Carman equation, but its accuracy depends heavily on the pore geometry and needs calibration with core data.
In my experience, accurate estimation requires a good understanding of the rock type and its properties. For example, a tight sandstone will have lower porosity and permeability compared to a well-consolidated limestone. I often integrate well log data with core analysis data to improve the accuracy of porosity and permeability estimations. This process is crucial to building realistic reservoir models.
Q 17. How do you use Hampson-Russell to create a facies model?
Hampson-Russell provides powerful tools for facies modeling using well log data and seismic data. The process typically involves several steps. First, we define the different facies based on the geological understanding of the reservoir. Then, we use well log data to create training images or build statistical models that characterize each facies based on its petrophysical properties (porosity, permeability, water saturation etc.). Key to this step is careful log editing and selection of meaningful attributes. Hampson-Russell’s neural networks and statistical methods, like discriminant analysis and clustering techniques are employed to analyze this data.
Next, seismic data are incorporated using seismic attributes (e.g., amplitude, frequency, and coherence) that correlate with the petrophysical properties. Hampson-Russell facilitates this using tools for seismic-well tie and seismic inversion. Finally, a geostatistical algorithm, like sequential Gaussian simulation or simulated annealing, is used to build a 3D facies model that honors the well log data and seismic information. The resulting 3D facies model provides a spatial representation of the different rock types in the reservoir, improving our understanding of the reservoir heterogeneity.
For instance, in a recent project, we used Hampson-Russell to model a fluvial reservoir with multiple facies (channel sand, floodplain mudstone, etc.). We used well logs to define the petrophysical properties of each facies and seismic attributes to map the spatial distribution of the facies across the reservoir. The resulting facies model significantly improved the accuracy of our reservoir simulation and production forecast.
Q 18. Explain your understanding of different types of fluid identification techniques.
Fluid identification techniques aim to determine the type and saturation of fluids present in a reservoir. This is essential for reservoir management and production optimization. Several techniques can be employed, broadly classified into direct and indirect methods. Direct methods involve obtaining fluid samples from the reservoir, which offers the most accurate data but is often expensive and may not be feasible in all cases. Indirect methods rely on analyzing well log data. Resistivity logs, for example, are commonly used to infer water saturation, with higher resistivity indicating lower water saturation. NMR logs provide detailed information about pore size distribution and fluid properties, allowing for more detailed fluid type identification.
In addition to resistivity and NMR, we also use techniques based on elastic properties derived from seismic data. Changes in P-wave and S-wave velocities, as well as density, can indicate the presence of hydrocarbons. Hampson-Russell’s tools allow us to integrate these different datasets to improve fluid identification. In practice, I typically employ a multi-attribute approach combining well log and seismic data to minimize uncertainty and improve the reliability of fluid identification.
For example, in a gas reservoir, a combination of high resistivity and low density logs would strongly suggest the presence of gas, corroborated by seismic analysis revealing velocity anomalies. This integrated approach is far superior to relying on a single data source.
Q 19. How do you validate your reservoir models?
Reservoir model validation is a critical step to ensure the accuracy and reliability of the model. It involves comparing the model predictions with independent data not used in building the model. The most common method is to compare the model predictions of production performance (e.g., oil/gas rates, pressure, water cut) with historical production data. If the model accurately reproduces past performance, it builds confidence in its predictive capabilities. Additionally, 4D seismic data, if available, provides an independent measure of reservoir changes over time which can be compared to the dynamic model’s predictions.
Other validation techniques include comparing the model’s predictions with production logging tool (PLT) data, core analysis data, and pressure transient tests. The degree of match between the model predictions and the independent data provides a measure of model accuracy. Discrepancies should be investigated to understand their causes and potentially improve the model. In Hampson-Russell, model validation is frequently done using their visualization tools, which helps us see any discrepancies spatially, leading to a better understanding of the reasons behind them and guiding further refinement.
Q 20. What is your experience with history matching?
History matching is the process of adjusting reservoir model parameters to match historical production data. It involves iteratively modifying parameters such as permeability, porosity, and fluid properties until the model accurately reproduces the observed production history. This is a critical step in building a reliable reservoir model capable of predicting future production. Hampson-Russell provides tools to facilitate this process through automated optimization algorithms and visualization tools.
In my experience, I have used both manual and automated history matching techniques. Manual history matching involves systematically adjusting model parameters and evaluating the impact on production matches. Automated history matching uses optimization algorithms to automatically adjust parameters and minimize the difference between observed and simulated production data. This process frequently involves dealing with uncertainty and exploring multiple scenarios, which Hampson-Russell tools can greatly assist with.
A successful history match not only ensures the model accurately represents the past but also builds confidence in its predictive capabilities for future production scenarios.
Q 21. Describe your experience with uncertainty quantification.
Uncertainty quantification is crucial in reservoir modeling because of the inherent uncertainties associated with the data and the models themselves. It involves assessing the range of possible outcomes and their probabilities. In reservoir modeling, uncertainty stems from several sources: data uncertainty (e.g., errors in well log measurements, limited well control), model uncertainty (e.g., simplifications in the reservoir model, assumptions about the geological model), and parameter uncertainty (e.g., uncertainty in permeability and porosity values). Hampson-Russell offers several tools to quantify this uncertainty.
We commonly use Monte Carlo simulations, where we run multiple reservoir simulations using different parameter sets sampled from probability distributions reflecting the uncertainty in the input parameters. This allows us to obtain a range of possible production scenarios and their probabilities. We can then use this information to assess the risk associated with various reservoir development plans. Sensitivity analysis helps us identify the most influential parameters, allowing for a more focused uncertainty reduction effort. By understanding and quantifying the uncertainties, we can make more informed decisions regarding reservoir management and development.
For example, I used a Monte Carlo simulation in a recent project to assess the uncertainty in ultimate recoverable reserves due to uncertainty in permeability. The results showed a wide range of possible ultimate recoveries, highlighting the need for further data acquisition to reduce the uncertainty.
Q 22. What are the challenges in integrating different data types in reservoir characterization?
Integrating diverse data types in reservoir characterization, a core function within Hampson-Russell, presents significant challenges. The problem stems from the inherent differences in data resolution, acquisition methods, and the physical properties they represent. For instance, seismic data provides a large-scale view of subsurface structures, while well logs offer high-resolution measurements at specific locations. Integrating these necessitates careful consideration of scale and uncertainty.
- Data Resolution Discrepancies: Seismic data is typically lower resolution than well log data. Bridging this gap requires sophisticated upscaling or downscaling techniques to maintain consistency and avoid introducing artifacts. For example, seismic attributes might need to be upscaled to match the coarser grid of a geological model.
- Data Uncertainty: Each data type carries uncertainty. Seismic data is affected by noise and processing artifacts, while well logs can be impacted by borehole effects. A robust integration workflow needs to account for and quantify these uncertainties, perhaps using Bayesian methods or Monte Carlo simulations.
- Data Types and their Properties: Integrating data involves understanding the relationships between different properties. For example, how does porosity from well logs relate to seismic impedance? This often requires careful calibration and use of rock physics models to transform data into a consistent framework.
- Spatial Variability: Heterogeneity in subsurface geology means that the relationship between different data types can vary significantly across the reservoir. Accounting for this requires sophisticated techniques such as geostatistics and stochastic modeling.
In Hampson-Russell, we address these challenges using tools that allow for pre-processing, quality control, and sophisticated geostatistical methods to integrate data types while explicitly accounting for uncertainties. We leverage tools such as seismic inversion, rock physics modeling, and geostatistical simulation to create a comprehensive and realistic reservoir model.
Q 23. How do you handle noisy or incomplete data in Hampson-Russell?
Noisy or incomplete data is a reality in any reservoir characterization project. Hampson-Russell offers a suite of tools to mitigate these issues. We employ a multi-pronged approach focusing on data pre-processing, robust algorithms, and uncertainty quantification.
- Data Pre-processing: This involves cleaning the data using various techniques. For instance, we might apply filters to remove noise from seismic data or use editing tools to correct obvious errors in well logs. Specific Hampson-Russell modules are designed for these tasks.
- Robust Algorithms: We utilize algorithms that are less sensitive to noise and outliers. For example, using robust statistical methods for calculating seismic attributes or employing regularization techniques in inversion workflows minimizes the impact of noisy data.
- Imputation Techniques: For missing data, we employ various imputation methods, such as kriging or co-kriging, to estimate values based on the surrounding data. The choice of method depends on the data type and the spatial correlation structure.
- Uncertainty Quantification: We explicitly incorporate uncertainty into our workflows. Stochastic simulations are used to generate multiple reservoir models, each reflecting a plausible range of values, given the uncertainties associated with the input data. This allows us to assess the impact of noisy or incomplete data on the overall reservoir characterization.
For example, dealing with missing well log data in a specific zone, we might use kriging to interpolate values based on neighboring wells, understanding the limitations and uncertainty introduced by this interpolation. We would then propagate this uncertainty through subsequent modelling steps.
Q 24. Describe your experience with different types of visualization techniques.
My experience with visualization techniques is extensive and spans various types of data representation. In Hampson-Russell projects, we use a combination of 2D and 3D visualization tools to effectively communicate subsurface information.
- 2D Cross-Plots: These are invaluable for understanding relationships between different petrophysical properties (e.g., porosity vs. permeability) and for identifying trends and clusters in the data.
- 3D Visualization: Hampson-Russell provides powerful 3D visualization capabilities for viewing reservoir models, seismic data, and other geological information. This includes volume rendering, surface mapping, and interactive exploration of the model.
- Seismic Section Displays: Standard displays of seismic sections, including amplitude, phase, and other attributes, are crucial for interpreting seismic data and integrating it with other information. Specific attribute slices and 3D visualizations significantly aid in feature identification.
- Well Log Displays: Interactive log displays are crucial for evaluating well data, identifying key lithologic units, and correlating the data between wells.
- Interactive Map Displays: Creating maps showing spatial distribution of reservoir properties (e.g., porosity, permeability, saturation) allows for a quick understanding of reservoir heterogeneity.
The choice of visualization technique depends on the specific task and the audience. For example, simple cross-plots are suitable for presenting initial data analysis results, while 3D visualizations are better suited for communicating complex reservoir models to a wider audience.
Q 25. What are your preferred methods for presenting technical information?
My preferred methods for presenting technical information emphasize clarity, conciseness, and visual appeal. I tailor my presentation style to the audience, whether it’s a technical team or a group of non-technical stakeholders.
- Data-Driven Presentations: I rely heavily on visuals such as charts, graphs, and maps to convey complex information in an easily digestible format. Data tables are utilized to support key findings.
- Clear and Concise Narrative: I structure presentations with a clear introduction, body, and conclusion, focusing on the key findings and their implications. Avoiding unnecessary jargon is critical.
- Interactive Elements: When appropriate, I incorporate interactive elements, such as demonstrations of software tools or 3D models, to enhance engagement.
- Tailored Communication: I adapt my communication style to the audience’s level of technical expertise. For instance, I might use simpler terminology and analogies when explaining complex concepts to a non-technical audience.
Ultimately, the goal is to ensure that the audience understands the key messages and can use the information to make informed decisions. Using a combination of visual aids, clear language, and interactive elements aids in this significantly.
Q 26. Explain your experience with project management and teamwork.
My experience with project management and teamwork is extensive. I’ve consistently played key roles in multidisciplinary teams, contributing to both the technical and managerial aspects of reservoir characterization projects within the Hampson-Russell workflow.
- Team Leadership: I’ve led and mentored junior geoscientists, providing guidance on technical issues, data analysis, and project workflow. This includes delegating tasks, monitoring progress, and resolving conflicts.
- Collaboration: I have collaborated effectively with geologists, geophysicists, reservoir engineers, and other specialists to integrate data from various sources and create integrated reservoir models. Active listening and clear communication are paramount in such collaborative endeavors.
- Project Planning and Execution: I am proficient in planning and executing projects within defined budgets and timelines. This includes setting realistic goals, allocating resources effectively, and tracking progress.
- Problem Solving: I’m adept at identifying and addressing potential issues and risks within the project, proactively developing contingency plans to ensure project success.
A recent example involved leading a team to integrate seismic data, well logs, and core data to create a high-resolution reservoir model. Through effective planning and collaboration, we successfully completed the project ahead of schedule and within budget, delivering a superior quality product.
Q 27. Describe a situation where you had to solve a complex technical problem.
In one project, we encountered significant challenges in integrating seismic data with well log data due to a complex fault system. The seismic data showed significant distortions near the fault, making it difficult to correlate with the well logs. This resulted in poor reservoir model quality in the faulted zones.
To solve this problem, we employed a multi-step approach:
- Advanced Seismic Processing: We revisited the seismic processing, focusing on improving the imaging quality near the fault. This involved applying advanced pre-stack migration techniques and focusing on noise attenuation to enhance the signal quality.
- Fault Interpretation: We meticulously interpreted the fault system using both seismic and well data, including structural maps derived from the seismic data. This involved a combined interpretation and modeling exercise.
- Seismic Inversion with Constraints: We utilized Hampson-Russell’s seismic inversion capabilities, incorporating well log data as constraints to guide the inversion and improve the resolution of the seismic data near the fault.
- Geostatistical Modeling: Using the improved seismic data and the interpreted fault geometry, we then applied advanced geostatistical methods to create a stochastic reservoir model that accurately represented the uncertainties associated with the fault zone.
This multi-pronged approach ultimately resulted in a significantly improved reservoir model that accurately represented the geology near the fault system. The resolution and accuracy significantly improved our predictions of reservoir properties and hydrocarbon reserves.
Q 28. How do you stay updated with the latest advancements in reservoir characterization technology?
Staying current with advancements in reservoir characterization technology is crucial for maintaining my expertise. I employ a multi-faceted approach to continuous learning:
- Industry Conferences and Workshops: Attending conferences like SEG, AAPG, and SPE provides exposure to the latest research and technological advancements presented by industry leaders.
- Professional Journals and Publications: I regularly read journals such as Geophysics, The Leading Edge, and Petroleum Geoscience to stay abreast of new research and methodologies.
- Online Courses and Webinars: I utilize various online platforms for professional development, focusing on areas such as advanced seismic processing, rock physics modeling, and machine learning applications in geoscience.
- Software Training and Workshops: Hampson-Russell regularly offers training on their software and new features. Staying current with software capabilities is fundamental to my ability to utilize the best available tools.
- Networking: Engaging with colleagues and experts within the industry through conferences, online forums, and collaborations facilitates knowledge sharing and provides insights into cutting-edge techniques.
This proactive approach ensures that I am constantly updating my skill set and leveraging the best available techniques for reservoir characterization, ultimately leading to more accurate and reliable results for my projects.
Key Topics to Learn for Hampson-Russell Interview
- Company Overview and Culture: Research Hampson-Russell’s history, mission, values, and recent news. Understand their market position and competitive landscape.
- Specific Products and Services: Familiarize yourself with Hampson-Russell’s core offerings and their applications in relevant industries. Be prepared to discuss their technological advancements and innovations.
- Industry Knowledge: Demonstrate a solid understanding of the industries Hampson-Russell serves. This includes current trends, challenges, and opportunities within those sectors.
- Technical Skills (if applicable): Depending on the role, review and practice your technical skills related to data analysis, software engineering, or other relevant fields. Be ready to discuss projects showcasing your abilities.
- Problem-Solving & Analytical Skills: Prepare to discuss your approach to problem-solving using examples from your past experiences. Highlight your analytical skills and ability to handle complex situations.
- Teamwork and Collaboration: Hampson-Russell likely values teamwork. Prepare examples demonstrating your ability to collaborate effectively and contribute to a team environment.
- Communication Skills: Practice clear and concise communication. Be prepared to articulate your thoughts and ideas effectively, both verbally and in writing.
Next Steps
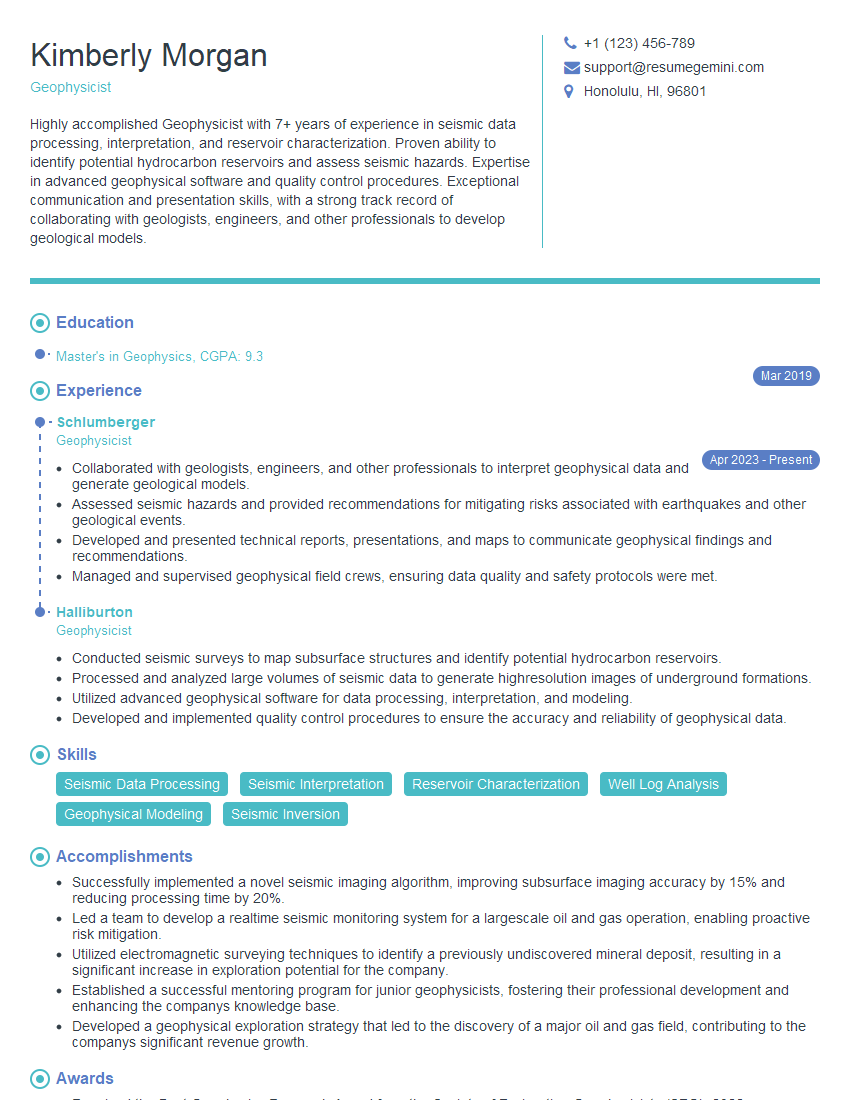
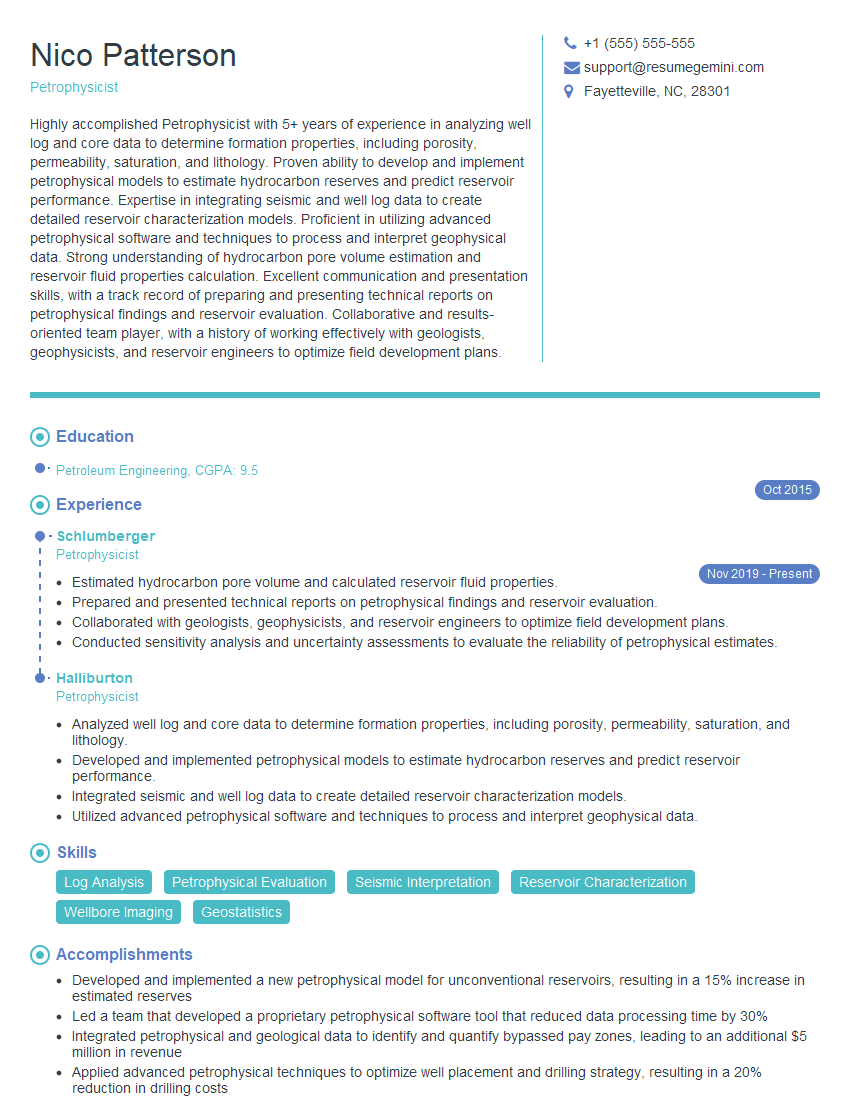
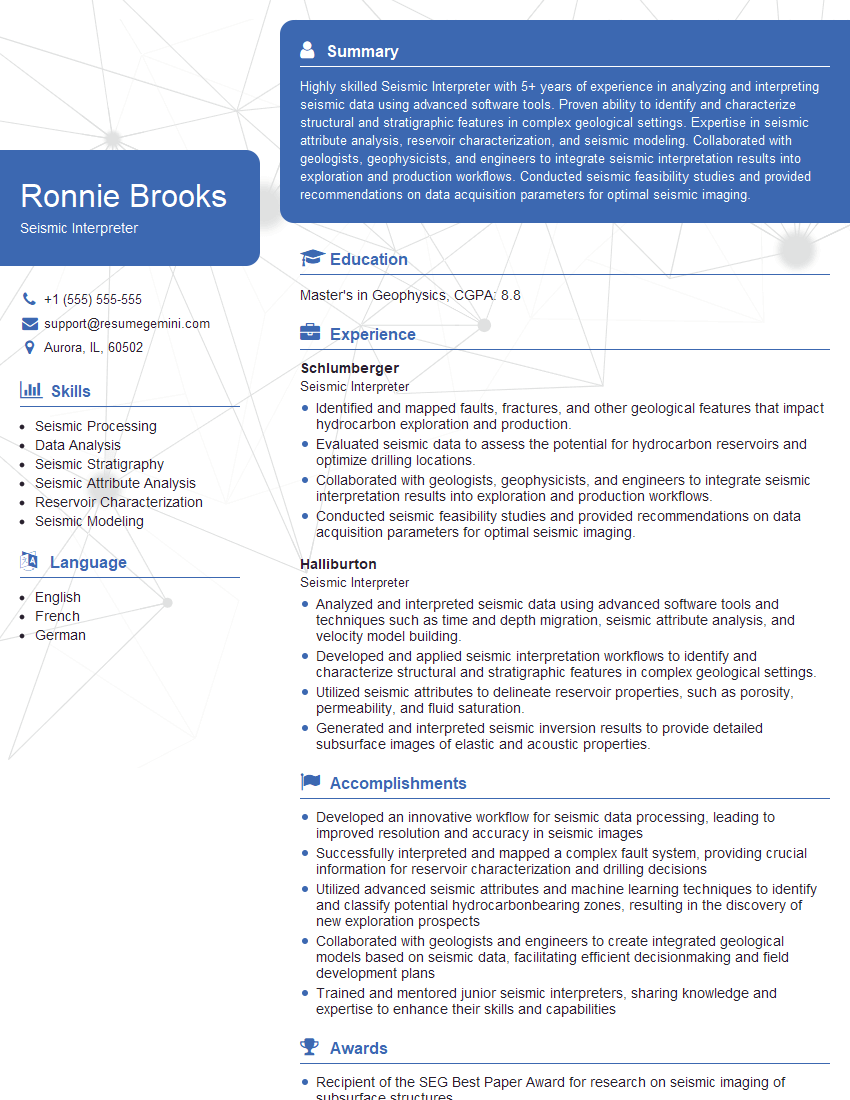
Mastering the key aspects of Hampson-Russell and demonstrating a thorough understanding of their operations significantly enhances your chances of securing a position and advancing your career within a leading company. A strong resume is crucial in getting your application noticed. Creating an ATS-friendly resume is essential to increase your visibility to recruiters and hiring managers. To help you craft a compelling and effective resume, we recommend using ResumeGemini, a trusted resource for building professional resumes. Examples of resumes tailored to Hampson-Russell are available to guide you in this process.
Explore more articles
Users Rating of Our Blogs
Share Your Experience
We value your feedback! Please rate our content and share your thoughts (optional).
What Readers Say About Our Blog
This was kind of a unique content I found around the specialized skills. Very helpful questions and good detailed answers.
Very Helpful blog, thank you Interviewgemini team.


