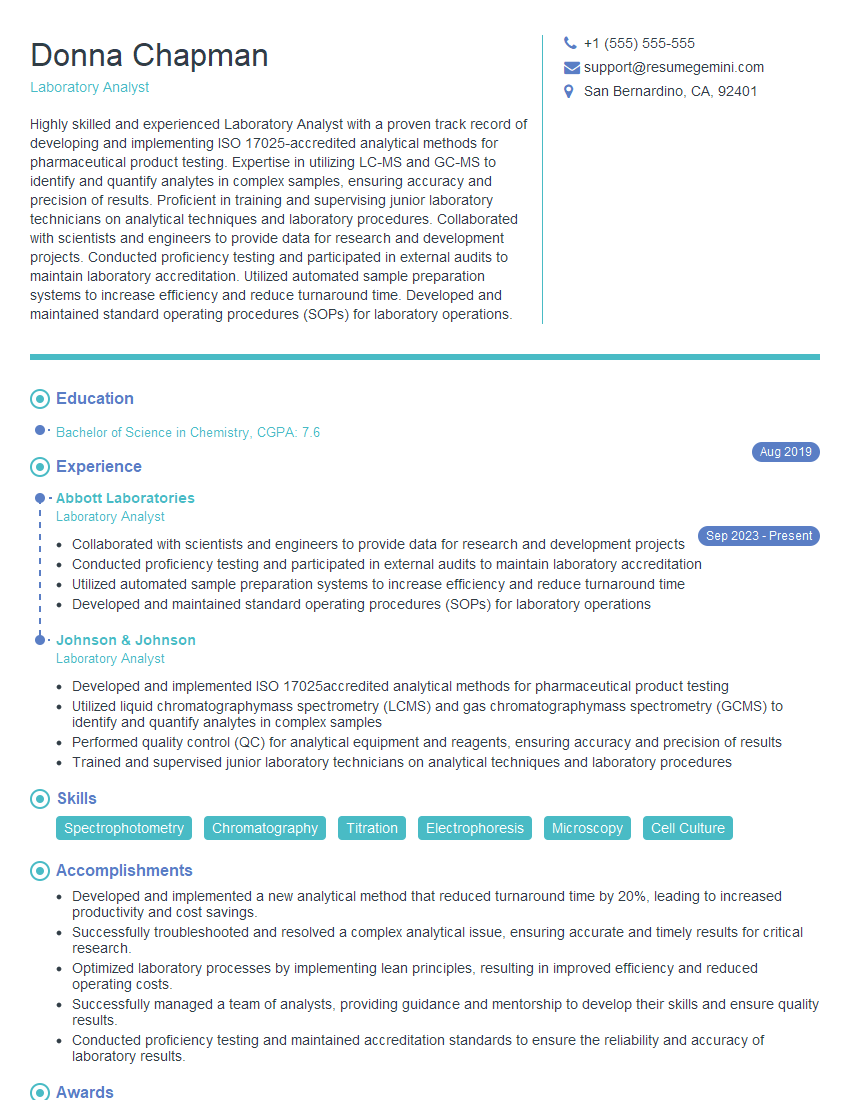
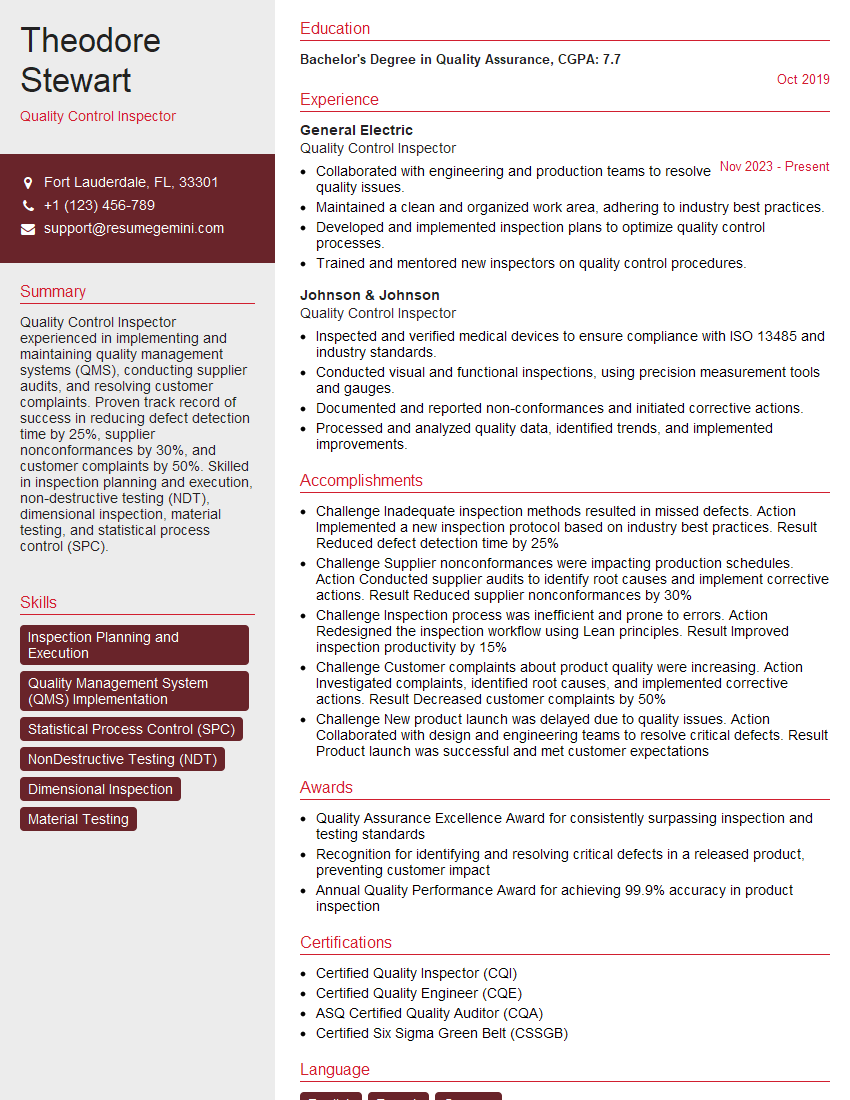
The thought of an interview can be nerve-wracking, but the right preparation can make all the difference. Explore this comprehensive guide to Laboratory Analysis and Quality Control interview questions and gain the confidence you need to showcase your abilities and secure the role.
Questions Asked in Laboratory Analysis and Quality Control Interview
Q 1. Explain the difference between accuracy and precision in laboratory analysis.
Accuracy and precision are two crucial concepts in laboratory analysis that often get confused, but they represent different aspects of measurement quality. Think of it like aiming at a target:
Accuracy refers to how close a measurement is to the true or accepted value. A highly accurate measurement hits the bullseye. It reflects the systematic error, or bias, in the measurement process.
Precision refers to how close repeated measurements are to each other. A highly precise measurement will consistently hit the same spot on the target, even if that spot is far from the bullseye. It reflects random error in the measurements.
For example, if you are measuring the concentration of a substance and the true value is 10 mg/L, an accurate measurement might be 9.9 mg/L, while a precise but inaccurate measurement might repeatedly give a reading of 12 mg/L. Ideally, you want both high accuracy and high precision in your analysis.
In practice, we use statistical methods like calculating the mean and standard deviation to assess both accuracy and precision. Control charts also help monitor these aspects over time.
Q 2. Describe your experience with various analytical techniques (e.g., HPLC, GC, Spectroscopy).
Throughout my career, I’ve extensively used various analytical techniques. My experience includes:
High-Performance Liquid Chromatography (HPLC): I’ve employed HPLC for quantifying various compounds in complex matrices, such as pharmaceuticals in blood plasma or pesticides in environmental samples. I’m proficient in method development, optimization, and troubleshooting, including dealing with peak tailing and poor resolution issues. I’m familiar with different HPLC detectors, including UV-Vis, fluorescence, and mass spectrometry (MS).
Gas Chromatography (GC): I have experience using GC for analyzing volatile compounds, such as organic pollutants in water or flavor compounds in food. I’m adept at selecting appropriate columns and detectors (FID, ECD, MS) based on the analytes of interest. I understand the importance of proper sample preparation techniques to avoid artifacts.
Spectroscopy (UV-Vis, IR, Atomic Absorption Spectroscopy – AAS): I’ve utilized these techniques for qualitative and quantitative analysis of various substances. For instance, UV-Vis is frequently used for quantifying concentrations using Beer-Lambert’s law. IR spectroscopy helps identify functional groups in molecules, while AAS is valuable for determining the concentration of specific metal ions. I am comfortable interpreting spectral data and troubleshooting instrument issues.
My skills encompass all phases of analysis, from method selection and sample preparation to data acquisition, analysis, and reporting. I always strive to optimize methods for speed, accuracy, and efficiency.
Q 3. How do you ensure the proper calibration and maintenance of laboratory instruments?
Proper calibration and maintenance of laboratory instruments are critical to ensuring the reliability of analytical data. This involves a multi-step process:
Regular Calibration: Each instrument has a specific calibration schedule determined by its type and intended use. This involves using certified reference materials (CRMs) to verify the accuracy of the instrument’s readings. Calibration curves are generated and verified regularly. Calibration logs are meticulously maintained and reviewed.
Preventive Maintenance: Regular maintenance, including cleaning, replacing parts as needed, and performing basic checks (e.g., checking gas flow rates in GC), is essential for preventing instrument failure and ensuring optimal performance. This is often done according to a scheduled preventative maintenance (PM) plan.
Quality Control Checks: In addition to formal calibration, regular quality control checks using internal standards or control samples are performed to monitor the instrument’s performance between calibrations. This helps to identify potential drift or other problems before they significantly impact data accuracy.
Documentation: All calibration and maintenance activities are meticulously documented, including dates, results, and any corrective actions taken. This documentation forms a critical part of the audit trail for ensuring data integrity.
For example, in HPLC, we would regularly calibrate the system using a known standard, check the system suitability parameters, and maintain the column to prevent degradation. Any deviation from the established standards triggers an investigation and corrective action.
Q 4. What are the key quality control measures you implement to ensure data integrity?
Data integrity is paramount in laboratory analysis. I employ several key quality control measures to ensure it:
Standard Operating Procedures (SOPs): All analytical procedures follow strict SOPs to ensure consistency and reproducibility. These SOPs cover every aspect of the analysis, from sample preparation to data reporting.
Control Samples: We routinely analyze control samples alongside the experimental samples. These samples help assess the accuracy and precision of the analysis. Any significant deviation from expected values flags potential issues.
Blank Samples: Blank samples (containing only the solvent or matrix) are analyzed to detect and correct for any contamination or interference.
Duplicate Samples: Analysis of duplicate samples allows assessment of the precision of the method. Significant discrepancies trigger investigations to identify and correct the cause.
Audits and Reviews: Regular internal and external audits are conducted to review the laboratory’s processes and ensure compliance with established quality standards.
Electronic Data Management Systems (EDMS): Use of EDMS ensures that data is securely stored, tracked, and managed, reducing the risk of data loss or alteration.
For example, a deviation in control sample results might indicate a problem with the instrument, reagents, or the method itself, prompting a thorough investigation and correction before further analysis is performed.
Q 5. Describe your experience with method validation and verification.
Method validation and verification are crucial steps in ensuring the reliability of analytical methods.
Method Validation is the process of confirming that a newly developed or modified analytical method is suitable for its intended purpose. This involves demonstrating parameters such as accuracy, precision, linearity, limit of detection (LOD), limit of quantification (LOQ), and robustness. Validation follows specific guidelines (e.g., ICH guidelines for pharmaceutical analysis).
Method Verification confirms that a validated method performs as expected when transferred to a different laboratory, analyst, or instrument. This often involves repeating a subset of the validation parameters in the new setting.
I have experience in both method validation and verification across different analytical techniques. For instance, I’ve validated HPLC methods for quantifying pharmaceuticals, carefully documenting the validation parameters and following regulatory guidelines. I’ve also verified methods in new laboratories, ensuring consistent results between sites.
Q 6. How do you handle outliers in your data analysis?
Outliers, data points that significantly deviate from the rest of the data, require careful handling. I would not simply discard them without thorough investigation. My approach involves:
Identifying Potential Causes: First, I investigate the potential causes of the outlier. This could involve reviewing the raw data, checking for errors in sample preparation, instrument malfunction, or transcription errors. A visual examination of the data using a scatter plot or box plot can also aid identification.
Statistical Analysis: Statistical tests, such as Grubbs’ test, can help determine if an outlier is statistically significant. However, statistical significance alone is not sufficient for removal. The context and potential causes also need to be considered.
Re-analysis: If the cause of the outlier is identified and corrected, the sample would be re-analyzed. If a systemic error is discovered, the entire dataset might require re-examination.
Documentation: All steps in handling the outlier, including the investigation, justification for any action taken (or not taken), and the final data included in the report, must be clearly documented.
Reporting: In the final report, any outliers and their handling must be clearly described. Depending on the cause and significance, the outlier might be reported separately or excluded from the final calculations. Transparency is key.
For example, if an outlier is due to a clear procedural error, that data point would be excluded; however, if no obvious explanation is found, the outlier might be included in the analysis and flagged for further investigation.
Q 7. Explain your understanding of Good Laboratory Practices (GLP).
Good Laboratory Practices (GLP) are a set of principles that ensure the quality and integrity of non-clinical laboratory studies. GLP principles are essential for generating reliable and trustworthy data, especially in regulated industries such as pharmaceuticals, environmental testing, and food safety.
My understanding of GLP encompasses several key areas:
Personnel: Qualified and trained personnel are essential. Proper training records and competency assessments are vital.
Facilities: The laboratory must be appropriately designed and equipped to support the specific tests being conducted. This includes proper storage of chemicals and samples.
Equipment: Instruments must be calibrated and maintained according to a schedule, and records must be maintained.
Materials: Reagents and standards must be of appropriate quality and purity, and their traceability must be documented.
Test Systems: The test systems (e.g., animals, cell cultures) must be handled according to appropriate procedures and protocols.
Methods: Standard operating procedures (SOPs) must be followed consistently for all tests. Methods must be validated appropriately.
Quality Assurance: A quality assurance unit (QAU) is vital for overseeing and monitoring all aspects of GLP compliance. This unit conducts audits and reviews to ensure compliance and data integrity.
Documentation: Meticulous documentation is a cornerstone of GLP. All aspects of the study must be documented, including test methods, results, and any deviations from procedures.
Adherence to GLP is crucial to ensuring the reliability and acceptance of laboratory data by regulatory bodies. It’s not merely a set of rules, but a fundamental approach that ensures high standards of quality and integrity in laboratory operations.
Q 8. How do you document your work and maintain detailed laboratory records?
Meticulous documentation is the cornerstone of reliable laboratory analysis. I adhere to a strict system of record-keeping, ensuring all data is complete, accurate, and readily traceable. This involves using both electronic and paper-based methods depending on the lab’s specific requirements and the nature of the analysis.
- Electronic Laboratory Notebooks (ELNs): These are essential for managing large datasets and ensuring data integrity. ELNs offer features such as version control, audit trails, and automated data backups, minimizing the risk of data loss and ensuring compliance. I’m proficient in using several ELN platforms, customizing them to meet the needs of various projects.
- Bound Laboratory Notebooks: For certain types of analyses or when electronic access is limited, I utilize bound notebooks. Entries are made in ink, dated, and signed, preserving a permanent, auditable record. Any errors are crossed out, not erased, and initialed, maintaining the integrity of the original record.
- Standard Operating Procedures (SOPs): All my work follows established SOPs that outline each step of the analytical process, including sample handling, instrument calibration, data analysis, and reporting. These SOPs help maintain consistency and ensure quality.
- Chain of Custody Documents: For sample management, particularly when dealing with forensic or regulatory samples, chain of custody documents are crucial. These meticulously track the location and handling of the sample from collection to analysis, preventing any potential contamination or tampering.
By combining these methods, I create a comprehensive record that is easily accessible, auditable, and compliant with all relevant regulations.
Q 9. Describe a situation where you had to troubleshoot a problem in the laboratory.
During a recent analysis of heavy metals in soil samples using ICP-MS (Inductively Coupled Plasma Mass Spectrometry), I encountered unexpectedly high readings for lead in several samples, significantly exceeding expected levels. This discrepancy immediately raised concerns about the reliability of the data. My troubleshooting process followed these steps:
- Re-examination of the method: I carefully reviewed the analytical method, checking for potential errors in the sample preparation, digestion procedure, or instrument settings.
- Instrument verification: I performed a thorough check of the ICP-MS, including calibration checks, background correction, and internal standard analysis. This ruled out instrument malfunction as a primary cause.
- Blank and control analysis: To detect contamination, I analyzed blanks (samples without analyte) and control samples (samples with known concentrations of analyte). Elevated lead levels in blanks indicated a potential contamination source, likely from the labware used for sample preparation.
- Sample preparation review: I examined the entire sample preparation process, meticulously checking all reagents and equipment. I found trace lead contamination on some of the digestion vessels, likely from previous use.
- Corrective actions: We thoroughly cleaned all labware using rigorous acid washing procedures and subsequently re-analyzed all affected samples using new, cleaned vessels. This eliminated the contamination issue and resulted in accurate, reliable data.
This incident highlighted the importance of thorough method validation, regular instrument maintenance, and careful attention to detail in sample handling and preparation. It also emphasized the value of methodical troubleshooting.
Q 10. What are your experiences with statistical process control (SPC)?
Statistical Process Control (SPC) is integral to maintaining the quality and reliability of laboratory analysis. My experience encompasses both the application and interpretation of SPC tools to monitor various aspects of laboratory operations.
- Control Charts: I routinely use Shewhart charts (X-bar and R charts) and other control charts (e.g., CUSUM, EWMA) to monitor the performance of analytical methods and equipment. These charts visually track data over time, helping identify trends, shifts, and outliers that may indicate a problem. For example, using an X-bar chart to monitor the mean of replicate measurements of a standard ensures the instrument is performing consistently.
- Data Analysis: I’m proficient in using statistical software (e.g., Minitab, JMP) to analyze data generated from control charts, calculate control limits, and interpret the results. This includes understanding and applying concepts like process capability analysis (Cp, Cpk) to assess the ability of the process to meet specifications.
- Method Validation: SPC principles are crucial during method validation, ensuring precision, accuracy, and linearity of analytical methods. The data obtained during validation is statistically analyzed to demonstrate that the method meets predetermined quality criteria.
By applying SPC principles, I can identify and address potential problems before they impact the quality of results, improving efficiency and minimizing errors.
Q 11. How do you identify and address potential sources of error in laboratory analysis?
Identifying and addressing potential sources of error is crucial in laboratory analysis. My approach is systematic and multi-faceted:
- Method Validation: Thorough method validation is the first line of defense against errors. This process involves rigorously testing the method’s performance characteristics (accuracy, precision, linearity, range, etc.) to ensure it’s reliable and fit for its intended purpose. This often includes using certified reference materials for comparison.
- Regular Calibration and Maintenance: Equipment calibration and preventive maintenance are vital for accurate measurements. A scheduled maintenance program ensures instruments are functioning correctly and minimizes the risk of instrument-induced errors.
- Reagent Quality Control: The purity and quality of reagents are checked regularly. This often involves using certified reagents, performing blank analyses, and confirming reagent stability over time.
- Sample Handling and Preparation: Proper sample handling and preparation are essential to prevent contamination or degradation. This includes using appropriate containers, storing samples under correct conditions, and following established procedures for sample preparation.
- Environmental Monitoring: Monitoring the laboratory environment for factors like temperature, humidity, and contamination can help identify external factors that may impact analytical results.
- Statistical Analysis: Regular use of statistical tools (e.g., control charts, ANOVA) help identify systematic errors and variations in data. Outliers and unusual trends can point to potential problems.
By combining these strategies, I can proactively identify and mitigate potential sources of error, ensuring the accuracy and reliability of laboratory results.
Q 12. Describe your experience with different types of sampling techniques.
My experience encompasses various sampling techniques, each tailored to the specific material being analyzed and the objectives of the study. The choice of technique depends heavily on factors such as the nature of the material (homogeneous or heterogeneous), the required sample size, and the cost and time constraints.
- Random Sampling: This is a fundamental technique where every unit in the population has an equal chance of being selected. It’s suitable for homogeneous materials, ensuring a representative sample. For example, randomly selecting soil samples from a field.
- Stratified Sampling: This technique divides the population into distinct strata (subgroups) based on relevant characteristics, then randomly samples from each stratum. It’s used when the population is heterogeneous, ensuring each subgroup is adequately represented. For instance, analyzing a mixture of different grain sizes, taking samples from each size range.
- Systematic Sampling: This involves selecting samples at fixed intervals (e.g., every 10th item). It’s relatively simple but assumes a certain degree of homogeneity. An example might be taking samples of a product from a continuous production line at regular intervals.
- Composite Sampling: Several individual samples are combined to form a single composite sample. This is cost-effective for large volumes but loses the ability to analyze individual sample variation. It’s used frequently in environmental monitoring where several small samples are combined for one analysis.
The selection of the appropriate sampling technique is crucial for the accuracy and reliability of subsequent analysis. I ensure careful consideration is given to all relevant factors in order to produce a truly representative sample.
Q 13. Explain your understanding of quality control charts (e.g., Shewhart charts, control charts).
Quality control charts, such as Shewhart charts, are powerful visual tools used to monitor the stability and performance of processes over time. They allow for quick detection of trends, shifts, and other variations that may indicate a problem requiring investigation.
- Shewhart Charts (X-bar and R charts): These charts are widely used to monitor the average (X-bar) and range (R) of a process. The X-bar chart tracks the central tendency, while the R chart monitors the variability of the process. Control limits, typically calculated using 3 standard deviations, are drawn on the chart. Points outside these limits signal potential issues.
- Control Limits: These limits are statistically derived and define the acceptable range of variation for the process. Points outside the control limits suggest that the process is out of control, indicating a potential cause of error or a shift in the process mean or variability.
- Patterns: Even when points remain within the control limits, specific patterns (e.g., trends, cycles, or stratification) may signal underlying problems. These patterns require careful investigation to identify root causes. For example, a consistent upward trend may indicate a gradual deterioration of equipment or a systematic drift in the process.
Control charts are invaluable tools for monitoring the quality of laboratory analysis, helping to identify and correct issues promptly before they lead to inaccurate or unreliable results. Different types of control charts are appropriate depending on the data type (e.g., count data, continuous data).
Q 14. How do you ensure compliance with regulatory requirements (e.g., ISO, GMP)?
Ensuring compliance with regulatory requirements, such as ISO 17025 and Good Manufacturing Practices (GMP), is paramount in my work. This is a continuous process that involves adherence to established procedures and documentation.
- Standard Operating Procedures (SOPs): We adhere strictly to detailed, validated SOPs for all analytical methods and procedures. These SOPs are regularly reviewed and updated to reflect any changes in regulatory requirements or best practices.
- Quality Management System (QMS): The laboratory operates under a robust QMS that includes procedures for calibration, validation, quality control, and corrective actions. This system ensures the quality and reliability of all laboratory processes.
- Documentation: Meticulous record-keeping is essential. All activities, including instrument calibration, sample analysis, and corrective actions, are meticulously documented in accordance with audit trails. This documentation is readily available for internal and external audits.
- Internal Audits: Regular internal audits assess compliance with established SOPs and regulatory requirements. Any deviations or non-conformances are addressed promptly through corrective and preventative actions (CAPA).
- External Audits: The laboratory undergoes regular external audits to ensure ongoing compliance with accreditation bodies and regulatory agencies. This provides independent verification of our compliance efforts.
Compliance is not simply a matter of following rules; it is an integral aspect of our commitment to producing accurate, reliable, and trustworthy results. A culture of quality and compliance is essential in every aspect of laboratory operations.
Q 15. What is your experience with LIMS (Laboratory Information Management System)?
My experience with LIMS (Laboratory Information Management System) spans over seven years, encompassing implementation, data management, and system optimization. I’ve worked with several LIMS platforms, including Thermo Fisher’s SampleManager and LabWare LIMS. My responsibilities have included setting up user accounts and permissions, configuring workflows for various assays, tracking samples and reagents, and generating reports. For instance, in my previous role, I streamlined our sample tracking process within LabWare, reducing turnaround time by 15% by implementing a barcode-scanning system integrated with the LIMS. This improved efficiency and reduced manual data entry errors significantly. Furthermore, I have extensive experience troubleshooting LIMS-related issues, ensuring data integrity and system uptime. I am also proficient in LIMS data migration and validation, having successfully migrated data from an older system to a newer platform in a previous role, ensuring all data remained accurate and auditable.
Career Expert Tips:
- Ace those interviews! Prepare effectively by reviewing the Top 50 Most Common Interview Questions on ResumeGemini.
- Navigate your job search with confidence! Explore a wide range of Career Tips on ResumeGemini. Learn about common challenges and recommendations to overcome them.
- Craft the perfect resume! Master the Art of Resume Writing with ResumeGemini’s guide. Showcase your unique qualifications and achievements effectively.
- Don’t miss out on holiday savings! Build your dream resume with ResumeGemini’s ATS optimized templates.
Q 16. Describe your experience with data analysis software (e.g., Excel, specialized statistical software).
I’m highly proficient in various data analysis software packages. My primary tool is Microsoft Excel, where I’m skilled in advanced functions like pivot tables, macros, and VBA scripting for automating repetitive tasks and generating complex reports. For instance, I’ve developed macros to automate data import from various instruments, reducing manual processing time considerably. I also have experience with specialized statistical software, including R and GraphPad Prism. In R, I’ve performed statistical analyses like ANOVA, t-tests, and regression analysis for data interpretation. With GraphPad Prism, I’ve created publication-ready graphs and charts. In a recent project, I utilized R to identify outliers in a large dataset and developed a statistical model to predict results, improving the accuracy of our quality control process. This enhanced our ability to detect anomalies in a timely manner and prevent potentially costly issues.
Example R code for a simple t-test: t.test(group1, group2)Q 17. How do you manage your time effectively in a fast-paced laboratory environment?
Managing time effectively in a fast-paced lab setting requires a structured approach. I employ a combination of strategies including prioritization, task delegation, and efficient workflow optimization. I start each day by reviewing my task list, prioritizing tasks based on urgency and importance using methods like the Eisenhower Matrix (urgent/important). I also break down large tasks into smaller, manageable steps. I frequently use time-blocking techniques to allocate specific time slots for various activities. For example, I might dedicate two hours in the morning to hands-on experiments, followed by an hour for data analysis, and then an hour for report writing. This helps me stay focused and avoid distractions. Furthermore, I proactively identify bottlenecks in our workflows and work with my team to find solutions that improve efficiency. For instance, I proposed a new sample preparation protocol that reduced processing time by 30%, freeing up time for other critical tasks.
Q 18. Describe your experience with safety procedures in a laboratory setting.
Safety is paramount in a laboratory environment. My experience includes rigorous adherence to all safety protocols, including the proper use of personal protective equipment (PPE) like gloves, lab coats, and eye protection. I’m trained in the handling and disposal of hazardous materials, including chemicals, biological agents, and sharps. I am familiar with emergency procedures, such as responding to spills, fires, or injuries. For instance, I’ve participated in regular safety training and refresher courses, including training on chemical hygiene plans, emergency response plans, and waste management. I also actively participate in safety inspections and contribute to identifying and mitigating potential hazards within the lab. I view safety not merely as a set of rules but as a collective responsibility, promoting a culture of safety among my colleagues.
Q 19. How do you handle deviations from established protocols?
Deviations from established protocols are addressed systematically. The first step involves documenting the deviation thoroughly, including the date, time, nature of the deviation, and the personnel involved. Next, I investigate the root cause of the deviation. This might involve reviewing the experimental procedures, equipment logs, or personnel training records. Once the root cause is identified, I implement corrective actions to prevent recurrence. This could involve modifying the protocol, retraining personnel, or improving equipment maintenance procedures. Finally, all deviations are reported to the appropriate supervisory personnel and documented in a deviation log. A thorough investigation ensures that any impact on the data quality or safety is fully assessed and addressed. The entire process is guided by a principle of continuous improvement, learning from past deviations to enhance our overall laboratory operations.
Q 20. How do you ensure the proper storage and handling of laboratory samples and reagents?
Proper storage and handling of samples and reagents are crucial for maintaining data integrity and ensuring safety. We adhere to strict protocols based on the nature of each sample or reagent. Samples are labelled clearly with unique identifiers, including date, time of collection, and any relevant information. They are stored in appropriate containers (e.g., cryovials for frozen samples) and at the correct temperatures (e.g., refrigeration, freezing). Reagents are also stored according to their specific requirements, including temperature, light exposure, and expiration dates. Regular inventories are conducted to check for expired reagents or samples that need to be discarded according to established protocols. This careful process helps to minimize degradation, contamination, and ensures the reliability and validity of the results generated from any samples and reagents.
Q 21. What is your experience with internal and external quality control programs?
I have significant experience with both internal and external quality control programs. Internal quality control involves running control samples alongside test samples to assess the accuracy and precision of our assays. We use control charts to monitor the performance of our assays over time, identifying any trends or shifts that might indicate a problem. External quality control involves participating in proficiency testing programs, where we analyze samples from external organizations to compare our results with those of other labs. These programs help ensure that our results are accurate and reliable, meeting the required standards. Any discrepancies are investigated thoroughly, and corrective actions are taken to address any issues. The data from both internal and external QC programs are carefully documented and reviewed regularly, forming a critical component of our quality assurance and regulatory compliance.
Q 22. Explain your understanding of root cause analysis.
Root cause analysis (RCA) is a systematic approach to identifying the underlying causes of problems, not just the symptoms. It’s crucial in a laboratory setting because pinpointing the root cause ensures effective corrective actions and prevents recurrence. Think of it like diagnosing a disease – treating the symptoms (fever) won’t cure the illness unless you identify the underlying infection (e.g., pneumonia).
A common RCA methodology is the ‘5 Whys’. You repeatedly ask ‘why’ to peel back layers of explanation. For example, if a batch of samples showed inaccurate results:
- Problem: Inaccurate results.
- Why 1: Calibration was off.
- Why 2: The calibration standard was expired.
- Why 3: The lab’s inventory management system didn’t flag expired standards.
- Why 4: The system lacked automated alerts for approaching expiration dates.
- Why 5: The system wasn’t updated with the latest features due to budget constraints.
The ‘5 Whys’ helps drill down to the systemic issue (budget constraints hindering system updates), rather than simply recalibrating the instrument (a superficial fix).
Other methods include Fishbone diagrams (Ishikawa diagrams), Fault Tree Analysis (FTA), and Pareto charts, each offering different approaches to systematically identify and prioritize root causes.
Q 23. How do you communicate your findings effectively to colleagues and management?
Effective communication is paramount. I tailor my communication style to the audience. For colleagues, I use clear, concise language, focusing on the data and its implications, often using visual aids like graphs and charts. For management, I provide a concise summary of the findings, highlighting the impact on the lab’s operations and any financial implications, emphasizing recommendations and next steps.
I prefer a combination of methods: written reports for detailed analysis, verbal presentations for quick updates and discussions, and interactive sessions for collaborative problem-solving. For complex findings, I use presentations with clear visuals and data tables to enhance understanding and retention. I always ensure my communication is accurate, objective, and avoids technical jargon where possible.
For instance, when presenting a report on an instrument malfunction, I would start with a summary of the issue’s impact (e.g., downtime, potential cost overruns), then move to the detailed analysis of the root cause and finally suggest actionable improvements to avoid recurrence.
Q 24. Describe a situation where you had to work collaboratively with others in a lab setting.
During a large-scale environmental monitoring project, we faced a critical deadline. Our team, comprising chemists, biologists, and data analysts, needed to analyze hundreds of samples within a tight timeframe. I took the lead in coordinating sample processing, ensuring efficient workflow and quality control measures.
We used a collaborative project management tool to track progress, assign tasks, and manage deadlines. Regular team meetings allowed for open communication and problem-solving. For example, when one analyst faced a challenge with a particular assay, we shared expertise and troubleshooting strategies. This collaborative approach allowed us to deliver the project successfully, on time and within budget, proving that effective teamwork is crucial for timely and accurate lab results.
Q 25. What is your experience with proficiency testing or external audits?
I have extensive experience with proficiency testing (PT) and external audits. PT participation is vital for maintaining lab quality and demonstrating competency. I’ve managed our lab’s participation in numerous PT programs, analyzing results, identifying potential biases, and implementing corrective actions when necessary. This involves careful tracking of results, statistical analysis of performance against other labs, and documentation of the entire process.
External audits, such as ISO 17025, assess compliance with quality standards. I’ve actively participated in several audits, ensuring our lab’s adherence to regulations and best practices. This included preparing documentation, guiding auditors through our processes, and addressing their queries. Successful audits demonstrate our commitment to quality and reliability.
Addressing discrepancies requires careful investigation and documentation, often involving root cause analysis. For example, if PT results showed a bias, I’d investigate potential sources of error – instrument calibration, reagent quality, or technician training – to implement corrective actions.
Q 26. How do you stay updated with the latest advancements in laboratory techniques and regulations?
Staying updated in this rapidly evolving field requires a multi-pronged approach. I regularly subscribe to relevant journals (e.g., Analytical Chemistry, Clinical Chemistry), attend conferences and workshops, and actively participate in professional organizations. Online resources, such as webinars and reputable websites from governing bodies, are invaluable sources of information.
I also actively seek training opportunities, including vendor-specific workshops on new instrumentation and techniques. Networking with colleagues through professional organizations provides insights into current best practices and challenges faced by other labs. Staying informed ensures our lab utilizes the most current and efficient methods, while ensuring compliance with evolving regulations.
Q 27. Describe your experience with risk assessment and management in a laboratory setting.
Risk assessment is crucial in a laboratory setting. I use a systematic approach, identifying potential hazards (chemical spills, equipment malfunctions, biological agents) and evaluating their likelihood and severity. This involves reviewing standard operating procedures (SOPs) and identifying potential gaps. We then implement control measures (e.g., safety training, emergency procedures, personal protective equipment).
Risk management involves implementing and monitoring these controls. This includes regular equipment maintenance, safety training for personnel, and emergency drills. Documentation is key – we meticulously record all risk assessments, control measures, and incident reports. For example, after identifying the risk of a chemical spill, we implemented a new waste disposal system and reinforced safety training on handling chemicals, regularly reviewing and updating our procedures to minimize risks.
Q 28. What are your salary expectations for this role?
My salary expectations are commensurate with my experience and skills, and aligned with the industry standards for a senior laboratory analyst in this location. I am open to discussing a competitive compensation package that reflects the value I bring to your organization.
Key Topics to Learn for Laboratory Analysis and Quality Control Interview
- Analytical Techniques: Understanding the principles and applications of various analytical methods (e.g., spectrophotometry, chromatography, titrations) is crucial. Consider the strengths and limitations of each technique and when they are most appropriate.
- Good Laboratory Practices (GLP): Demonstrate a strong understanding of GLP principles, including documentation, sample handling, calibration, and maintaining accurate records. Be prepared to discuss real-world scenarios where GLP adherence was critical.
- Quality Control (QC) Procedures: Master the concepts of accuracy, precision, and bias in analytical measurements. Understand the role of QC charts, control samples, and statistical analysis in ensuring data reliability.
- Method Validation & Verification: Be able to explain the process of validating and verifying analytical methods, including parameters like linearity, range, accuracy, precision, and limit of detection/quantification.
- Data Analysis and Interpretation: Practice interpreting analytical data, identifying potential sources of error, and drawing valid conclusions. Familiarity with statistical software is beneficial.
- Laboratory Safety and Regulations: Showcase your understanding of relevant safety procedures, regulations (e.g., OSHA, ISO), and waste disposal protocols within a laboratory setting.
- Troubleshooting and Problem-Solving: Prepare examples where you successfully identified and resolved analytical problems. Highlight your methodical approach to troubleshooting and your ability to learn from mistakes.
- Instrumentation: Demonstrate familiarity with common laboratory instruments used in analysis and QC, understanding their operational principles and maintenance requirements.
- Standard Operating Procedures (SOPs): Explain the importance of SOPs in maintaining consistency and reproducibility in laboratory analysis. Be ready to discuss your experience following and developing SOPs.
Next Steps
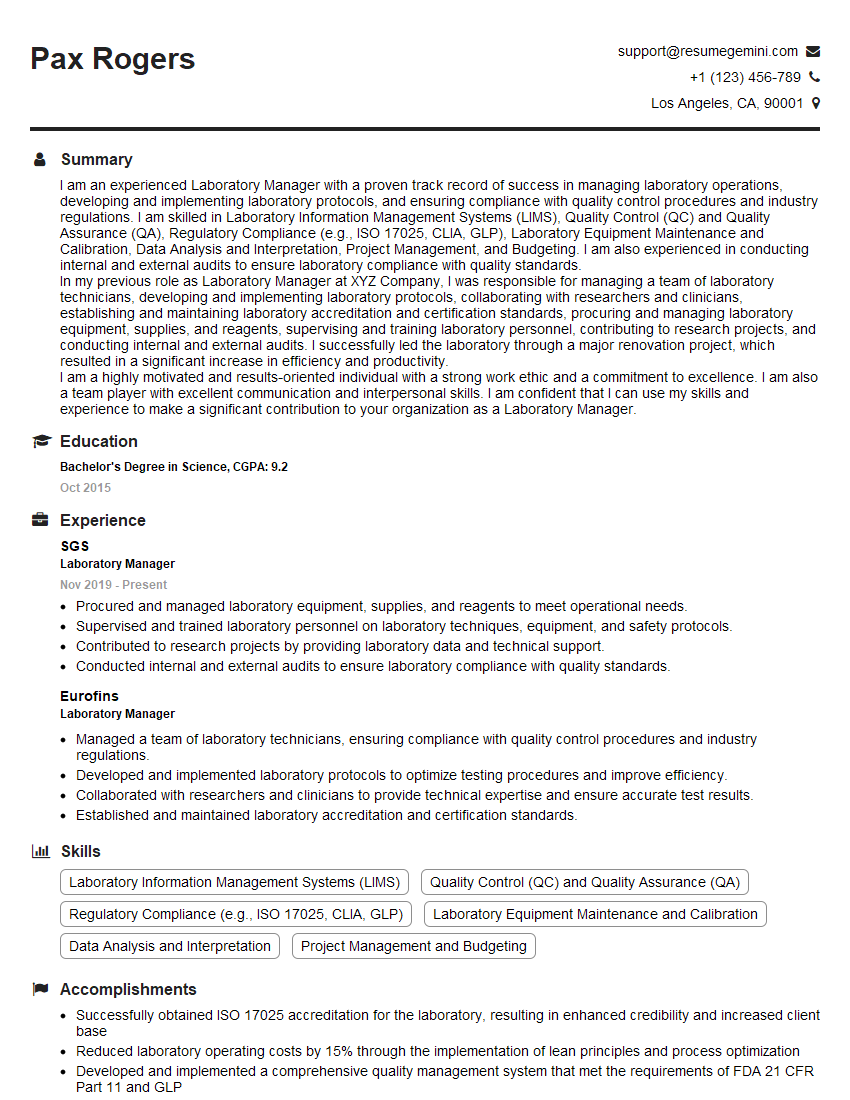
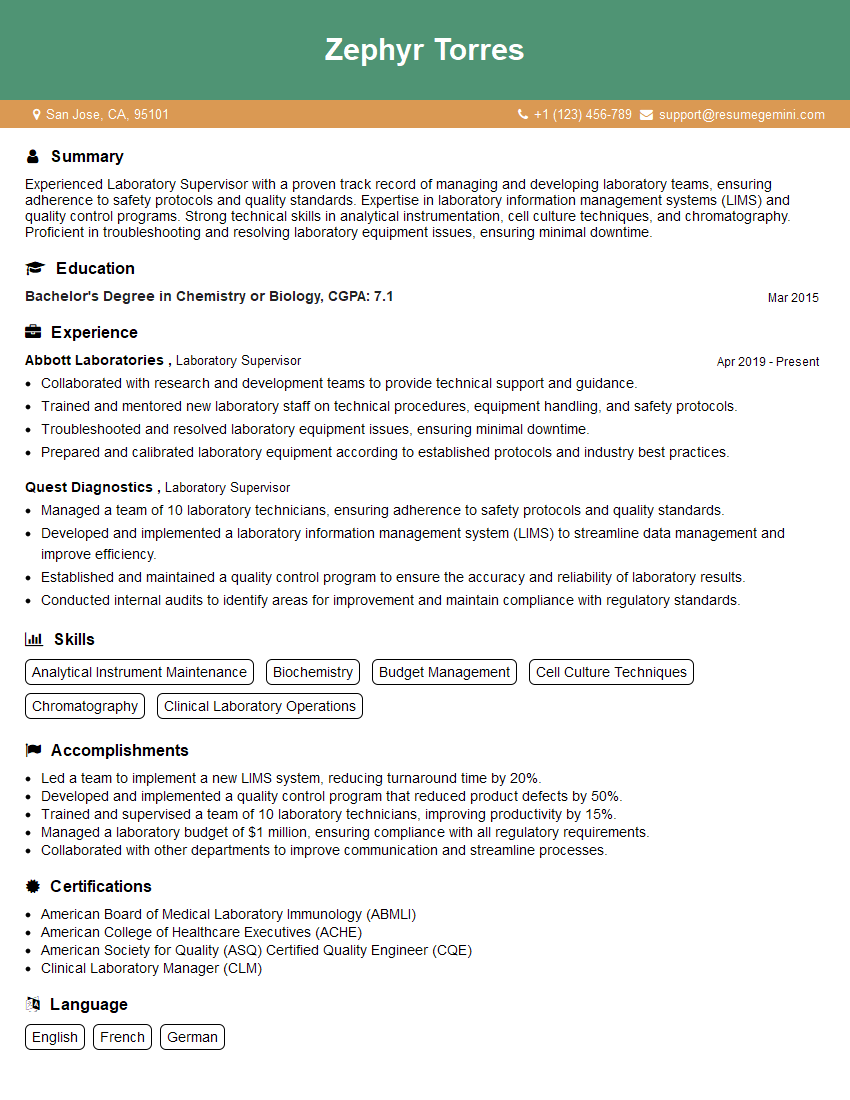
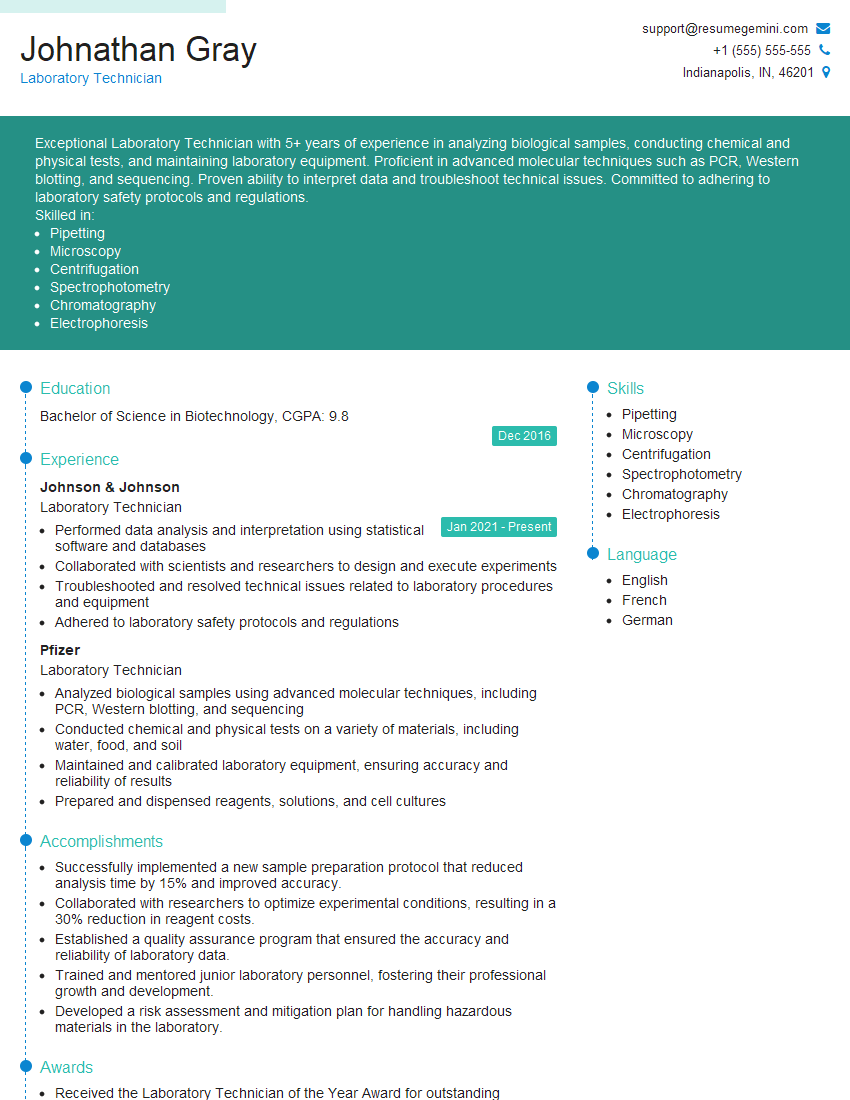
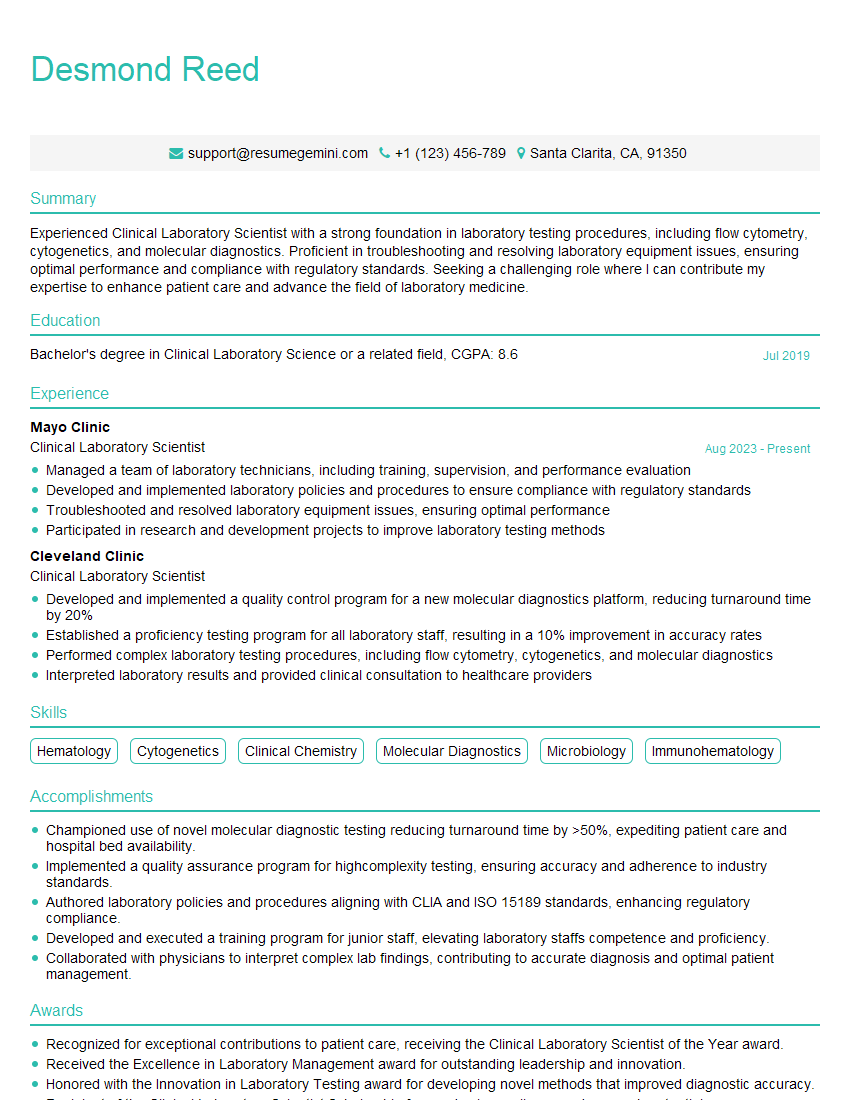
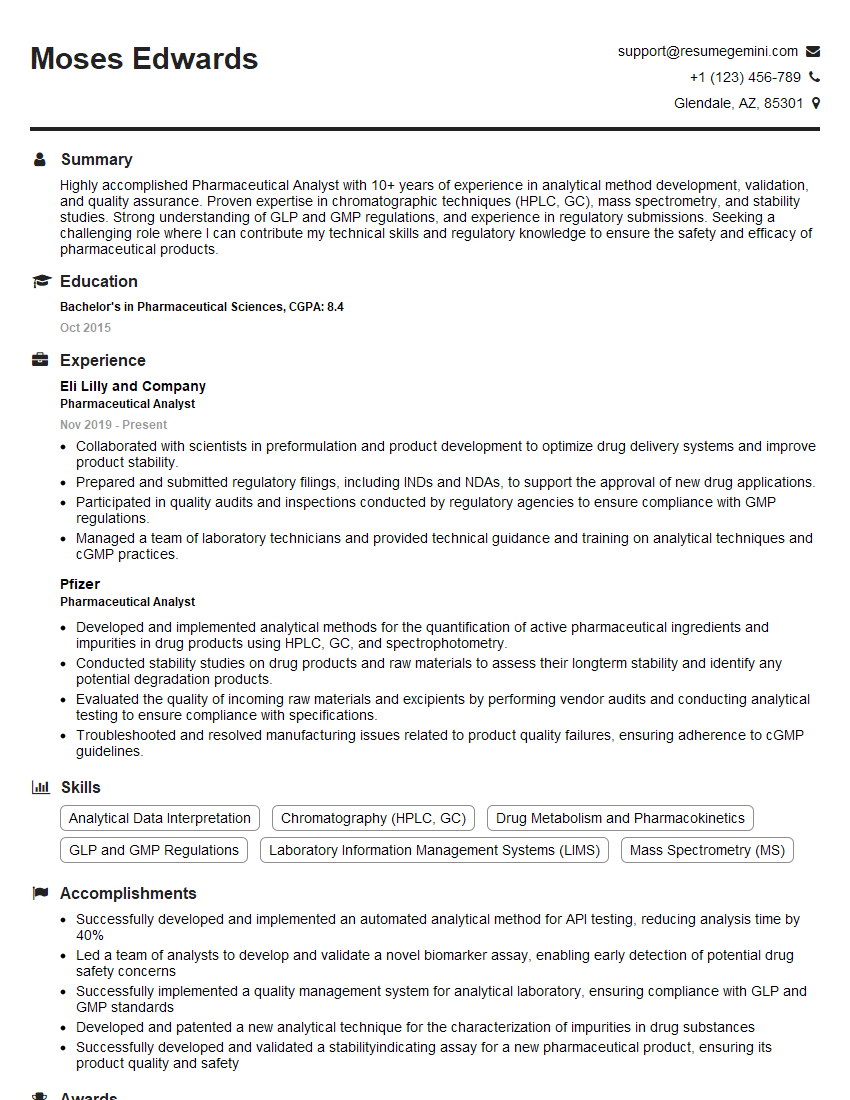
Mastering Laboratory Analysis and Quality Control opens doors to exciting career advancements, offering opportunities for specialization and leadership roles within the scientific industry. To maximize your job prospects, crafting an ATS-friendly resume is paramount. ResumeGemini can help you build a compelling and effective resume that highlights your skills and experience. ResumeGemini offers a streamlined process and provides examples of resumes tailored to Laboratory Analysis and Quality Control to help you create a professional document that stands out.
Explore more articles
Users Rating of Our Blogs
Share Your Experience
We value your feedback! Please rate our content and share your thoughts (optional).
What Readers Say About Our Blog
This was kind of a unique content I found around the specialized skills. Very helpful questions and good detailed answers.
Very Helpful blog, thank you Interviewgemini team.
