Unlock your full potential by mastering the most common Laboratory analysis methods interview questions. This blog offers a deep dive into the critical topics, ensuring you’re not only prepared to answer but to excel. With these insights, you’ll approach your interview with clarity and confidence.
Questions Asked in Laboratory analysis methods Interview
Q 1. Explain the principles of spectrophotometry.
Spectrophotometry is a quantitative analytical technique used to measure the absorbance or transmission of light through a solution. It’s based on the principle that the amount of light absorbed by a solution is directly proportional to the concentration of the analyte (the substance being measured) present, and the path length of the light through the solution. This relationship is described by the Beer-Lambert Law: A = εbc, where A is absorbance, ε is the molar absorptivity (a constant specific to the analyte and wavelength of light), b is the path length, and c is the concentration.
In practice, a spectrophotometer shines a beam of light of a specific wavelength through a sample cuvette containing the solution. The instrument measures the intensity of the light before it passes through the sample (I0) and after it passes through the sample (I). The absorbance is then calculated using the formula: A = log10(I0/I). By creating a calibration curve (plotting absorbance against known concentrations), we can determine the concentration of an unknown sample based on its measured absorbance.
Example: Measuring the concentration of glucose in a blood sample. A known amount of glucose is added to different solutions to create a calibration curve. Then the absorbance of the unknown blood sample is measured, and its concentration is determined by comparing its absorbance to the calibration curve.
Q 2. Describe different types of chromatography and their applications.
Chromatography is a separation technique used to isolate and identify individual components within a mixture. It relies on the differential partitioning of the mixture’s components between a stationary phase (a solid or liquid) and a mobile phase (a liquid or gas). Different types of chromatography exist, each suited for specific applications:
- Gas Chromatography (GC): Uses a gaseous mobile phase to separate volatile compounds. It’s widely used in environmental monitoring (analyzing pollutants in air or water), forensic science (detecting drugs or explosives), and the petroleum industry (analyzing hydrocarbon compositions).
- High-Performance Liquid Chromatography (HPLC): Employs a liquid mobile phase to separate non-volatile compounds. Applications are vast, including pharmaceutical analysis (testing drug purity and stability), food analysis (detecting contaminants or additives), and clinical chemistry (analyzing biological samples).
- Thin-Layer Chromatography (TLC): A simpler, less expensive technique using a thin layer of adsorbent material (like silica gel) on a plate as the stationary phase. It’s often used for quick preliminary analysis, such as identifying components in a mixture or monitoring the progress of a chemical reaction.
- Ion Chromatography (IC): Specifically designed to separate ions based on their charge and affinity for the stationary phase. It is commonly used to analyze water samples for anions and cations, essential in environmental and industrial settings.
The choice of chromatography technique depends on the properties of the analytes (e.g., volatility, polarity, solubility) and the desired level of separation and analysis.
Q 3. What are the key quality control measures in a laboratory setting?
Maintaining high quality in laboratory analysis requires a robust quality control (QC) program. Key measures include:
- Standard Operating Procedures (SOPs): Detailed written instructions for each analytical method, ensuring consistency and reproducibility.
- Reagent and Standard Preparation: Using certified reference materials (CRMs) and meticulously preparing reagents to ensure accuracy and traceability.
- Instrument Calibration and Verification: Regularly calibrating instruments (e.g., balances, spectrophotometers) against certified standards and verifying their performance using control samples.
- Quality Control Samples (QCS): Analyzing QCSs with known concentrations alongside unknown samples to assess the accuracy and precision of the method.
- Blank Samples: Running blank samples (containing only solvent or reagents) to detect contamination and background signals.
- Duplicate Analyses: Performing duplicate analyses of selected samples to assess the precision of the method.
- Proficiency Testing: Participating in external proficiency testing programs to compare results with other laboratories and identify potential biases.
- Data Management and Record Keeping: Maintaining detailed records of all analyses, including data, calibrations, and QC results. This ensures traceability and compliance with regulations.
A comprehensive QC program minimizes errors, improves data reliability, and ensures the validity of the results.
Q 4. How do you ensure accuracy and precision in laboratory measurements?
Ensuring accuracy and precision in laboratory measurements is crucial. Several strategies are employed:
- Proper Calibration: Regularly calibrate all instruments using certified standards, following manufacturer’s instructions.
- Appropriate Techniques: Using correct pipetting techniques, proper weighing procedures, and avoiding contamination are vital.
- Replicate Measurements: Performing multiple measurements and calculating the mean and standard deviation reduces random error and improves precision.
- Using Certified Reference Materials: Employing CRMs for calibrations and quality control ensures traceability and accuracy.
- Method Validation: Before routine use, methods should be validated to establish their accuracy, precision, linearity, and other performance characteristics.
- Blind Samples: Periodically analyzing blind samples (samples with unknown concentrations) to assess the analyst’s performance and avoid bias.
- Environmental Controls: Maintaining a clean and organized laboratory environment minimizes contamination.
A combination of these strategies ensures reliable and high-quality analytical data.
Q 5. What is the significance of calibration curves in analytical chemistry?
Calibration curves are essential in analytical chemistry for quantifying analytes in unknown samples. They are plots of known concentrations of the analyte against their corresponding responses (e.g., absorbance, peak area in chromatography). By measuring the response of an unknown sample and comparing it to the calibration curve, its concentration can be determined using interpolation.
Significance:
- Quantitative Analysis: Provides a reliable method for determining analyte concentrations.
- Method Validation: Used to assess the linearity, range, and sensitivity of an analytical method.
- Quality Control: Helps monitor the consistency and accuracy of analytical measurements over time.
For example, in spectrophotometry, a calibration curve is generated by measuring the absorbance of solutions with known concentrations of the analyte. The absorbance of the unknown sample is then measured, and its concentration is determined by referring to the calibration curve.
Q 6. Explain the difference between accuracy and precision.
Accuracy and precision are distinct but related concepts in analytical chemistry.
Accuracy refers to how close a measurement is to the true or accepted value. A highly accurate measurement indicates minimal systematic error (consistent bias in measurements). Imagine aiming for the bullseye on a dartboard – high accuracy means your darts are clustered near the center.
Precision, on the other hand, reflects the reproducibility or repeatability of measurements. High precision means that repeated measurements yield similar results, regardless of their proximity to the true value. In our dartboard analogy, high precision means your darts are clustered tightly together, even if they are far from the bullseye.
It’s possible to have high precision but low accuracy (all darts clustered together but far from the center) and vice versa (darts scattered around the bullseye, but not closely clustered). Ideally, measurements should be both accurate and precise.
Q 7. How do you handle outliers in analytical data?
Outliers are data points that significantly deviate from the general pattern of the data set. They can be caused by errors (e.g., pipetting mistakes, instrument malfunction) or may represent genuine but unusual observations. Handling outliers requires careful consideration:
- Identify Potential Causes: Investigate whether there were any procedural errors during sample collection, preparation, or analysis that might explain the outlier.
- Visual Inspection: Examine the data using graphs (e.g., scatter plots, box plots) to visually identify outliers.
- Statistical Tests: Use statistical tests (e.g., Grubbs’ test, Dixon’s Q test) to assess the probability of an outlier being genuine. These tests determine if the outlier is statistically significant.
- Data Transformation: In some cases, transforming the data (e.g., logarithmic transformation) can reduce the influence of outliers.
- Removal or Retention: After investigation, a decision must be made whether to remove the outlier or retain it. Removal should be justified and documented; retention requires clear reasons for keeping the data point. Removing outliers should only be done after thorough investigation and if there’s a clear justification (e.g., demonstrable experimental error).
- Reporting: It’s crucial to report how outliers were handled, providing a transparent and defensible analysis.
The approach to handling outliers depends on the context, the potential causes, and the overall data distribution.
Q 8. Describe your experience with different laboratory instruments (e.g., HPLC, GC, Mass Spectrometry).
My experience spans a wide range of analytical instrumentation, with extensive hands-on use of HPLC (High-Performance Liquid Chromatography), GC (Gas Chromatography), and Mass Spectrometry (MS). In HPLC, I’ve worked extensively with both reverse-phase and normal-phase chromatography for the separation and quantification of diverse analytes, from pharmaceuticals to environmental pollutants. I’m proficient in method development and optimization, including column selection, mobile phase optimization, and gradient programming. For instance, I successfully optimized an HPLC method for the analysis of trace impurities in a pharmaceutical formulation, resulting in a significant improvement in sensitivity and resolution. With GC, my experience includes both packed and capillary column techniques, coupled with various detectors like FID (Flame Ionization Detector) and ECD (Electron Capture Detector). I’ve used GC to analyze volatile organic compounds (VOCs) in air samples and residual solvents in pharmaceutical products. Finally, my expertise with Mass Spectrometry includes both single quadrupole and triple quadrupole instruments. I’ve utilized MS for qualitative and quantitative analysis, including targeted and non-targeted metabolomics studies. This involved using techniques like Selected Ion Monitoring (SIM) and Multiple Reaction Monitoring (MRM) to achieve excellent selectivity and sensitivity, crucial when dealing with complex matrices.
Q 9. Explain your understanding of method validation.
Method validation is a crucial process ensuring a laboratory method produces reliable and consistent results. It’s a systematic investigation that confirms the method’s suitability for its intended purpose. Key validation parameters include accuracy (closeness to the true value), precision (reproducibility of results), linearity (relationship between measured signal and analyte concentration), limit of detection (LOD) and quantification (LOQ), specificity (ability to measure the analyte without interference), and robustness (resistance to small variations in operating conditions). Imagine baking a cake – a validated method is like having a reliable recipe that consistently produces a delicious cake, regardless of minor variations in ingredients or oven temperature. During my work, method validation followed stringent regulatory guidelines, often involving the use of certified reference materials and statistical analysis to demonstrate compliance with the required acceptance criteria. Any deviation requires investigation and correction before reporting of results.
Q 10. How do you troubleshoot common problems encountered during laboratory analysis?
Troubleshooting is an integral part of laboratory analysis. When problems arise, my approach is systematic and involves several steps. First, I carefully review the entire analytical process, from sample preparation to instrument operation. This often involves checking instrument logs for any errors or unusual patterns. Second, I identify the source of the problem. This might involve checking reagent quality, verifying instrument calibration, inspecting tubing for leaks, or evaluating the sample preparation procedure. For example, if an HPLC peak is unexpectedly broad, I would investigate factors such as column degradation, improper mobile phase mixing, or sample injection issues. Once the problem is pinpointed, I implement the appropriate corrective action, whether it involves recalibrating the instrument, replacing a reagent, or optimizing the method. Finally, I document all troubleshooting steps and implemented solutions, ensuring the problem is resolved and prevents recurrence.
Q 11. What are the different types of errors in laboratory analysis and how can they be minimized?
Errors in laboratory analysis can be broadly categorized as random and systematic errors. Random errors are unpredictable fluctuations that occur during measurements, leading to variations around the true value. They’re often due to factors like instrument noise or minor variations in sample handling. Systematic errors, on the other hand, are consistent and predictable biases that consistently shift results in one direction. These can stem from faulty equipment, incorrect calibrations, or procedural flaws. Minimizing errors involves a multifaceted approach. Random errors can be reduced through careful technique, using appropriate statistical methods, and ensuring sufficient replicates. Systematic errors are tackled by employing proper calibration procedures, using certified reference materials, performing regular instrument maintenance, and strictly adhering to validated methods. Employing quality control samples and conducting regular proficiency testing further helps in identifying and correcting errors before they impact results.
Q 12. Describe your experience with data analysis and interpretation.
Data analysis and interpretation are critical skills in my field. My experience encompasses various techniques, including descriptive statistics, regression analysis, and multivariate data analysis. I’m proficient in using software packages like Excel, R, and specialized chromatography data systems. I’m comfortable with generating various data visualizations, like graphs and charts, to effectively communicate findings. Interpreting data involves critical thinking and understanding the limitations of the methods used. For example, in a study of pesticide residues in food samples, I would use statistical analysis to assess the significance of the findings and consider factors like detection limits and matrix effects when drawing conclusions. Furthermore, I’m always mindful of data integrity and follow strict procedures for data management and documentation, ensuring traceability and transparency in all analysis.
Q 13. How familiar are you with Good Laboratory Practices (GLP)?
I have a strong understanding and extensive practical experience with Good Laboratory Practices (GLP). GLP are a set of principles that ensure the uniformity, consistency, quality, and integrity of laboratory studies. They cover all aspects of laboratory operations, including personnel qualifications, equipment maintenance and calibration, reagent management, and documentation. Compliance with GLP is essential for generating reliable and defensible data, particularly in regulated industries like pharmaceuticals and environmental monitoring. In my previous roles, I’ve been directly involved in implementing and maintaining GLP compliance, participating in audits, and ensuring adherence to all relevant guidelines. GLP is not merely a set of rules; it’s a mindset that emphasizes quality and reliability in every step of the analytical process.
Q 14. Explain your understanding of Standard Operating Procedures (SOPs).
Standard Operating Procedures (SOPs) are documented step-by-step instructions for performing specific laboratory tasks. They provide a consistent approach and ensure that procedures are performed uniformly and reliably. SOPs are critical for maintaining data quality, minimizing errors, and ensuring reproducibility. A well-written SOP clearly outlines all steps, including materials, equipment, and safety precautions. A good example is an SOP for preparing a specific type of sample. A detailed SOP will specify the exact amounts of reagents, the sequence of steps, the equipment to use, the required quality control measures, and the necessary documentation. My experience includes developing, reviewing, and adhering to numerous SOPs, ensuring they are clear, concise, and easily understood. In the event that adjustments to an SOP are required (updates, corrections, improvements), a complete revision record and approvals are also meticulously followed and documented.
Q 15. How do you ensure the safety and proper disposal of laboratory chemicals?
Ensuring the safety and proper disposal of laboratory chemicals is paramount for both environmental protection and the well-being of laboratory personnel. This involves a multi-faceted approach, starting with the initial procurement and storage of chemicals.
- Proper Storage: Chemicals are stored according to their compatibility and hazard classification (flammable, corrosive, toxic, etc.). Incompatible chemicals are never stored together to prevent dangerous reactions. We use clearly labeled containers and appropriate safety cabinets (e.g., flammables cabinets, acid cabinets).
- Safe Handling: Personal Protective Equipment (PPE) such as gloves, lab coats, and eye protection is mandatory when handling chemicals. Spills are addressed immediately using appropriate spill kits and cleanup procedures. We always work under a well-ventilated hood for volatile or hazardous substances.
- Waste Management: Waste disposal follows strict regulations and guidelines. Chemicals are segregated into different waste streams (e.g., organic solvents, heavy metals, acids, bases) based on their chemical properties. We maintain detailed waste logs, ensuring proper documentation for regulatory compliance. Hazardous waste is contracted to a licensed hazardous waste disposal company.
- Training and SOPs: Regular training sessions are conducted to refresh safety protocols and proper handling techniques. Standard Operating Procedures (SOPs) are in place for all chemical handling and disposal procedures, ensuring consistent practice across the laboratory.
For example, in my previous role, we had a specific protocol for handling mercury spills, involving the use of specialized sulfur powder to immobilize the mercury before carefully collecting and disposing of it according to regulations.
Career Expert Tips:
- Ace those interviews! Prepare effectively by reviewing the Top 50 Most Common Interview Questions on ResumeGemini.
- Navigate your job search with confidence! Explore a wide range of Career Tips on ResumeGemini. Learn about common challenges and recommendations to overcome them.
- Craft the perfect resume! Master the Art of Resume Writing with ResumeGemini’s guide. Showcase your unique qualifications and achievements effectively.
- Don’t miss out on holiday savings! Build your dream resume with ResumeGemini’s ATS optimized templates.
Q 16. Describe your experience with different sample preparation techniques.
Sample preparation is a critical step in laboratory analysis, significantly impacting the accuracy and reliability of results. My experience encompasses a wide range of techniques, tailored to the specific analytical method and sample matrix.
- Solid-Phase Extraction (SPE): I’ve extensively used SPE for cleaning up complex samples and concentrating analytes of interest before instrumental analysis (e.g., HPLC, GC-MS). This technique selectively removes interfering compounds, improving the sensitivity and specificity of the analysis. For example, I’ve used SPE to extract pesticides from soil samples before GC-MS analysis.
- Liquid-Liquid Extraction (LLE): LLE is a classic technique involving the partitioning of analytes between two immiscible solvents. I’ve used this method for separating organic compounds from aqueous samples. The choice of solvents depends on the polarity of the analytes. Proper pH control is crucial for efficient extraction.
- Microwave-Assisted Extraction (MAE): MAE offers a faster and more efficient alternative to traditional extraction methods. By using microwave energy, we can extract analytes from solid samples in a shorter time with improved extraction yields. I’ve used MAE for extracting various compounds from plant materials.
- Solid-Phase Microextraction (SPME): SPME is a solvent-free technique that uses a coated fiber to extract analytes directly from the sample matrix. It is particularly useful for volatile and semi-volatile compounds. I’ve utilized SPME for analyzing headspace volatiles in food samples.
The choice of the optimal sample preparation technique depends on factors such as the nature of the sample, the analyte of interest, the required sensitivity, and the available instrumentation.
Q 17. Explain your understanding of limit of detection (LOD) and limit of quantitation (LOQ).
The Limit of Detection (LOD) and Limit of Quantitation (LOQ) are crucial parameters in analytical chemistry, defining the lowest concentrations of an analyte that can be reliably detected and quantified, respectively. They are essential for assessing the sensitivity and reliability of an analytical method.
LOD represents the lowest concentration of an analyte that can be distinguished from background noise with a certain level of confidence (typically 99%). It’s often expressed as the concentration that produces a signal three times the standard deviation of the blank (LOD = 3σ).
LOQ represents the lowest concentration of an analyte that can be reliably quantified with acceptable accuracy and precision. It’s typically expressed as ten times the standard deviation of the blank (LOQ = 10σ). Below the LOQ, the uncertainty in quantification is too high to provide reliable results.
Imagine trying to detect a faint signal in a noisy environment. The LOD is the point where you can just barely hear the signal above the background noise. The LOQ is where you can not only hear the signal but also measure its volume accurately.
Both LOD and LOQ are method-specific and depend on various factors including the instrumentation, sample matrix, and analytical procedure. They are determined experimentally and reported with the validation of the method.
Q 18. What are the different types of laboratory glassware and their uses?
Laboratory glassware is essential for various tasks, from measuring volumes to carrying out chemical reactions. Different types of glassware have specific properties and uses.
- Beaker: A cylindrical container with a lip for pouring, used for mixing, heating, and stirring liquids. Beakers are not highly accurate for measuring volumes.
- Erlenmeyer Flask (Conical Flask): A cone-shaped flask with a narrow neck, ideal for swirling liquids and preventing spills. Commonly used for titrations and culturing.
- Volumetric Flask: A pear-shaped flask with a calibrated neck, used for preparing solutions with precise volumes.
- Graduated Cylinder: A tall cylindrical container with graduations for measuring volumes. More accurate than beakers but less so than volumetric flasks.
- Pipette (various types): Used for transferring precise volumes of liquids. Different types include volumetric pipettes, graduated pipettes, and micropipettes, with varying levels of precision.
- Burette: A long, graduated tube with a stopcock at the bottom, used for titrations to deliver precise volumes of liquid.
- Test Tubes: Small cylindrical tubes used for small-scale reactions and sample storage.
The choice of glassware depends on the specific application. For example, when preparing a standard solution for quantitative analysis, a volumetric flask is essential for accuracy. For routine mixing, beakers are suitable. Understanding the properties of different glassware is crucial for obtaining reliable and accurate results.
Q 19. Explain your experience with statistical analysis of laboratory data.
Statistical analysis is an integral part of laboratory data analysis, providing tools to assess the quality of data, identify outliers, and draw meaningful conclusions. My experience includes the application of various statistical techniques to various datasets.
- Descriptive Statistics: I routinely use descriptive statistics like mean, median, standard deviation, and variance to summarize and interpret data. This helps in understanding the central tendency and dispersion of the data.
- Inferential Statistics: I apply t-tests, ANOVA, and regression analysis to test hypotheses, compare groups, and identify relationships between variables. For example, I used a t-test to compare the means of two different analytical methods to determine if they yield statistically significant differences.
- Quality Control Charts: I use control charts (Shewhart charts, CUSUM charts) to monitor the performance of analytical methods and identify potential issues with precision and accuracy. This ensures that the laboratory consistently produces reliable results.
- Outlier Detection: I employ various outlier detection methods (e.g., Grubbs’ test) to identify and handle outliers which can significantly impact the results. Understanding the reasons behind outliers is critical for maintaining data integrity.
Statistical software packages like R and Minitab are commonly used to perform these analyses. Proper data management and the understanding of statistical principles are essential for conducting valid and reliable statistical analysis of laboratory data. For instance, a misinterpretation of statistical significance can lead to faulty conclusions.
Q 20. How do you maintain the cleanliness and organization of a laboratory?
Maintaining a clean and organized laboratory is essential for safety, accuracy, and efficiency. This involves several key strategies.
- Regular Cleaning: Daily cleaning is crucial, including wiping down benches, disposing of waste, and cleaning glassware. Spills are cleaned immediately. The laboratory is thoroughly cleaned at the end of each day.
- Organization: Chemicals and equipment are stored in a logical and organized manner, ensuring easy access and preventing accidental mixing of incompatible substances. Clear labeling is essential for all containers.
- Inventory Management: Maintaining an updated inventory of chemicals and supplies is crucial for efficient stock management and preventing the use of expired reagents. Regular checks are conducted to identify missing or low stock items.
- Waste Disposal: Proper waste disposal is vital for maintaining a safe and clean laboratory. Hazardous waste is segregated and disposed of according to regulations.
- Preventive Maintenance: Regular maintenance of equipment is crucial for ensuring their proper function and longevity. This includes calibration checks and preventative servicing.
A well-organized and clean lab not only enhances safety but also improves efficiency, reducing the time spent searching for materials and minimizing the risk of errors. Think of it as a well-organized kitchen; you’re much more efficient and less prone to accidents in a tidy workspace.
Q 21. How do you handle discrepancies in analytical results?
Discrepancies in analytical results require a systematic investigation to identify the root cause and ensure data reliability. This involves a structured approach.
- Review the Procedure: The first step involves carefully reviewing the entire analytical procedure, from sample preparation to data analysis, to identify any potential sources of error. This may involve checking for mistakes in calculations, instrument malfunctions, or improper sample handling.
- Repeat the Analysis: Repeating the analysis using the same sample and reagents is crucial for determining whether the discrepancy is due to random error or a systematic issue. Running control samples alongside the experimental samples also provides valuable information.
- Investigate Possible Errors: Depending on the nature of the discrepancy, investigations may involve checking the calibration of instruments, verifying reagent purity and quality, or re-examining the sample preparation procedure. If the discrepancy is significant, an independent analysis may be required.
- Document Findings: All steps taken to investigate the discrepancy, along with the findings, must be meticulously documented. This documentation is important for maintaining the integrity of the data and for future reference.
- Corrective Actions: Based on the findings, appropriate corrective actions must be implemented to prevent similar discrepancies in the future. This may involve retraining personnel, improving procedures, or replacing faulty equipment.
For example, if a significant discrepancy was found between two replicate analyses, I’d first check the calculations, instrument readings, and sample handling. If the discrepancy persisted after careful review, I’d repeat the analysis, and if necessary, investigate the source of the reagents or the calibration of the equipment.
Q 22. Describe your experience with laboratory safety protocols.
Laboratory safety is paramount. My experience encompasses meticulous adherence to all relevant protocols, starting with proper personal protective equipment (PPE) selection and use. This includes selecting appropriate gloves, eye protection, lab coats, and sometimes respirators depending on the chemicals handled. I’m proficient in handling hazardous materials, including proper storage, disposal, and spill response procedures. For example, in a previous role, we had a minor chemical spill involving acetone. I immediately followed the established protocol: evacuating the immediate area, notifying the supervisor, using the appropriate absorbent material to clean up the spill, and properly disposing of the contaminated materials according to the safety data sheet (SDS). I’m also trained in fire safety procedures, including the location and proper use of fire extinguishers and emergency exits. Furthermore, I understand and follow all relevant health and safety regulations and guidelines, including those related to biological safety, such as proper autoclave sterilization techniques for biological waste.
- Strict adherence to PPE guidelines.
- Proficiency in handling and disposing of hazardous materials.
- Thorough understanding of spill response protocols.
- Familiarity with fire safety procedures.
- Compliance with all relevant health and safety regulations.
Q 23. What are your strengths and weaknesses in a laboratory setting?
One of my greatest strengths is my meticulous attention to detail. Accuracy is crucial in laboratory analysis, and I pride myself on consistently producing precise and reliable results. For instance, during a particularly complex HPLC analysis, I meticulously checked all parameters and calibrations, leading to the identification of a previously overlooked systematic error in the system’s performance that improved the overall precision of our results. I also possess strong problem-solving skills, able to troubleshoot instrument malfunctions and method-related issues effectively. A weakness I’m actively working on is delegation. While I’m thorough in my own work, I sometimes find it challenging to delegate tasks effectively, trusting others to maintain the same high standards. I’m addressing this by improving my communication skills and fostering a culture of trust within the team.
Q 24. Explain your understanding of different analytical techniques used in your field of expertise.
My expertise spans various analytical techniques. I’m proficient in chromatography, including both High-Performance Liquid Chromatography (HPLC) and Gas Chromatography-Mass Spectrometry (GC-MS). HPLC is invaluable for separating and quantifying components in a liquid mixture, like analyzing pharmaceuticals or environmental pollutants. GC-MS is exceptionally useful for volatile compounds, such as identifying contaminants in food or analyzing the composition of essential oils. I also have experience with spectrophotometry (UV-Vis and IR), providing information about the molecular structure and concentration of substances. For example, UV-Vis spectrophotometry can be used to quantify the concentration of a protein solution using the Beer-Lambert law. Furthermore, I am familiar with titrations, a fundamental technique for determining the concentration of an unknown solution. Each technique has its unique applications; the selection depends on the nature of the sample and the information required.
Q 25. How would you approach a problem where an instrument malfunctions during an important analysis?
Instrument malfunction during a crucial analysis demands a systematic approach. First, I would ensure the safety of myself and others. Then, I’d follow a troubleshooting protocol, starting with the most likely causes. This could involve checking for simple issues like power supply, reagent levels, or software glitches. If the issue persists, I would consult the instrument’s manual, contact technical support, or seek assistance from a senior colleague. If the instrument cannot be repaired promptly, I would assess the impact on the analysis. Can the data be salvaged? Can alternative methods be employed? Documentation of all steps, including the malfunction, troubleshooting attempts, and any resulting data alterations, is crucial for maintaining data integrity. For example, if the HPLC pump malfunctions, I would check the solvent reservoirs and tubing for clogs before contacting support. If the problem can’t be resolved quickly, I might consider repeating the analysis on a backup instrument or exploring alternative methods if feasible, always meticulously documenting every step in the process.
Q 26. Describe your experience with documentation and record-keeping in a laboratory setting.
Accurate documentation and record-keeping are fundamental to maintaining the integrity of laboratory work. My experience includes meticulous record-keeping using both electronic laboratory notebooks (ELNs) and physical notebooks. I’m proficient in maintaining detailed records of experiments, including experimental design, procedures, observations, results, and data analysis. All data is meticulously labeled and organized. Chain of custody procedures are strictly followed for samples. I am also skilled in generating clear and comprehensive reports detailing the methodologies, findings, and conclusions of laboratory analyses. This is vital for ensuring the reproducibility of results and for complying with regulatory requirements. For example, in previous roles we used LIMS (Laboratory Information Management System) to manage samples, track analyses and record all quality control data. This ensured accurate and auditable data management.
Q 27. How do you stay up-to-date with the latest advancements in laboratory analysis methods?
Staying current in this field requires continuous learning. I regularly review peer-reviewed scientific journals, such as Analytical Chemistry and Journal of Chromatography, to stay abreast of the latest methodologies and innovations. I also actively participate in professional development activities, attending workshops, conferences, and webinars focused on advancements in laboratory analysis techniques. Membership in professional organizations, such as the American Chemical Society, provides access to cutting-edge research and networking opportunities. Furthermore, I utilize online resources, such as reputable scientific databases, to access research papers, review articles, and technical specifications. This multifaceted approach ensures I maintain a comprehensive understanding of the latest developments and best practices in the field.
Key Topics to Learn for Laboratory Analysis Methods Interview
- Fundamentals of Analytical Chemistry: Understanding basic concepts like accuracy, precision, sensitivity, and specificity is crucial. Consider exploring different types of errors and their impact on results.
- Spectroscopic Techniques: Gain a strong understanding of techniques like UV-Vis, IR, NMR, and Mass Spectrometry. Practice explaining their principles, applications, and limitations. Be prepared to discuss sample preparation for each technique.
- Chromatographic Methods: Master the principles of HPLC, GC, and TLC. Focus on understanding column selection, mobile phase optimization, and data interpretation. Be ready to discuss different detector types and their applications.
- Electrochemical Methods: Familiarize yourself with techniques like potentiometry, voltammetry, and amperometry. Understand their underlying principles and applications in various analytical scenarios.
- Data Analysis and Interpretation: Develop strong skills in interpreting analytical data, including understanding statistical analysis, calibration curves, and quality control procedures. Practice identifying potential sources of error and proposing solutions.
- Method Validation and Quality Control: Understand the importance of method validation parameters such as linearity, accuracy, precision, and limits of detection/quantification. Be familiar with different quality control charts and their applications.
- Laboratory Safety and Good Laboratory Practices (GLP): Demonstrate a strong understanding of laboratory safety procedures, waste disposal, and adherence to GLP guidelines. This is crucial for any laboratory role.
- Specific Techniques Relevant to Your Target Role: Research the specific techniques and methodologies used in the job description. Tailor your preparation to match the employer’s needs.
Next Steps
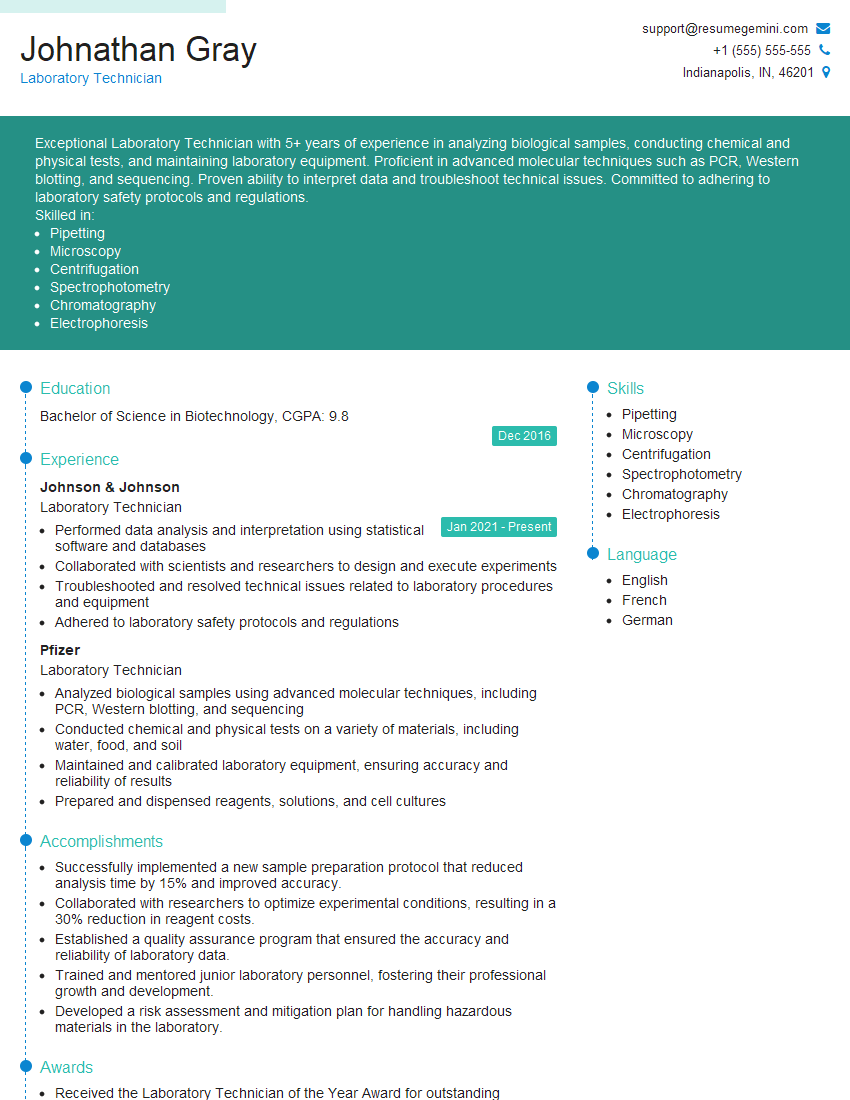
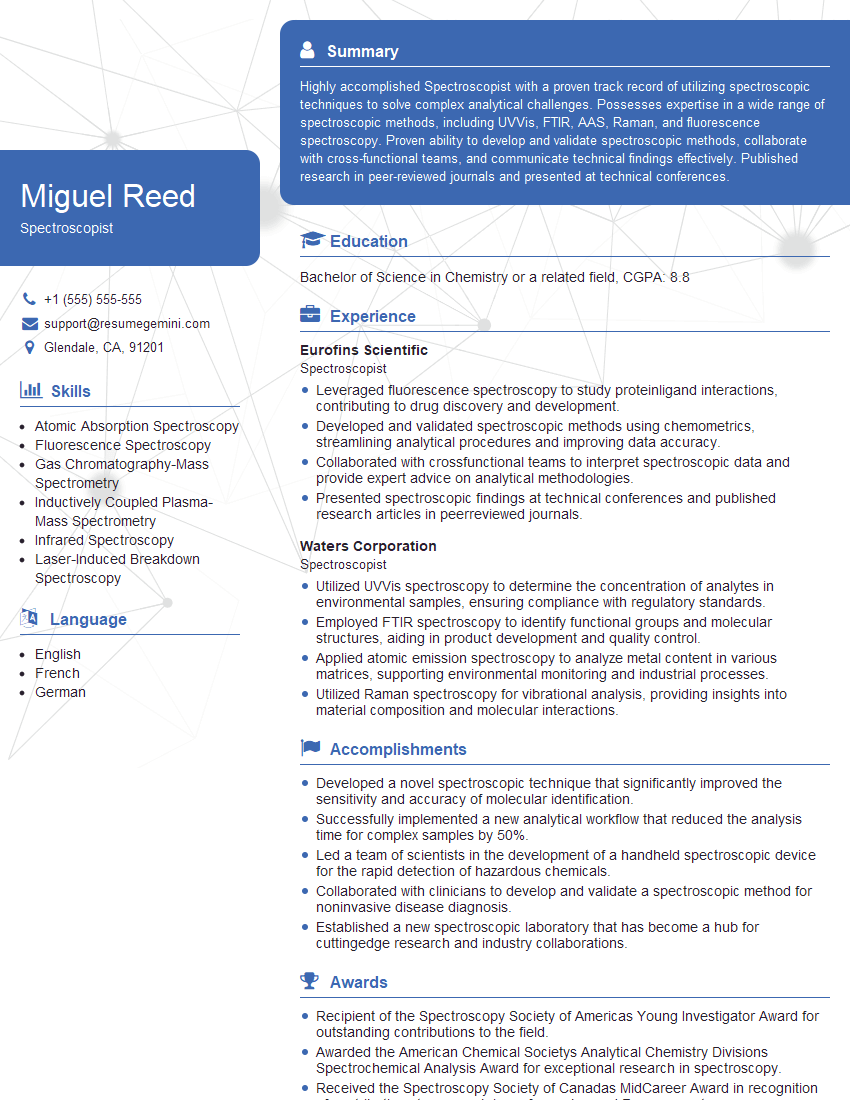
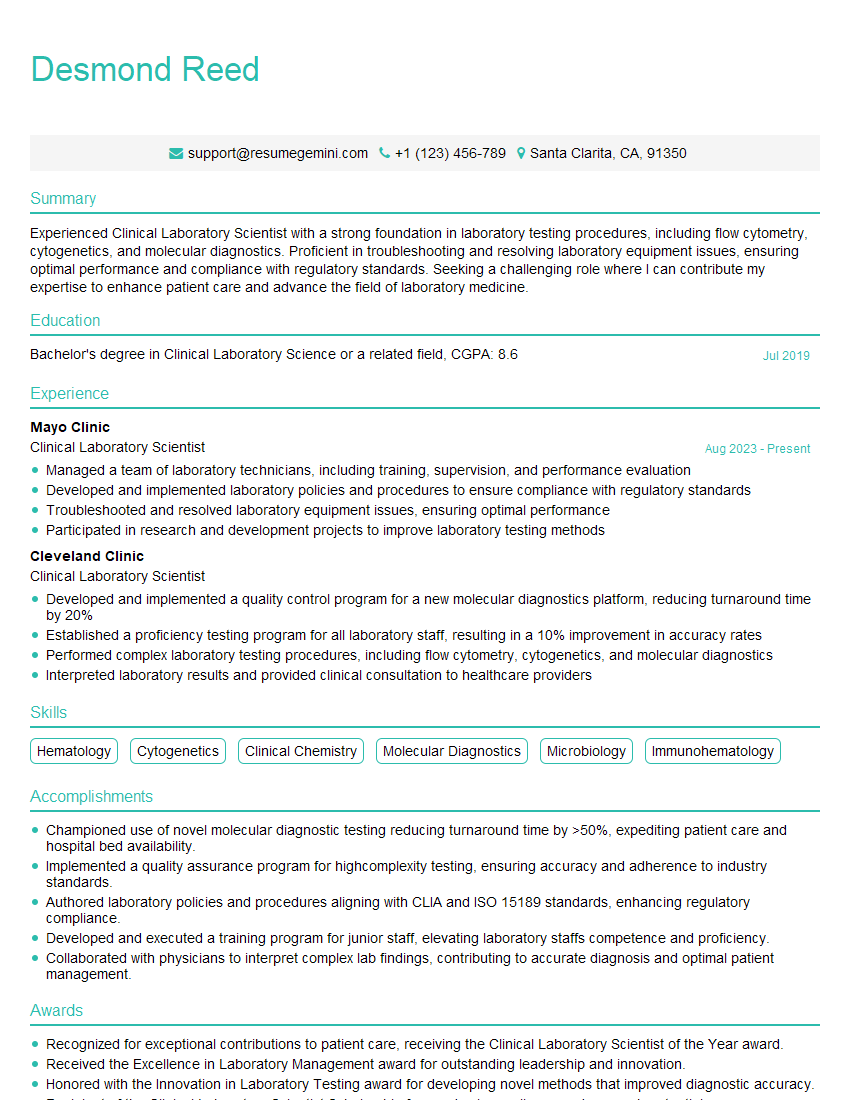
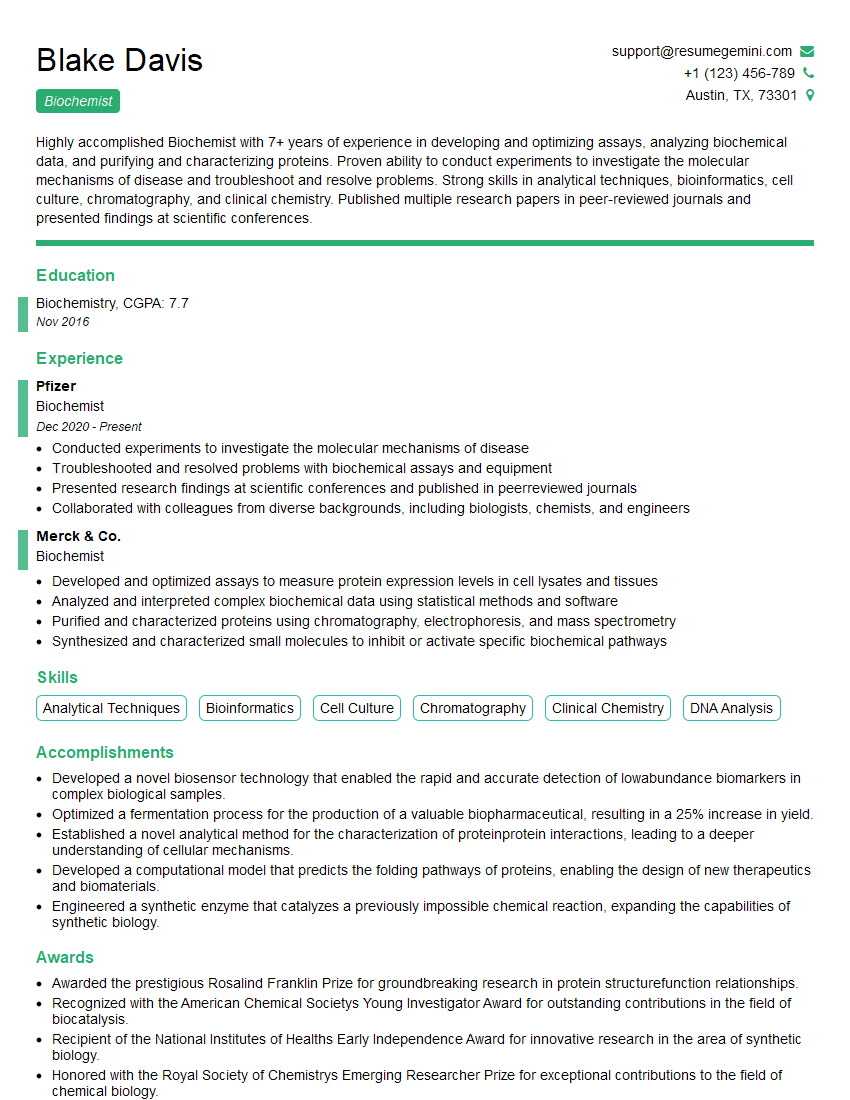
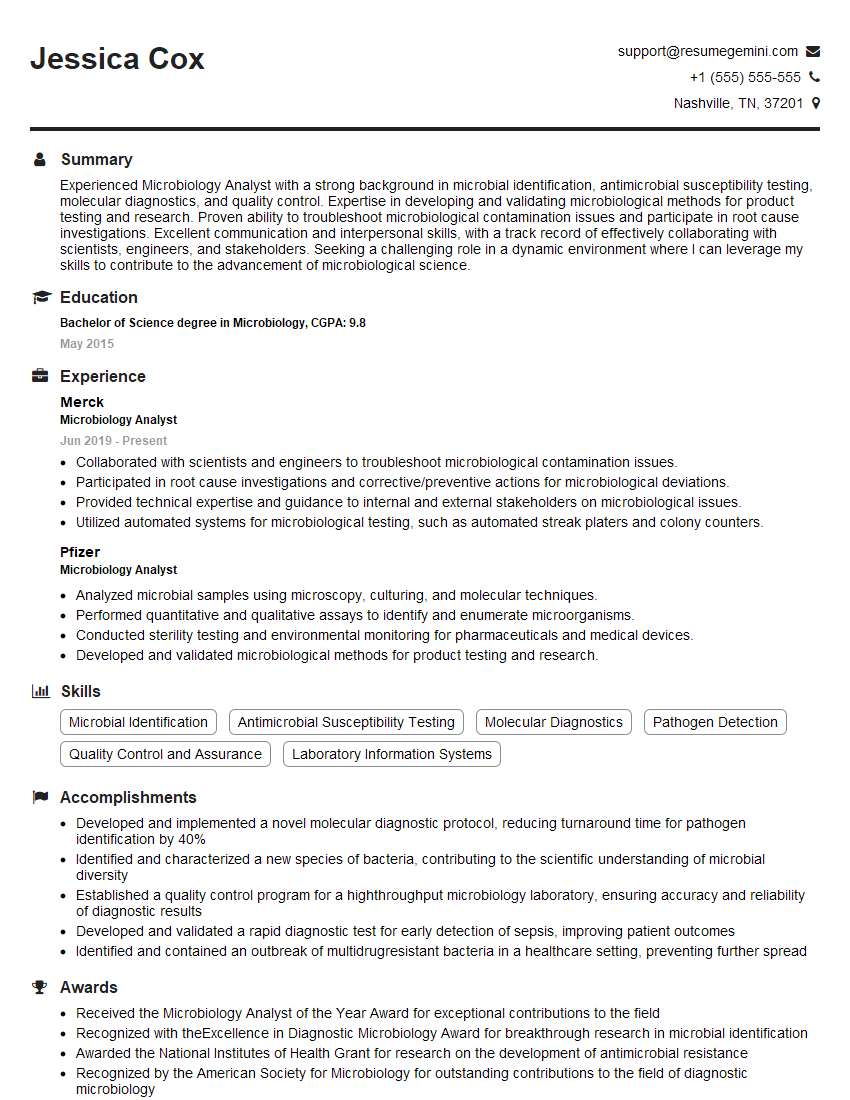
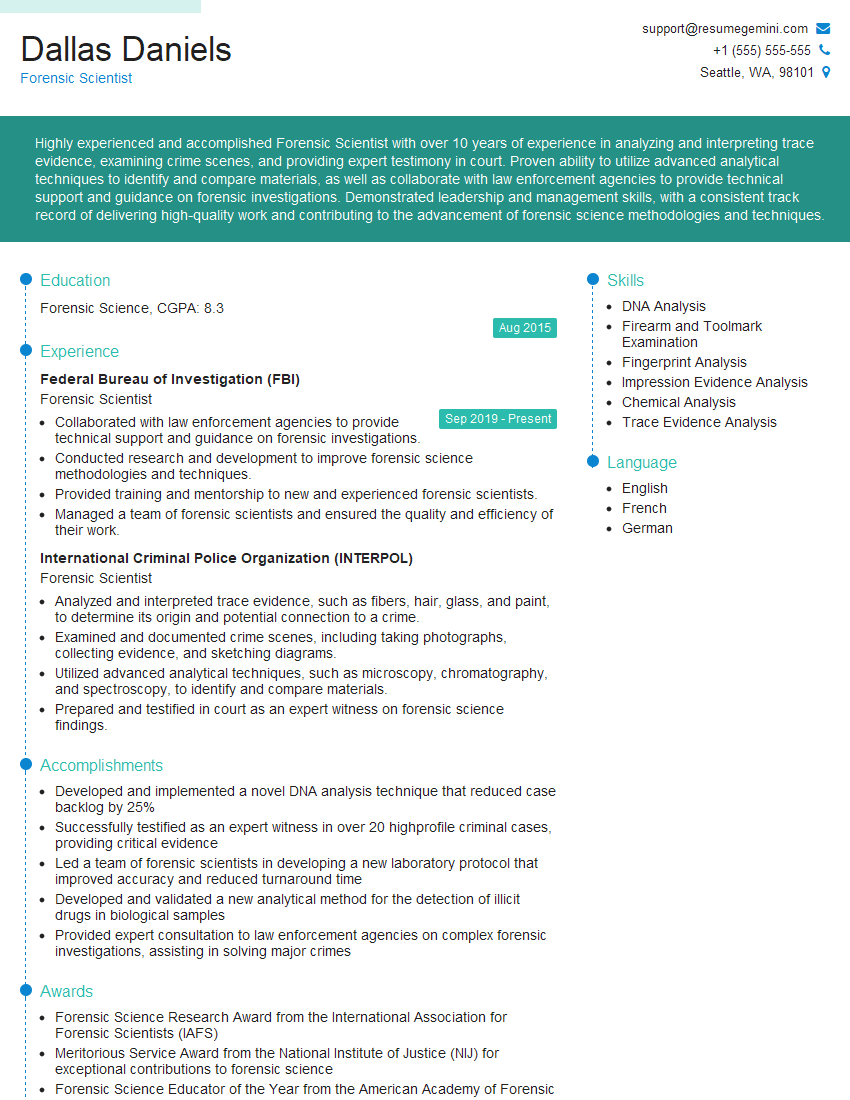
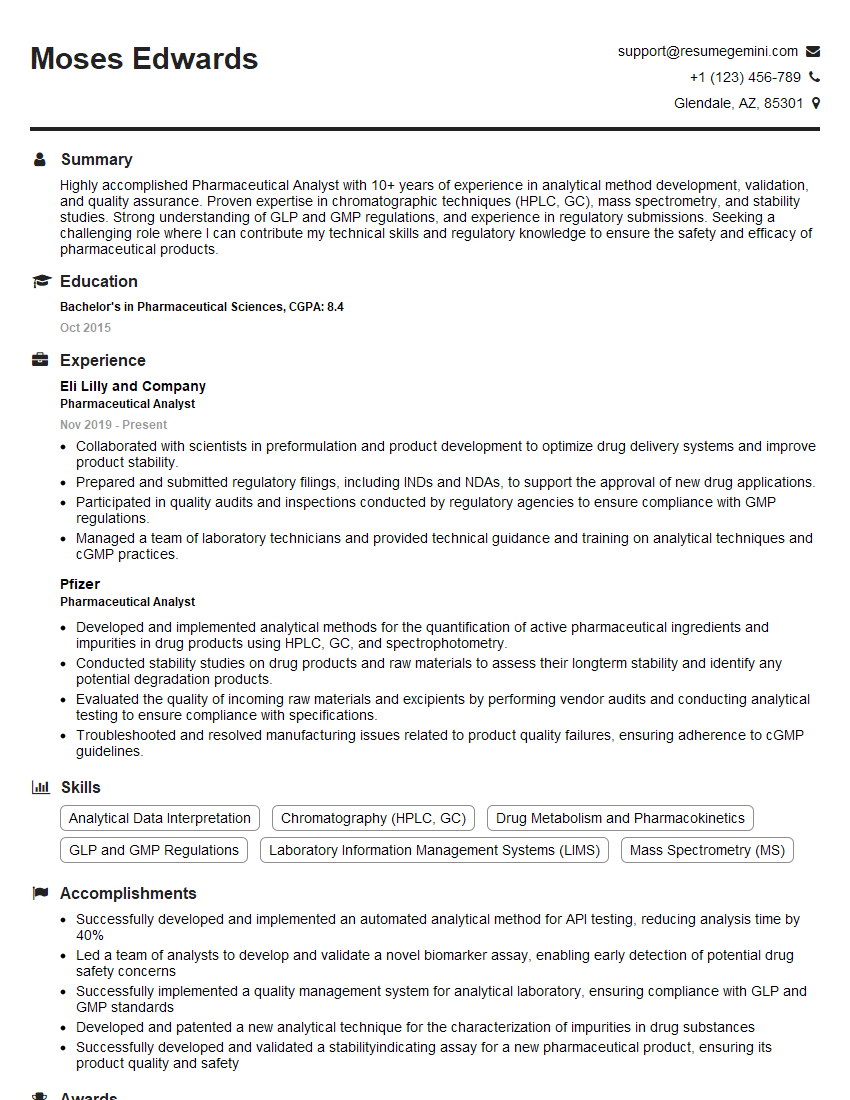
Mastering laboratory analysis methods is key to unlocking exciting career opportunities in research, development, quality control, and many other scientific fields. A strong understanding of these techniques will significantly enhance your employability and open doors to advanced roles and higher earning potential. To maximize your chances of success, create a compelling and ATS-friendly resume that effectively highlights your skills and experience. ResumeGemini is a trusted resource to help you build a professional and impactful resume. We offer examples of resumes tailored to Laboratory analysis methods to guide you through the process and ensure your resume stands out.
Explore more articles
Users Rating of Our Blogs
Share Your Experience
We value your feedback! Please rate our content and share your thoughts (optional).
What Readers Say About Our Blog
Hi, I have something for you and recorded a quick Loom video to show the kind of value I can bring to you.
Even if we don’t work together, I’m confident you’ll take away something valuable and learn a few new ideas.
Here’s the link: https://bit.ly/loom-video-daniel
Would love your thoughts after watching!
– Daniel
This was kind of a unique content I found around the specialized skills. Very helpful questions and good detailed answers.
Very Helpful blog, thank you Interviewgemini team.
