Interviews are more than just a Q&A session—they’re a chance to prove your worth. This blog dives into essential Measuring and Monitoring Equipment interview questions and expert tips to help you align your answers with what hiring managers are looking for. Start preparing to shine!
Questions Asked in Measuring and Monitoring Equipment Interview
Q 1. Explain the principle of operation of a pressure transducer.
Pressure transducers convert pressure into an electrical signal, typically voltage or current. The fundamental principle hinges on the relationship between pressure and a measurable physical change. Many types exist, but a common one is the strain gauge transducer.
In a strain gauge transducer, a thin metallic foil is bonded to a diaphragm. When pressure is applied to the diaphragm, it deflects, causing the strain gauge to deform. This deformation changes the electrical resistance of the strain gauge, according to a predictable relationship. This resistance change is then measured by a Wheatstone bridge circuit, producing an electrical output proportional to the applied pressure. Imagine a tiny, flexible ruler that stretches when you push on it – the strain gauge measures this stretching.
Other types use capacitive or piezoelectric principles. Capacitive transducers measure changes in capacitance as the diaphragm moves, while piezoelectric transducers generate a charge proportional to the applied pressure. The choice of transducer depends on the application’s pressure range, accuracy requirements, and environmental conditions.
Q 2. Describe different types of temperature sensors and their applications.
Temperature sensors are ubiquitous, each with strengths and weaknesses. Common types include:
- Thermocouples: These utilize the Seebeck effect, generating a voltage proportional to the temperature difference between two dissimilar metals. They are robust, have a wide temperature range, but are less precise than other methods. Think of them as small batteries whose voltage changes with temperature.
- Resistance Temperature Detectors (RTDs): These rely on the predictable change in electrical resistance of a material (usually platinum) with temperature. They offer high accuracy and stability but are slower responding than thermocouples. They are like very precise resistors whose resistance changes very slightly with temperature.
- Thermistors: These are semiconductor devices whose resistance changes significantly with temperature. They are very sensitive and inexpensive, but their resistance-temperature relationship isn’t as linear as RTDs, necessitating more complex calibration. They’re like very responsive, temperature-sensitive resistors.
- Infrared (IR) Thermometers: These non-contact sensors measure the infrared radiation emitted by an object, relating it to the object’s temperature. They are useful for measuring temperatures of moving objects or surfaces that cannot be directly touched.
Applications are diverse; thermocouples are commonly used in high-temperature industrial processes, RTDs in precision scientific measurements, thermistors in everyday devices like coffee makers, and IR thermometers in medical and industrial settings.
Q 3. How would you calibrate a digital multimeter?
Calibrating a digital multimeter (DMM) involves comparing its readings to known, accurate standards. The process depends on the functions being calibrated (voltage, current, resistance). It usually requires a calibration source (e.g., precision voltage source, precision resistor).
Here’s a simplified example for calibrating the voltage function:
- Prepare: Gather the DMM, calibration source (e.g., a calibrated power supply), and appropriate test leads.
- Set up: Connect the calibration source to the DMM’s input terminals.
- Adjust (if applicable): Some DMMs have internal calibration adjustments, usually accessed through a specific sequence of button presses. This would typically be done by a qualified technician only.
- Compare: Set the calibration source to a known voltage (e.g., 1.000 V). Compare the DMM’s reading to the known value. Note the difference, which represents the error.
- Document: Record the calibration data (date, voltage setting, DMM reading, and error). Repeat the procedure for multiple voltage settings.
- Adjust (if necessary): Professional calibration often requires specialized equipment and is typically performed by certified labs. If adjustments are allowed, do this carefully, adhering to the instrument’s manual.
Calibration for current and resistance follows similar principles, using appropriate standards (e.g., precision current source, precision resistors).
Q 4. What are the common sources of error in measurement systems?
Measurement errors creep in from various sources, broadly categorized as:
- Systematic Errors: These are consistent and repeatable errors, often stemming from instrument limitations (e.g., zero offset error in a pressure gauge), environmental factors (e.g., temperature affecting a sensor’s reading), or operator bias (e.g., incorrect reading of a scale).
- Random Errors: These are unpredictable variations in readings, often due to noise in the measurement system or inherent variability in the measured quantity. They are often reduced by taking multiple readings and averaging.
- Gross Errors: These are large errors arising from mistakes – misreading, incorrect instrument setup, or faulty equipment. They are easily identified if a measurement is grossly outside the expected range.
Understanding and mitigating these errors is crucial for obtaining reliable measurements. For instance, systematic errors can be addressed through proper calibration, while random errors can be reduced through statistical analysis.
Q 5. Explain the concept of accuracy and precision in measurement.
Accuracy and precision are distinct concepts in measurement:
- Accuracy: Refers to how close a measurement is to the true value. A highly accurate measurement shows a small difference between the measured value and the true value.
- Precision: Refers to how repeatable a measurement is. High precision means multiple measurements of the same quantity yield very similar values, even if they’re not close to the true value.
Think of archery: High accuracy means hitting the bullseye. High precision means all the arrows are grouped closely together, regardless of whether they’re near the bullseye. A measurement can be precise but not accurate (arrows close together, but far from the target), accurate but not precise (arrows scattered but their average is near the bullseye), or both accurate and precise (arrows grouped tightly around the bullseye).
Q 6. How do you handle measurement uncertainties?
Handling measurement uncertainties involves understanding their sources and quantifying their impact. This typically involves:
- Identifying Sources: Analyze the measurement process and identify potential sources of uncertainty (e.g., instrument resolution, calibration uncertainty, environmental effects).
- Quantifying Uncertainties: Assign a numerical value (e.g., ±0.1°C) to each identified source of uncertainty. This often requires referring to manufacturer specifications or calibration certificates.
- Combining Uncertainties: Employ statistical methods (e.g., root-sum-of-squares method) to combine individual uncertainties into a single overall uncertainty for the measurement.
- Reporting Uncertainties: Always report the final measurement along with its associated uncertainty (e.g., 25.0 ± 0.2 °C). This transparently communicates the reliability of the measurement.
By following these steps, we can obtain a realistic assessment of how reliable our measurements are.
Q 7. Describe your experience with data acquisition systems.
My experience with data acquisition systems (DAS) spans several years, encompassing both hardware and software aspects. I’ve worked extensively with various DAS configurations, from simple systems with a few sensors to complex, multi-channel systems monitoring numerous parameters simultaneously.
In previous roles, I’ve been responsible for designing, implementing, and troubleshooting DAS used in diverse applications, including environmental monitoring, industrial process control, and scientific research. This involved selecting appropriate sensors, signal conditioning circuitry, data loggers, and software for data processing and visualization.
My experience includes working with both commercial off-the-shelf (COTS) DAS and custom-designed systems, requiring expertise in analog and digital signal processing, data communication protocols, and programming languages like LabVIEW and Python. I’m comfortable working with various types of sensors, including those mentioned earlier, and with various types of data acquisition hardware, including NI DAQ devices and more generic data loggers.
I’ve also developed expertise in designing systems to minimize noise and interference, ensuring data accuracy and reliability. This often involves careful grounding and shielding techniques and the implementation of noise reduction filters in both the hardware and the software.
Q 8. What software are you familiar with for data analysis and reporting?
For data analysis and reporting, I’m proficient in several software packages. My go-to tools include MATLAB, which is excellent for complex data manipulation and statistical analysis, particularly when dealing with large datasets from various sensors. I also have extensive experience with LabVIEW, a graphical programming environment ideal for instrument control, data acquisition, and real-time analysis in measurement systems. For more general data visualization and reporting, I utilize Microsoft Excel and Power BI. Excel is incredibly versatile for basic analysis and creating clear reports, while Power BI excels at creating interactive dashboards and sharing insights with broader teams. Finally, I’m comfortable with Python libraries like Pandas and NumPy for advanced data processing and analysis, especially when integrating data from multiple sources. For instance, in a recent project involving vibration analysis on a large industrial turbine, I used MATLAB to process the raw sensor data, identifying potential faults, then exported the key findings to a Power BI dashboard for client presentation.
Q 9. Explain the difference between analog and digital signals in measurement.
The core difference between analog and digital signals lies in how they represent information. An analog signal is a continuous representation of a physical quantity, like voltage or temperature. Think of a traditional speedometer needle; its position smoothly reflects the car’s speed. Conversely, a digital signal is a discrete representation, using numerical values. Imagine a digital speedometer displaying the speed as a number—it jumps between discrete values rather than smoothly transitioning. In measurement, an analog sensor directly outputs a continuous signal proportional to the measured quantity (e.g., a thermocouple producing a voltage that changes with temperature). A digital sensor directly outputs a numerical value, often after internal processing (e.g., a digital thermometer with an LCD display). Digital signals are generally more robust to noise and easier to process with computers, but analog signals can provide higher resolution in specific situations. For example, when measuring very subtle changes in pressure, an analog pressure transducer paired with a high-resolution data acquisition system might offer better accuracy than a digital counterpart.
Q 10. How do you troubleshoot malfunctioning measurement equipment?
Troubleshooting malfunctioning measurement equipment is systematic and follows a structured approach. My process typically starts with a visual inspection, checking for obvious issues like loose connections, damaged cables, or physical obstructions. Then, I check the instrument’s calibration status. Is it within its calibration period? If not, recalibration might solve the problem. Next, I verify the power supply and grounding to ensure correct operation. If the equipment involves complex configurations or software, I carefully review the setup and look for errors in parameter settings. For example, if a flow meter reads zero when flow is present, I’d first check for blockages, ensure the power is on and the sensor is correctly oriented, and check the calibration. If the problem persists, I’d consult the equipment’s manual for diagnostics and contact the manufacturer’s technical support.
A methodical approach, combined with knowledge of the equipment’s inner workings, and access to relevant documentation are essential in identifying and resolving these issues. I find that maintaining detailed records of equipment performance is crucial for effective troubleshooting. This way, if performance drifts, I can compare current readings to historical data to pinpoint the issue.
Q 11. What safety precautions do you follow when using measuring equipment?
Safety is paramount when working with measurement equipment. My safety precautions include understanding the specific hazards associated with each instrument. This means reading the manufacturer’s safety data sheet carefully before every use. I always ensure appropriate personal protective equipment (PPE) is worn, such as safety glasses, gloves, and hearing protection, as needed, based on the equipment and environment. I never operate equipment that appears damaged or malfunctioning. Furthermore, I always follow established lockout/tagout procedures before servicing or maintaining equipment to prevent accidental operation. In high-risk environments, I work with a partner to ensure a second set of eyes is on the process. Maintaining a clean and organized workspace reduces the risk of trips and accidents. If I’m working with high-voltage equipment, I always ensure that I have appropriate training and follow all safety protocols. For example, when working with a high-pressure gauge, I’d ensure it’s rated for the pressure involved and properly shielded to prevent injury from sudden bursts.
Q 12. Describe your experience with different types of flow meters.
My experience with flow meters encompasses several types, each suited for specific applications. I’ve worked extensively with differential pressure flow meters (like orifice plates and venturi meters), which measure flow based on pressure drop across a restriction. These are robust and relatively inexpensive but have some pressure drop. I’ve also used positive displacement flow meters (like rotary vane and piston meters), offering high accuracy and are well suited for viscous fluids but can be more expensive and less adaptable to varying flow conditions. Ultrasonic flow meters are another area of my expertise; they measure flow velocity using sound waves and offer non-invasive flow measurement, reducing pressure drop and maintenance requirements. They are well-suited for clean liquids. Finally, I’m familiar with electromagnetic flow meters, ideal for conductive liquids and offering high accuracy, minimal pressure loss and the ability to handle a wide range of fluid viscosities. The choice of flow meter depends on factors like the fluid’s properties (viscosity, conductivity, cleanliness), the required accuracy, the flow rate range, the pressure drop that can be tolerated, and the cost constraints of the project. For instance, in a water treatment plant, I might choose ultrasonic flow meters for their non-invasive nature and ability to handle slurries, whereas in a fuel pipeline, an electromagnetic flow meter would be ideal due to the conductive nature of the fluid and the need for high accuracy.
Q 13. How do you select appropriate measurement equipment for a given application?
Selecting the right measurement equipment involves careful consideration of several factors. First, I identify the measurement parameter – what needs to be measured (temperature, pressure, flow, etc.)? Then, I determine the required accuracy and precision. How much error can be tolerated? What is the smallest change that needs to be detected? Next, I assess the measurement range – what is the expected minimum and maximum value of the parameter? The environmental conditions also play a role, considering factors like temperature, pressure, humidity, and potential hazards. The fluid properties (if applicable) are crucial when selecting flow meters or other fluid-handling equipment. Finally, the budget and availability of equipment are practical constraints that must be addressed. I always choose the equipment with the highest accuracy possible within the budget and operational requirements. For instance, if I needed to measure the temperature of a high-pressure steam line, I’d select a rugged, high-temperature thermocouple with appropriate sheathing to withstand the harsh environment.
Q 14. Explain the importance of traceability in calibration.
Traceability in calibration is essential for ensuring measurement accuracy and reliability. It establishes a chain of comparisons that links the calibration of a measurement instrument to national or international standards. This means that the accuracy of a calibrated instrument can be traced back to a known standard, usually maintained by a national metrology institute. This traceability provides confidence in the measurement results and is crucial for various industries such as pharmaceuticals, aerospace, and manufacturing, where consistent, accurate measurements are vital for quality control and regulatory compliance. If a device is calibrated against a traceable standard, there is a demonstrable chain of evidence to confirm its accuracy and reliability. This chain is often documented using calibration certificates that show the instrument’s calibration history and links it back to the national standards. In short, traceability prevents measurement uncertainty and ensures consistency and comparability of measurements across different laboratories and organizations. For example, in a pharmaceutical company, the accuracy of equipment used to weigh active ingredients must be traceable to national standards to ensure the correct dose is administered. Lack of traceability can lead to faulty measurements, inaccurate products, and significant financial and safety consequences.
Q 15. What are the different types of sensors used for level measurement?
Level measurement sensors come in a variety of types, each suited to different applications and liquid characteristics. The choice depends on factors like the liquid’s viscosity, temperature, pressure, and the level range to be measured.
- Hydrostatic Pressure Sensors: These are simple and cost-effective, measuring the pressure exerted by the liquid column at the sensor’s location. They’re ideal for liquids with known density. A simple example is a pressure transducer at the bottom of a tank.
- Ultrasonic Sensors: These use sound waves to measure the distance to the liquid surface. They’re non-contact and suitable for a wide range of liquids, but can be affected by factors like foam or vapor. Think of them like a sophisticated echolocation system.
- Radar Sensors: Similar to ultrasonic, but using radio waves instead of sound. They are less affected by environmental factors like temperature and pressure fluctuations, and often work well with high-temperature, high-pressure, or corrosive liquids. They are commonly used in oil and gas applications.
- Capacitance Sensors: These measure the change in capacitance between a probe and the tank wall as the liquid level changes. They’re good for liquids with high dielectric constants and are often used in conductive liquids. This works because the liquid changes the electrical field between the probe and the tank.
- Float-type Level Sensors: A simple mechanical system where a float rises and falls with the liquid level, activating a switch or potentiometer. These are reliable and straightforward for relatively low-pressure applications but have limitations in terms of range and accuracy.
- Magnetic Level Gauges: These use a magnetic float inside a tube that moves along with the liquid level. The movement of the float activates a magnetic indicator on the outside of the tube. These are visible, simple, and reliable.
The selection process always involves careful consideration of the specific application and its constraints.
Career Expert Tips:
- Ace those interviews! Prepare effectively by reviewing the Top 50 Most Common Interview Questions on ResumeGemini.
- Navigate your job search with confidence! Explore a wide range of Career Tips on ResumeGemini. Learn about common challenges and recommendations to overcome them.
- Craft the perfect resume! Master the Art of Resume Writing with ResumeGemini’s guide. Showcase your unique qualifications and achievements effectively.
- Don’t miss out on holiday savings! Build your dream resume with ResumeGemini’s ATS optimized templates.
Q 16. How do you ensure the accuracy of your measurements?
Ensuring measurement accuracy is paramount. It involves a multi-faceted approach that starts long before the measurement is taken.
- Calibration: Regular calibration against traceable standards is essential. This verifies the sensor’s output against known values, correcting for any drift or error. Calibration frequency depends on the sensor type, application, and regulatory requirements.
- Sensor Selection: Choosing the right sensor for the specific application is crucial. Factors like temperature, pressure, and liquid properties must be considered to minimize inherent errors.
- Installation: Proper installation is critical. This includes ensuring the sensor is correctly positioned, protected from environmental factors, and securely connected to the signal conditioning and data acquisition system. Incorrect installation is a frequent source of inaccuracy.
- Signal Conditioning: This involves amplifying, filtering, and converting the raw sensor signal into a usable format. Proper signal conditioning helps to eliminate noise and improve the signal-to-noise ratio, which directly impacts accuracy.
- Data Acquisition System: The data acquisition system itself must be regularly checked and calibrated. This includes verifying the accuracy of the analog-to-digital converters (ADCs) and the overall system integrity.
- Regular Checks and Maintenance: Routine checks for things like sensor fouling, corrosion, or mechanical damage help prevent inaccuracies.
We employ documented procedures for calibration, a robust data management system for tracking calibration results and maintenance logs, and statistical process control (SPC) techniques to monitor the overall measurement performance. In short, accuracy isn’t a single step but a continuous effort.
Q 17. Describe your experience with preventative maintenance of measuring equipment.
Preventative maintenance is vital to ensuring the longevity and accuracy of measuring equipment. My experience involves implementing and adhering to a structured program built on a few key principles.
- Regular Inspections: This includes visual inspections for signs of wear, damage, or contamination, as well as checking for loose connections or leaks. Frequency depends on the equipment’s criticality and the operating environment.
- Calibration Schedules: A precise calibration schedule ensures that sensors and instruments are checked and adjusted as needed, maintaining accuracy within acceptable limits. Records are meticulously kept for traceability and regulatory compliance.
- Cleaning Procedures: Depending on the application, sensors and instruments may require regular cleaning to remove build-up or contamination. Specific cleaning solutions and methods are used to avoid damaging the equipment.
- Lubrication: Mechanical components, such as moving parts in float-type level sensors or valves, require periodic lubrication to reduce wear and maintain smooth operation. The type of lubricant used is carefully chosen for compatibility.
- Component Replacement: Proactive replacement of components that are nearing the end of their lifespan or show signs of deterioration prevents unexpected failures and costly downtime. We adhere to manufacturer recommendations and industry best practices.
For example, in a previous role, I implemented a preventative maintenance program for a network of ultrasonic level sensors in a large chemical plant. This program reduced unplanned downtime by 40% in the first year and significantly improved the accuracy and reliability of our inventory management system.
Q 18. What is your experience with statistical process control (SPC)?
Statistical Process Control (SPC) is an essential tool for monitoring and improving the quality of our measurements. I have extensive experience in implementing and interpreting SPC charts to identify trends and variations in measurement data.
- Control Charts: I use various control charts, such as X-bar and R charts, to monitor the central tendency and variability of measurement data over time. These charts help to identify when a process is in or out of statistical control.
- Capability Analysis: I conduct capability studies to assess the ability of a measurement system to meet the required specifications. This helps to identify potential sources of variation and determine if improvements are necessary.
- Root Cause Analysis: When control charts signal out-of-control conditions, I utilize root cause analysis techniques to identify and address the underlying causes of the variation. This often involves examining process parameters, equipment conditions, and operator techniques.
- Data Interpretation: I am adept at interpreting the results of SPC analyses to make informed decisions about process improvements and corrective actions. This involves understanding the implications of process capability indices and other statistical measures.
In a past project, I used SPC to identify a systematic bias in a temperature measurement system within a pharmaceutical manufacturing process. By implementing corrective actions based on the SPC analysis, we significantly reduced measurement error and improved the consistency of our product.
Q 19. How do you interpret measurement data and draw conclusions?
Interpreting measurement data and drawing conclusions is a critical skill. It goes beyond simply looking at numbers; it requires understanding the context, potential sources of error, and the implications of the findings.
- Data Visualization: I use various data visualization techniques, such as charts, graphs, and histograms, to explore the data and identify patterns and trends. This allows for a quick and intuitive understanding of the data.
- Statistical Analysis: I employ appropriate statistical methods to analyze the data, such as calculating means, standard deviations, and correlations. This helps to quantify the uncertainty and variability in the measurements.
- Error Analysis: I carefully consider potential sources of error, both systematic and random, and their impact on the results. This includes evaluating the accuracy and precision of the measurement system.
- Contextual Understanding: I always consider the context of the data, including the application, operating conditions, and any relevant external factors. This helps to avoid misinterpretations and draw meaningful conclusions.
- Reporting and Communication: I clearly communicate my findings in a concise and understandable manner, using appropriate visuals and avoiding technical jargon where possible.
For example, in a recent project involving monitoring the water level in a reservoir, I used statistical methods to identify a seasonal pattern in the water level fluctuations. This information was crucial for optimizing water resource management and preventing water shortages during peak seasons.
Q 20. Explain the concept of signal conditioning.
Signal conditioning is the process of modifying the raw signal from a sensor to make it suitable for use by a data acquisition system or other processing unit. It’s like preparing ingredients before cooking – it’s crucial for a good final result.
- Amplification: Weak signals from sensors often need amplification to improve their signal-to-noise ratio. This ensures the signal is strong enough to be accurately measured.
- Filtering: Sensors often pick up noise or interference. Filters remove unwanted frequencies, leaving only the relevant signal component. There are different filter types, like low-pass, high-pass, and band-pass, each designed to eliminate specific frequencies.
- Linearization: Many sensors don’t produce a perfectly linear output. Linearization techniques compensate for non-linear behavior, ensuring that the output is proportional to the measured quantity. This might involve using look-up tables or mathematical functions.
- Isolation: Isolation protects the data acquisition system from potentially damaging voltages or currents from the sensor. Isolation techniques, such as using optocouplers or transformers, prevent interference and ground loops.
- Conversion: Signal conditioning often involves converting the sensor signal into a standard format, such as voltage or current, for easier processing.
Imagine trying to measure a tiny change in pressure with a very noisy sensor. Signal conditioning acts as a crucial pre-processing step to isolate the subtle pressure changes from the environmental noise for accurate measurements. Without it, accurate measurement is almost impossible.
Q 21. Describe your experience with different types of transducers.
My experience encompasses a wide range of transducers, which convert one form of energy into another for measurement purposes. The choice of transducer is crucial and directly impacts measurement accuracy and application suitability.
- Strain Gauge Transducers: These measure strain, or deformation, of a material. They are commonly used in load cells, pressure sensors, and accelerometers. I’ve worked extensively with strain gauge-based pressure sensors for monitoring process pressures in various industrial settings.
- Piezoelectric Transducers: These generate an electrical charge in response to mechanical stress or pressure. They are often used in accelerometers, microphones, and force sensors. I used these in vibration monitoring applications, ensuring machinery is running smoothly.
- Capacitive Transducers: As mentioned earlier, these measure changes in capacitance to determine level, displacement, or pressure. I’ve used these extensively in level measurement applications, particularly in applications involving liquids with high dielectric constants.
- Inductive Transducers: These utilize electromagnetic induction to measure proximity, displacement, or position. I’ve used these in applications involving metal detection and proximity sensing.
- Optical Transducers: These utilize light to make measurements, including fiber optic sensors for temperature or strain measurement. I have experience using these in high-temperature applications where traditional methods are impractical.
The choice of transducer depends heavily on the measured quantity, the environmental conditions, required sensitivity, and overall cost considerations. My experience allows me to select and implement the best solution based on the needs of each unique scenario.
Q 22. How do you deal with conflicting measurement data?
Conflicting measurement data is a common challenge in any measurement system. It arises when multiple measurements of the same parameter yield significantly different results. Identifying and resolving these conflicts is crucial for ensuring data accuracy and reliability. My approach involves a systematic investigation, starting with a review of the measurement process itself.
- Verify Equipment Calibration: The first step is to ensure that all instruments involved are properly calibrated and traceable to national or international standards. Inaccurate or poorly maintained equipment is a major source of conflicting data. For instance, if we’re measuring temperature with two different thermocouples, one improperly calibrated might give drastically different readings compared to a properly calibrated one.
- Check Measurement Techniques: Next, I examine the procedures used for data acquisition. Inconsistent application of measurement methods – such as differences in sampling rates, environmental conditions (temperature, humidity), or operator technique – can easily lead to discrepancies. A simple example would be measuring the length of a component using a ruler – different observers might read the measurement slightly differently if not using consistent techniques.
- Analyze Data Patterns: I carefully analyze the conflicting data points to look for patterns or trends. Are the discrepancies random, or do they show systematic bias? Statistical methods, such as calculating the mean, standard deviation, and identifying outliers, are vital in this stage. Outliers can often indicate faulty equipment or other anomalies needing further investigation.
- Identify and Eliminate Sources of Error: Based on the analysis, I work to pinpoint and eliminate the sources of error. This might involve replacing faulty equipment, improving measurement techniques, controlling environmental variables, or even re-designing the measurement setup. For example, if environmental vibration is affecting a precise length measurement, we might need to use a vibration isolation table.
- Document and Report: Finally, it is essential to document all the steps taken, the findings, and any corrective actions implemented. A detailed report helps ensure transparency and traceability, crucial for maintaining data integrity and preventing similar issues in the future.
Q 23. What are your experience with different types of data loggers?
My experience encompasses a wide range of data loggers, from simple, stand-alone units to sophisticated, networked systems. I’ve worked extensively with various types, including:
- Temperature Data Loggers: These are commonly used in environmental monitoring, industrial processes, and food safety applications. I’ve used both thermocouple-based and resistance temperature detector (RTD) based loggers, each with its strengths and weaknesses in terms of accuracy, range, and cost. For example, thermocouples offer wider temperature ranges, but RTDs provide higher accuracy in specific ranges.
- Pressure Data Loggers: I have experience using pressure loggers for various applications, from monitoring hydraulic systems to assessing atmospheric conditions. Different types exist, including those using strain gauge transducers, piezoelectric sensors, and capacitive sensors. The choice depends on the application’s required accuracy, pressure range, and environmental conditions.
- Humidity Data Loggers: These are crucial for monitoring environmental conditions in sensitive applications, such as storage facilities for pharmaceuticals or electronics. I’ve used loggers employing capacitive or resistive sensors, selecting the appropriate type based on factors such as response time and stability.
- Multi-parameter Data Loggers: These can simultaneously measure multiple parameters like temperature, humidity, pressure, and light intensity, providing a more holistic view of environmental conditions. This is very useful for applications like climate-controlled labs or greenhouses.
My experience extends beyond just using these loggers. I am proficient in configuring data logger settings, downloading and analyzing data, and troubleshooting potential issues like sensor malfunctions or communication problems. I’m also familiar with various communication protocols, including USB, RS-232, and Ethernet, used for connecting data loggers to computers and networks.
Q 24. Explain your understanding of calibration standards and certifications.
Calibration standards and certifications are fundamental to ensuring the accuracy and reliability of measurement equipment. Calibration ensures that instruments provide readings that are traceable to nationally or internationally recognized standards. This traceability is achieved through a chain of comparisons, starting from a primary standard maintained by a national metrology institute and going down to the individual measuring instrument.
Calibration Standards: These are established by national or international organizations like NIST (National Institute of Standards and Technology) or ISO (International Organization for Standardization). These standards define the procedures and tolerances for calibrating specific types of instruments. For example, a temperature calibration standard will specify the acceptable uncertainty for a thermometer at different temperature points.
Certifications: Calibration certifications are documents that demonstrate that an instrument has been calibrated according to a recognized standard. These certificates usually include the calibration date, the results of the calibration, the uncertainty associated with the measurements, and the due date for the next calibration. ISO 17025 accreditation is often sought by calibration labs, indicating they meet internationally recognized quality standards.
Understanding calibration standards and certifications is crucial because it ensures the comparability of measurement results across different locations and timeframes. Using a poorly calibrated instrument can lead to inaccurate measurements, potentially resulting in costly errors or even safety hazards in industrial settings. In my experience, strict adherence to these standards is paramount, and I always ensure that our equipment is properly calibrated and certified.
Q 25. How do you ensure data integrity in measurement systems?
Data integrity in measurement systems is paramount. It means ensuring that data is accurate, complete, consistent, and trustworthy throughout its lifecycle. My approach to ensuring data integrity involves several key strategies:
- Calibration and Verification: Regular calibration and verification of measuring instruments are crucial first steps. This confirms that the equipment is providing accurate and reliable measurements.
- Data Acquisition Procedures: Well-defined data acquisition procedures minimize errors. This includes specifying sampling rates, averaging techniques, and data storage methods. A clear protocol minimizes the possibility of manual data entry errors.
- Data Validation and Error Checking: Implementing data validation checks, like range checks and plausibility checks, helps identify and correct errors during the data acquisition process. For instance, we might check if a temperature reading falls within a reasonable range for the given environment. Automated checks can save a significant amount of time compared to manual inspections.
- Secure Data Storage and Management: Data should be stored securely and managed according to established protocols. This includes using secure storage systems, implementing data backups, and controlling access to the data. Consideration should be given to data security and compliance with relevant regulations (like GDPR for example).
- Chain of Custody and Traceability: Maintaining a complete chain of custody helps ensure that the data’s origin and handling are fully documented. This traceability is essential for audits and legal purposes.
- Data Logging and Archival: Implementing a robust data logging and archival system allows for data tracking and retrieval, which is invaluable for identifying trends, troubleshooting issues, and meeting regulatory compliance requirements.
By rigorously implementing these strategies, we can significantly enhance data integrity and confidence in the results obtained from the measurement system.
Q 26. Describe your experience with automated testing and measurement systems.
I have significant experience with automated testing and measurement systems, having worked on projects that involved integrating various sensors, data acquisition hardware, and software for automated data collection and analysis. My experience includes:
- Designing and Implementing Automated Test Systems: I’ve been involved in designing and implementing automated systems for various applications, including environmental monitoring, quality control in manufacturing, and performance testing of electronic components. This involves selecting appropriate sensors, developing custom software for data acquisition and control, and integrating various hardware components.
- Programming and Scripting: Proficiency in programming languages like LabVIEW, Python, and MATLAB is crucial for developing custom software for automated systems. I’ve used these languages to write scripts for automated data collection, analysis, and reporting.
- Data Acquisition Hardware: I’m familiar with various data acquisition hardware, including NI DAQ systems and other specialized hardware for specific applications. I understand the nuances of different sampling rates, resolution, and other specifications.
- Data Analysis and Reporting: Automated systems typically generate large amounts of data. I’m proficient in using software tools to analyze this data, identify trends, and generate comprehensive reports. This frequently involves custom algorithms and statistical analyses.
For example, I was once involved in automating the testing of a new type of pressure sensor. I developed a LabVIEW program that controlled a pneumatic system, acquired pressure readings from the sensor under test, compared the readings to a reference standard, and generated a report showing the sensor’s accuracy and linearity. This automated system significantly improved testing efficiency and reduced the possibility of human error.
Q 27. What are some common challenges in measuring and monitoring equipment and how have you addressed them?
Several common challenges exist when dealing with measuring and monitoring equipment. These include:
- Environmental Factors: Temperature, humidity, vibration, and electromagnetic interference can significantly affect the accuracy of measurements. I’ve addressed this by using environmentally sealed sensors, implementing temperature compensation algorithms, and employing vibration isolation techniques.
- Sensor Drift and Degradation: Sensors can drift over time due to aging or environmental factors. Regular calibration and replacement of sensors are crucial to mitigate this issue. Statistical process control (SPC) techniques can help detect and address drift early.
- Data Acquisition Issues: Problems with data acquisition hardware, such as noisy signals or communication errors, can lead to inaccurate data. Troubleshooting these issues often involves careful examination of wiring, grounding, and signal conditioning.
- Software Errors: Bugs in the software used to control and analyze data can compromise the integrity of the measurements. Thorough software testing and version control are crucial to prevent errors.
- Cost and Complexity: Implementing advanced measurement systems can be expensive and complex. Careful planning and selection of appropriate equipment are necessary to balance cost with functionality.
My approach to addressing these challenges involves a proactive strategy emphasizing preventative maintenance, rigorous testing, and careful selection of equipment. Proper documentation and training also play key roles in preventing issues and ensuring efficient troubleshooting. For instance, in a project involving high-precision measurements, we invested in a highly stable environmental chamber to minimize temperature and humidity variations, directly addressing the challenge of environmental factors.
Key Topics to Learn for Measuring and Monitoring Equipment Interview
- Sensor Technologies: Understanding various sensor types (e.g., pressure, temperature, flow, level), their operating principles, accuracy, and limitations. Consider exploring different sensor interfaces and communication protocols.
- Data Acquisition Systems (DAS): Learn about the architecture and functionality of DAS, including signal conditioning, analog-to-digital conversion (ADC), and data logging. Practice explaining how to troubleshoot common DAS issues.
- Signal Processing and Analysis: Familiarize yourself with techniques for filtering, noise reduction, and data analysis relevant to the measurements. Be prepared to discuss different signal processing algorithms and their applications.
- Calibration and Verification: Master the procedures for calibrating and verifying measuring equipment to ensure accuracy and traceability. Understand relevant standards and best practices.
- Instrumentation and Control Systems: Gain a solid understanding of how measuring equipment integrates with control systems, including feedback loops and automation. Be ready to discuss practical examples.
- Safety and Regulations: Know the relevant safety regulations and standards related to the handling and operation of measuring and monitoring equipment in your specific field.
- Troubleshooting and Maintenance: Develop your skills in identifying and resolving common problems with measuring equipment. Be prepared to discuss preventative maintenance strategies.
- Specific Equipment Knowledge: Depending on the job description, deeply understand the specific types of measuring and monitoring equipment used in the target role. Research the manufacturers and models mentioned.
Next Steps
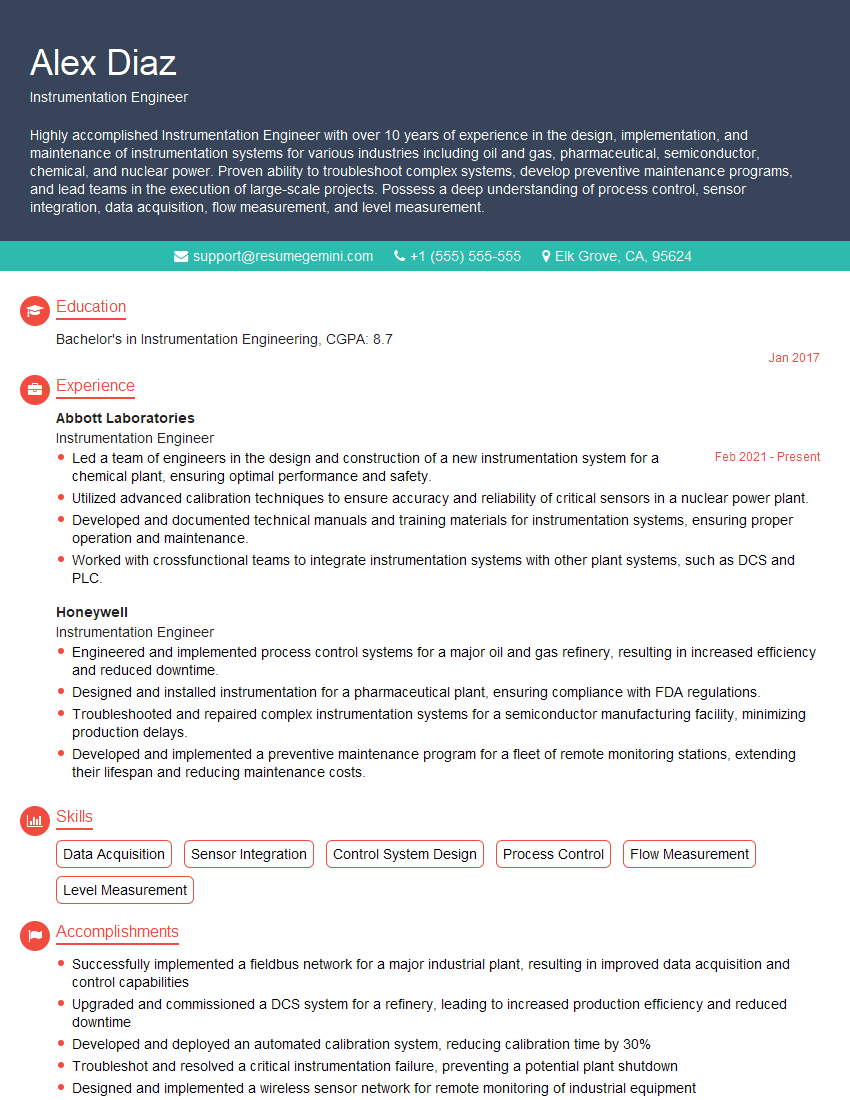
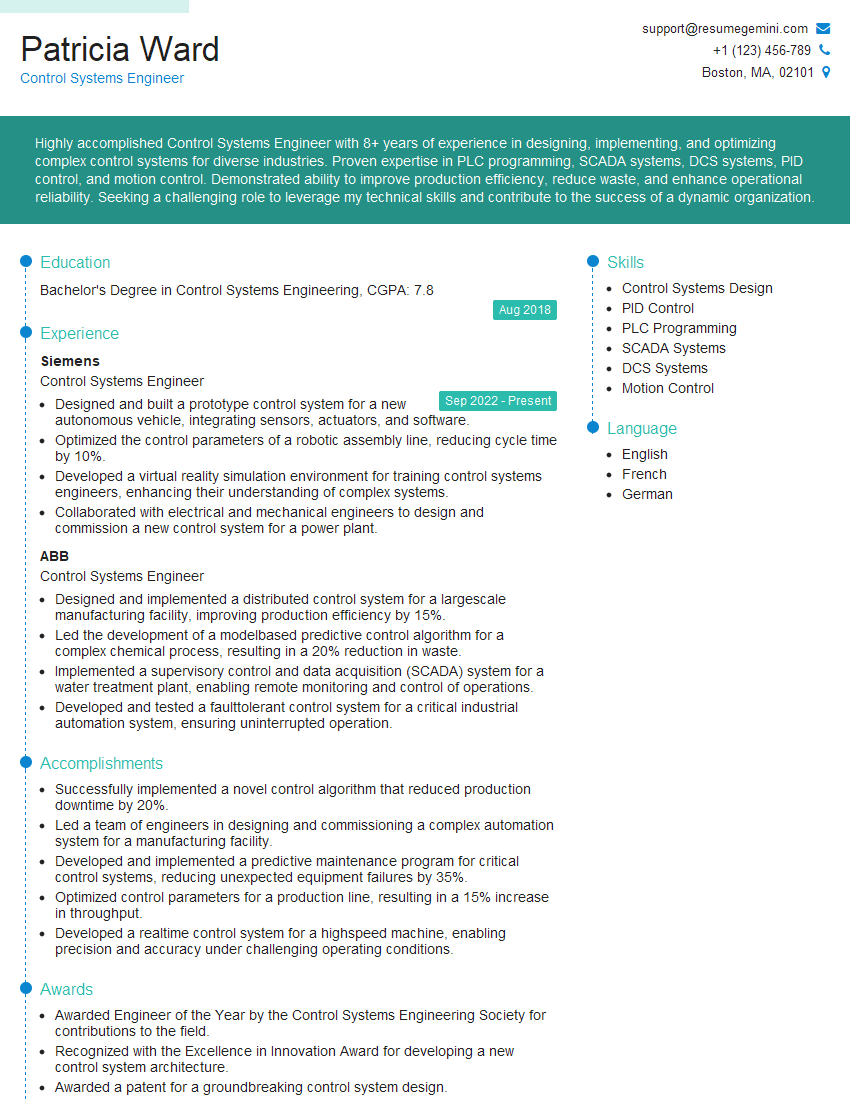
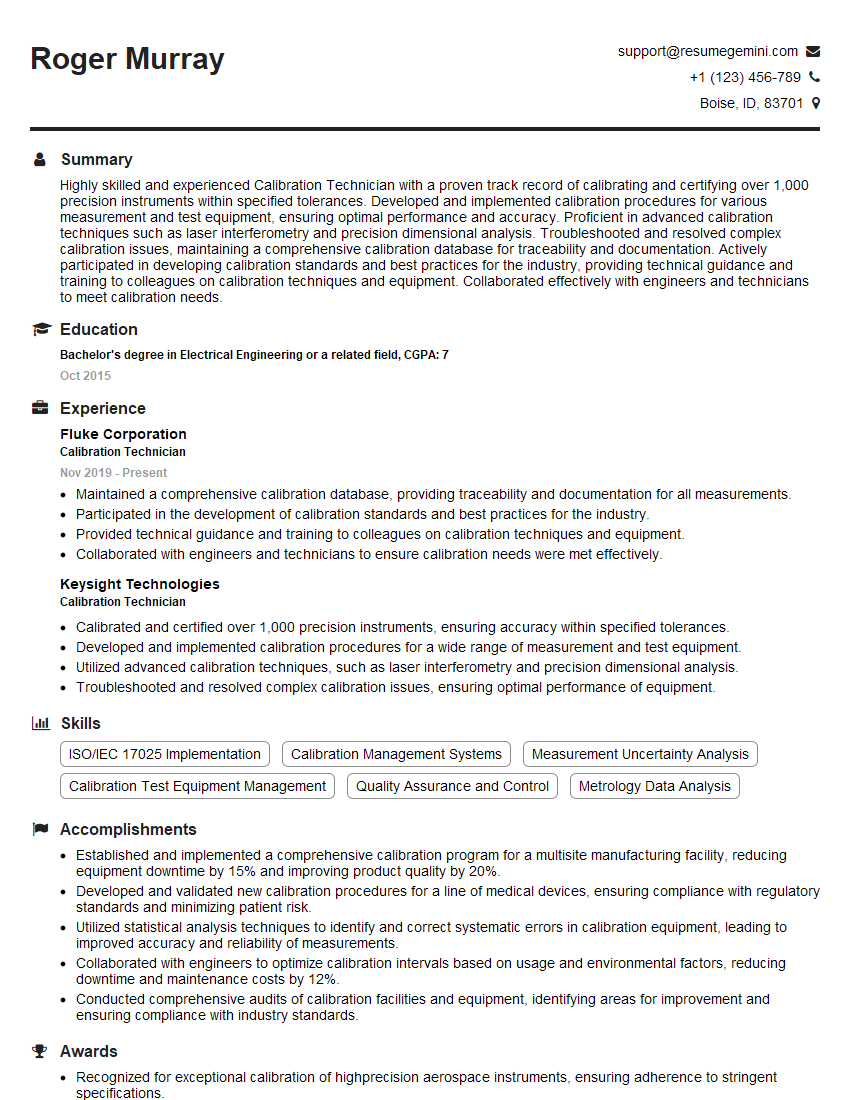
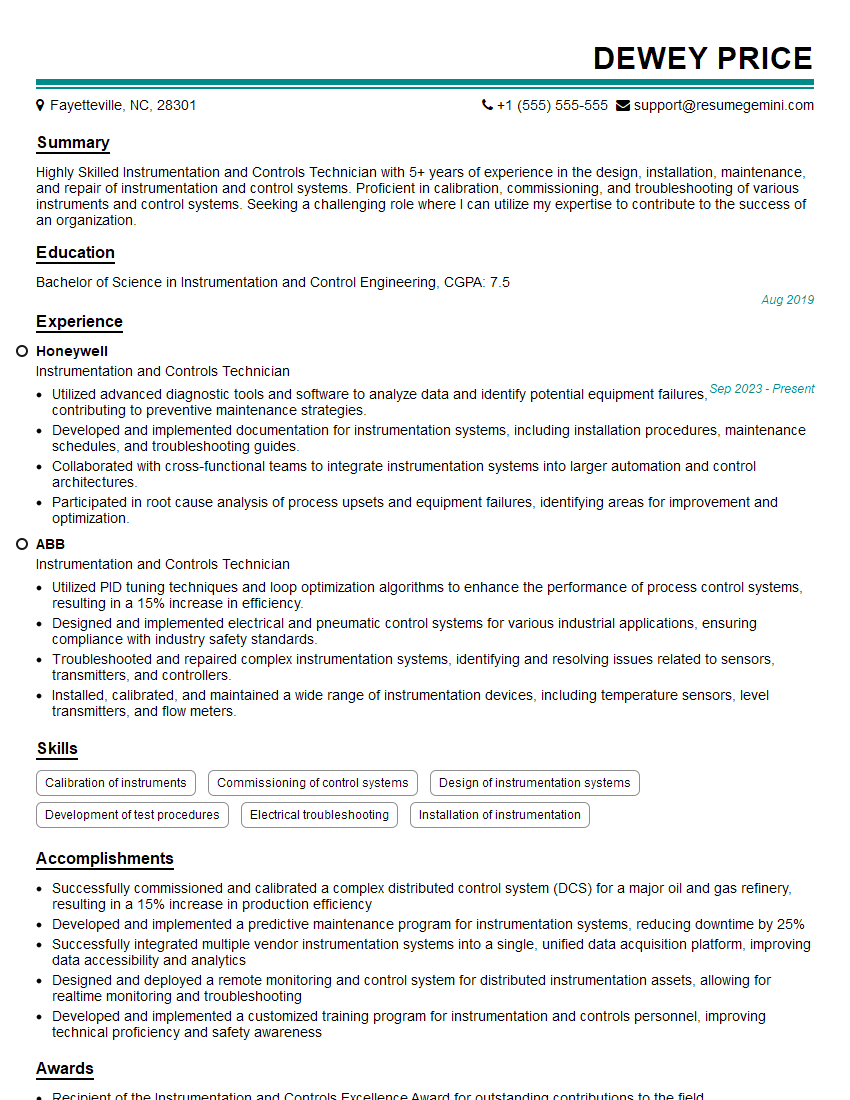
Mastering Measuring and Monitoring Equipment is crucial for career advancement in this dynamic field. A strong understanding of these principles will significantly improve your interview performance and open doors to exciting opportunities. To maximize your job prospects, crafting a compelling and ATS-friendly resume is essential. ResumeGemini is a trusted resource to help you build a professional resume that highlights your skills and experience effectively. Examples of resumes tailored to Measuring and Monitoring Equipment roles are available within ResumeGemini to help guide you.
Explore more articles
Users Rating of Our Blogs
Share Your Experience
We value your feedback! Please rate our content and share your thoughts (optional).
What Readers Say About Our Blog
To the interviewgemini.com Webmaster.
Very helpful and content specific questions to help prepare me for my interview!
Thank you
To the interviewgemini.com Webmaster.
This was kind of a unique content I found around the specialized skills. Very helpful questions and good detailed answers.
Very Helpful blog, thank you Interviewgemini team.


