Interviews are opportunities to demonstrate your expertise, and this guide is here to help you shine. Explore the essential Observation and Monitoring interview questions that employers frequently ask, paired with strategies for crafting responses that set you apart from the competition.
Questions Asked in Observation and Monitoring Interview
Q 1. Describe your experience with different monitoring tools and technologies.
My experience with monitoring tools and technologies spans a wide range, from basic system logging to sophisticated, distributed monitoring systems. I’ve worked extensively with tools like Prometheus and Grafana for metrics-based monitoring, providing real-time visibility into system performance. For log management and analysis, I’m proficient in tools such as Elasticsearch, Logstash, and Kibana (the ELK stack), which allow for powerful searching, filtering, and visualization of log data. I’ve also utilized Nagios and Zabbix for infrastructure monitoring, setting up alerts based on predefined thresholds. Furthermore, I have experience with cloud-native monitoring solutions like Datadog and CloudWatch, leveraging their capabilities for scaling and automated alerting in dynamic cloud environments. Each tool offers unique strengths; for instance, Prometheus excels in its scalability and ability to scrape metrics from various sources, while Datadog provides a comprehensive platform with integrated dashboards and anomaly detection.
My experience isn’t just limited to using these tools; I understand their underlying architectures and can effectively configure, customize, and integrate them into broader monitoring strategies. For example, I’ve integrated Prometheus metrics into Grafana dashboards to provide interactive visualizations for operational teams, enabling faster identification and resolution of performance bottlenecks.
Q 2. How do you prioritize alerts and identify critical issues in a monitoring system?
Prioritizing alerts and identifying critical issues requires a multi-faceted approach. It starts with a well-defined alerting strategy that leverages severity levels (e.g., critical, warning, informational) and considers the impact of an issue on the business. I use a combination of techniques including:
- Severity-based filtering: Critical alerts, indicating significant system failures or service outages, are given immediate attention. Warnings might trigger investigations, while informational alerts are often used for auditing or trend analysis.
- Alert deduplication: Many monitoring systems generate multiple alerts for a single root cause. Deduplication mechanisms are crucial to avoid alert fatigue and ensure efficient incident response.
- Contextual information: Rich alert context, including affected systems, error messages, and relevant metrics, aids in swift diagnosis. I prioritize alerts with detailed information providing clear indications of the root cause.
- Automated runbooks: For recurring issues, I develop automated runbooks or playbooks that provide step-by-step instructions for remediation, reducing response times and enhancing consistency.
- Correlation analysis: Sophisticated monitoring systems can correlate alerts across different systems and identify underlying patterns. This helps in identifying cascading failures and addressing the root cause, rather than just treating the symptoms.
For instance, in a previous role, we implemented an alert correlation engine that automatically grouped related alerts, drastically reducing the number of incidents needing investigation and improving our mean time to resolution (MTTR).
Q 3. Explain your experience with developing and implementing monitoring procedures.
Developing and implementing monitoring procedures involves a systematic approach that begins with a clear understanding of the monitored systems and their dependencies. The process includes:
- Defining monitoring objectives: What are we trying to achieve through monitoring? This could involve ensuring high availability, optimizing performance, or detecting security threats.
- Identifying key metrics: Determining the specific metrics to monitor – CPU utilization, memory usage, network latency, database query times, application errors, etc. – depends on the specific system and objectives.
- Establishing thresholds: Setting thresholds for alerts based on historical data and acceptable performance levels. This requires a balance between sensitivity (avoiding false positives) and responsiveness (detecting actual issues quickly).
- Choosing appropriate tools: Selecting tools that best meet the requirements based on scalability, cost, and integration capabilities.
- Implementing and testing: Deploying the monitoring system, configuring alerts, and performing thorough testing to verify its functionality and accuracy.
- Documentation and training: Creating clear documentation to guide users on how to use and interpret the monitoring data and providing training to team members on incident response procedures.
In one project, I developed a comprehensive monitoring system for a large e-commerce platform, incorporating metrics for application performance, database health, network infrastructure, and security logs. This system played a crucial role in preventing major outages during peak shopping seasons.
Q 4. What metrics do you typically monitor and why?
The specific metrics I monitor vary based on the system or application, but generally include:
- System metrics: CPU utilization, memory usage, disk I/O, network bandwidth, and latency.
- Application metrics: Request latency, error rates, throughput, and queue lengths. Specific application metrics will depend on the application architecture and functionalities.
- Database metrics: Query execution times, connection pool sizes, and transaction rates.
- Log data: Error messages, warning messages, and informational messages providing insights into application behavior and potential issues.
- Business metrics: Key performance indicators (KPIs) such as order processing time, conversion rates, and customer satisfaction scores, providing insights into the business impact of system performance.
The rationale behind monitoring these metrics is to maintain system health, optimize performance, identify potential bottlenecks, and ensure service availability. For example, monitoring application error rates allows for prompt identification and resolution of bugs impacting users, thus contributing to overall customer satisfaction and business continuity.
Q 5. How do you ensure the accuracy and reliability of your monitoring data?
Ensuring the accuracy and reliability of monitoring data is paramount. My approach involves:
- Data validation: Implementing checks to validate data integrity and identify potential anomalies or errors. This might involve comparing metrics from multiple sources or applying statistical analysis to detect outliers.
- Regular calibration: Periodically calibrating monitoring tools and sensors to ensure they are providing accurate readings.
- Redundancy and failover: Building redundant monitoring systems to prevent single points of failure. This ensures continued monitoring even if one component fails.
- Data aggregation and normalization: Aggregating data from various sources and normalizing it to facilitate comparison and analysis.
- Automated testing: Implementing automated tests to validate the functionality and accuracy of monitoring systems and alerts.
For example, in one instance, we discovered a discrepancy in CPU utilization readings between our primary and secondary monitoring systems. Through careful investigation, we identified a misconfiguration in one of the sensors, which was promptly rectified, improving the reliability of our monitoring data.
Q 6. Describe a situation where you had to troubleshoot a complex monitoring issue.
During a recent incident, we experienced a sudden surge in database query latency, impacting the responsiveness of our web application. Initial alerts pointed to a database performance issue, but further investigation revealed that the issue originated from an unexpected spike in traffic from a specific geographic region. The increased load overwhelmed a portion of our caching infrastructure, leading to an increased number of database queries and consequently, high latency.
The troubleshooting process involved:
- Analyzing logs: Examining application logs and database logs to identify patterns and root causes.
- Investigating metrics: Analyzing database query performance metrics to pinpoint bottlenecks.
- Monitoring network traffic: Analyzing network traffic patterns to understand the source and nature of the increased traffic.
- Using debugging tools: Employing profiling and debugging tools to further pinpoint problematic code sections.
- Scaling infrastructure: Scaling out the caching infrastructure to handle the increased traffic.
The resolution involved not only addressing the immediate issue but also implementing preventive measures, including adding more robust caching capabilities and improving traffic distribution. This experience highlighted the importance of correlating alerts and considering various contributing factors when troubleshooting complex monitoring issues.
Q 7. How do you handle a high volume of alerts or incidents?
Handling a high volume of alerts or incidents effectively requires a structured approach. This involves:
- Alert filtering and prioritization (as discussed in Question 2): Focusing on critical alerts first and using effective filtering to reduce noise.
- Automated response mechanisms: Automating responses to common issues using runbooks and playbooks.
- Incident management system: Utilizing an incident management system to track and manage incidents, ensuring efficient collaboration and communication within the team.
- Escalation procedures: Establishing clear escalation paths to ensure issues are addressed by the appropriate personnel.
- Root cause analysis: Performing thorough root cause analysis to understand the underlying reasons for recurring incidents and implementing preventative measures.
- Alert threshold adjustment: Revisiting and adjusting alert thresholds to reduce unnecessary alerts while ensuring critical issues are still flagged.
In situations with an overwhelming number of alerts, it’s crucial to remain calm and focused, systematically working through the issues according to their severity and impact. Efficient communication and collaboration within the team are also key to effective incident management in such scenarios.
Q 8. What are some common challenges in observation and monitoring, and how have you overcome them?
Observation and monitoring, while crucial for understanding system behavior, present several challenges. Data volume is often a significant hurdle; dealing with massive datasets requires efficient storage, processing, and analysis techniques. Another challenge is the diversity of data sources – integrating data from disparate systems (databases, logs, network devices) requires careful planning and robust integration strategies. Finally, establishing meaningful baselines and thresholds for detecting anomalies can be tricky, especially in dynamic environments where ‘normal’ behavior fluctuates.
To overcome these, I’ve employed several strategies. For data volume, I’ve used techniques like data aggregation, sampling, and employing distributed processing frameworks like Apache Spark. For data integration, I’ve leveraged ETL (Extract, Transform, Load) processes and standardized data formats (like JSON or Avro) to ensure interoperability. For baseline establishment, I use statistical methods, including moving averages and machine learning algorithms to identify patterns and adjust thresholds dynamically, adapting to evolving system behavior. For example, in monitoring a web server, I might use an exponentially weighted moving average to track request rates and set alerts when deviations exceed a predefined percentage from the average.
Q 9. How do you identify and report anomalies or deviations from expected behavior?
Identifying and reporting anomalies relies on a multi-pronged approach. First, establishing clear baselines and thresholds, as discussed earlier, is vital. This allows me to define what constitutes ‘normal’ behavior and trigger alerts when deviations are detected. Second, I utilize anomaly detection algorithms, ranging from simple threshold-based alerts to more sophisticated machine learning models (e.g., One-Class SVM, Isolation Forest). These algorithms analyze the data and identify unusual patterns. Finally, effective visualization is crucial; dashboards and reports that clearly display key metrics and highlight anomalies allow for rapid identification and investigation.
For example, in a network monitoring system, if packet loss suddenly increases above a predefined threshold, the system would automatically generate an alert. Similarly, if an application performance metric (e.g., response time) deviates significantly from its established baseline, an alert will be triggered. The alert would typically include the timestamp, the affected system, the metric that deviated, and the severity of the deviation. These are then logged and investigated.
Q 10. What is your experience with real-time monitoring versus retrospective analysis?
Real-time monitoring and retrospective analysis serve distinct but complementary purposes. Real-time monitoring focuses on immediate detection of issues, enabling prompt responses to prevent service disruptions or security breaches. It involves continuously monitoring systems and generating alerts in real-time. Retrospective analysis, conversely, examines historical data to understand trends, identify root causes of past incidents, and improve future monitoring strategies. It might involve querying historical logs or databases.
My experience encompasses both. In a recent project involving a large e-commerce platform, we implemented real-time monitoring using a centralized logging and alerting system. This allowed us to quickly identify and resolve issues impacting customer experience. Post-incident, retrospective analysis helped us pinpoint the root causes, optimize system configurations, and improve the monitoring system’s effectiveness. For instance, we found a specific database query was consistently slowing down under high load, which was not apparent in the real-time data.
Q 11. How familiar are you with different types of monitoring systems (e.g., network, application, security)?
My experience spans various monitoring systems. I’m proficient with network monitoring tools (like Nagios, Zabbix, PRTG), which track network performance metrics such as bandwidth utilization, latency, and packet loss. I’m also familiar with application performance monitoring (APM) tools (like Dynatrace, New Relic, AppDynamics) that monitor the performance of applications, providing insights into response times, error rates, and resource utilization. Further, I have experience with security information and event management (SIEM) systems (like Splunk, QRadar, LogRhythm), which collect and analyze security logs to detect and respond to security threats. In each case, my focus is on aligning the choice of system to the specific needs and criticality of the monitored assets.
Q 12. Describe your experience with data visualization and reporting in a monitoring context.
Data visualization and reporting are fundamental to effective monitoring. I’ve extensively used tools like Grafana, Kibana, and Tableau to create dashboards that present key metrics in a clear, concise, and actionable manner. These dashboards are tailored to different audiences, from technical teams needing detailed information to business stakeholders requiring high-level overviews. For example, I’ve created dashboards displaying real-time metrics on server load, application response times, and network bandwidth usage. Reporting, often in the form of scheduled reports or ad-hoc analyses, summarizes key performance indicators (KPIs), highlighting trends and anomalies over specific periods. My reports are designed to provide clear narratives and support decision-making, often including charts, graphs, and tables for clear interpretation.
Q 13. How do you ensure that your monitoring procedures comply with relevant regulations and standards?
Compliance is paramount. Monitoring procedures must adhere to relevant regulations (like GDPR, HIPAA, PCI DSS) and industry standards (like ISO 27001). I ensure compliance through several strategies. First, I thoroughly understand the applicable regulations and standards, mapping them to our monitoring processes. Second, I design and implement monitoring procedures that meet these requirements, ensuring data security, access controls, and auditability. Third, I regularly review and update our processes to account for changes in regulations and best practices. Finally, we conduct regular audits to verify our compliance and identify areas for improvement. Documentation of procedures, access controls, and audit trails is meticulously maintained to meet audit requirements.
Q 14. How do you collaborate with other teams to address monitoring issues?
Collaboration is crucial. Addressing monitoring issues often requires input and expertise from various teams – development, operations, security, etc. I foster collaboration through clear communication, establishing effective channels (e.g., ticketing systems, communication platforms), and participating actively in incident management processes. I ensure that relevant stakeholders are promptly notified of critical issues and are kept informed of the progress of resolution. Further, I contribute to post-incident reviews, working collaboratively to identify root causes and develop preventative measures, ensuring that everyone involved learns from past incidents and that improvements are implemented to prevent recurrences.
Q 15. What is your approach to maintaining accurate and up-to-date documentation for monitoring processes?
Maintaining accurate and up-to-date monitoring documentation is crucial for effective observation and problem-solving. My approach involves a multi-faceted strategy combining digital tools and structured processes. First, I utilize a version-controlled documentation system, such as a wiki or a dedicated document management system, allowing for collaborative editing and tracking of changes. This ensures transparency and accountability. Second, I establish clear naming conventions and a consistent template for all documents to ensure easy searchability and retrieval. Third, I incorporate regular reviews and updates into the monitoring schedule, ensuring the documentation remains relevant and reflects the current state of the system or process being monitored. This includes updating procedures, thresholds, and any relevant contextual information. Finally, I leverage automated reporting tools to gather data automatically and integrate it into the documentation, minimizing manual effort and ensuring consistency. For example, I might use a scripting language like Python to generate reports directly from monitoring databases and automatically update relevant documents.
Consider a scenario where we’re monitoring network performance. The documentation would include network diagrams, performance metrics (throughput, latency, packet loss), alerts configuration, and troubleshooting steps. Regular updates ensure that, should an issue occur, the response team has access to the most current information and accurate procedures.
Career Expert Tips:
- Ace those interviews! Prepare effectively by reviewing the Top 50 Most Common Interview Questions on ResumeGemini.
- Navigate your job search with confidence! Explore a wide range of Career Tips on ResumeGemini. Learn about common challenges and recommendations to overcome them.
- Craft the perfect resume! Master the Art of Resume Writing with ResumeGemini’s guide. Showcase your unique qualifications and achievements effectively.
- Don’t miss out on holiday savings! Build your dream resume with ResumeGemini’s ATS optimized templates.
Q 16. Explain your understanding of different types of observational data (qualitative vs. quantitative).
Observational data can be broadly categorized into qualitative and quantitative data. Quantitative data is numerical and objective, easily measurable and often analyzed statistically. Think of things like temperature readings, response times, or the number of errors. Qualitative data, on the other hand, is descriptive and subjective, focusing on qualities or characteristics that are not easily quantifiable. This might include observations about user behavior, system responsiveness (e.g., ‘sluggish’), or the color of an indicator light. Both types are essential for a complete understanding. For example, while quantitative data might show a spike in network latency, qualitative data from user feedback might reveal that the spike specifically impacted video conferencing.
In practice, I often find that combining both types provides a richer, more nuanced understanding. Quantitative data provides the ‘what’ – the measurable facts – while qualitative data provides the ‘why’ – context and interpretation. This integrated approach allows for a more comprehensive analysis and problem resolution.
Q 17. How do you ensure the objectivity and validity of your observations?
Ensuring objectivity and validity in observations is paramount. I employ several strategies to achieve this. Firstly, I use standardized procedures and checklists to guide my observations, reducing the influence of personal biases. Secondly, I employ multiple observers whenever feasible, comparing observations to identify discrepancies and strengthen the validity of findings. Thirdly, I use calibrated instruments and validated methods for collecting quantitative data, minimizing measurement error. For qualitative observations, I focus on detailed descriptions and contextual information, minimizing interpretation and ensuring others can understand the basis of my assessments. Lastly, I carefully document my methodology and any limitations of my observations, ensuring transparency and facilitating critical evaluation.
Imagine monitoring a manufacturing process. Using a calibrated gauge to measure the thickness of a product ensures objective quantitative data. Observing worker behavior using a standardized checklist minimizes personal bias when assessing adherence to safety protocols. Comparing multiple observers’ notes on product defects minimizes bias and improves the overall accuracy of the observation.
Q 18. How do you document your observations and findings in a clear and concise manner?
Clear and concise documentation is fundamental. I use a structured approach, typically employing a template that includes the following: date and time, location, observer’s name, observation method, detailed description of the observation, supporting data (e.g., screenshots, graphs, logs), and interpretation/conclusions. I prioritize using plain language, avoiding jargon whenever possible. For quantitative data, I use tables and graphs to present the information efficiently. For qualitative data, I strive for precise and factual descriptions, avoiding subjective opinions. The goal is to create a document that is easily understandable and readily reproducible by another observer.
For example, instead of writing ‘The system was slow,’ I would record ‘System response time exceeded the defined threshold of 2 seconds on average, as measured by the monitoring tool X, between 10:00 AM and 10:30 AM. This was accompanied by user reports of slow loading times’. This provides concrete and verifiable evidence.
Q 19. Describe a situation where you had to interpret complex monitoring data to identify a problem.
During a recent project monitoring a large web application, we noticed a significant increase in database query times, reflected in a sudden spike in response times logged by the application performance monitoring tool. This quantitative data indicated a problem, but didn’t reveal the root cause. We then analyzed the qualitative data – server logs – revealing numerous slow queries associated with a specific database function. Further investigation into the application code uncovered an inefficient algorithm within that function, which was causing the performance bottleneck. We optimized the algorithm, resulting in a significant decrease in query times and improved overall application performance. The resolution shows the importance of correlating quantitative and qualitative data to pinpoint the source of a problem.
Q 20. How do you identify and address potential biases in your observations?
Identifying and addressing biases is crucial for objective observation. I use several techniques to mitigate bias: Firstly, I am aware of my own potential biases and actively try to minimize their influence. Secondly, I use blind or double-blind observation techniques whenever possible, where the observer is unaware of the expected outcome or the data’s source. Thirdly, I seek feedback from peers to identify potential biases they might detect in my observations and interpretations. Fourthly, I use multiple data sources and methods to cross-validate my findings, reducing reliance on any single source that might be susceptible to bias.
For example, if evaluating a new software feature, I might deliberately avoid focusing only on positive aspects, actively seeking negative feedback and testing edge cases to challenge my initial assumptions. Using multiple metrics to assess the same phenomenon reduces the influence of a single potentially biased source.
Q 21. What techniques do you use to improve your observation skills?
Improving observation skills is an ongoing process. I employ several techniques: Firstly, I regularly practice focused observation exercises, such as mindful meditation or detailed descriptions of everyday objects. This enhances my ability to pay attention to detail. Secondly, I actively seek out opportunities to observe different systems and processes, broadening my experience and understanding. Thirdly, I regularly review my own observations and seek feedback to identify areas for improvement. Fourthly, I utilize training resources, such as workshops or online courses, to learn advanced observation techniques and expand my knowledge of relevant fields. Finally, I maintain a learning journal, documenting observations and reflections, aiding in the identification of patterns and the development of more critical thinking skills.
For instance, I might spend time systematically observing a complex machine in a factory to understand its operation or analyze different user interfaces to understand user behavior. Continuous learning and self-reflection are key to improving observation skills.
Q 22. How do you stay updated on the latest technologies and best practices in observation and monitoring?
Staying current in the dynamic field of observation and monitoring requires a multi-pronged approach. I regularly attend industry conferences like those hosted by organizations focused on DevOps and IT operations. These events offer invaluable insights into the latest tools and techniques. Secondly, I actively participate in online communities and forums, such as those on Stack Overflow or Reddit, dedicated to monitoring and system administration. Engaging in these communities allows me to learn from the experiences of others and contribute my own expertise. Finally, I dedicate time each week to reading industry publications, blogs, and white papers, focusing on emerging technologies like AIOps (Artificial Intelligence for IT Operations) and the latest advancements in log management and application performance monitoring (APM). This combination of active participation and dedicated learning keeps me at the forefront of best practices.
Q 23. Explain your experience with using monitoring tools to improve efficiency and productivity.
In my previous role, we were struggling with slow response times on our e-commerce platform, leading to lost sales and frustrated customers. I implemented a comprehensive monitoring strategy using tools like Prometheus and Grafana. Prometheus acted as our time-series database, collecting metrics from our servers and applications. Grafana provided the dashboarding and visualization capabilities, allowing us to easily identify bottlenecks. By monitoring CPU usage, memory consumption, and network latency, we were able to pinpoint the source of the slowdowns: a poorly optimized database query. After optimizing the query, we saw a significant improvement in response times, a 40% reduction in average loading time, resulting in increased sales and improved customer satisfaction. This experience highlighted the crucial role of monitoring tools not only in detecting issues but also in optimizing system performance for improved efficiency and productivity.
Q 24. Describe your experience with predictive monitoring and its benefits.
Predictive monitoring is a game-changer. Instead of simply reacting to problems after they occur, it allows us to anticipate and prevent them. My experience with predictive monitoring involved using machine learning algorithms to analyze historical system performance data. For example, we used anomaly detection techniques to identify patterns that precede system failures. This allowed us to proactively address potential issues, such as replacing aging hardware components before they failed, preventing significant downtime. The benefits are substantial: reduced downtime, improved system reliability, and cost savings by preventing unexpected outages and repairs. Essentially, we moved from a reactive firefighting approach to a proactive, preventative model, significantly enhancing operational efficiency.
Q 25. How do you integrate monitoring data with other data sources to gain a holistic view?
Gaining a holistic view requires integrating data from various sources. Consider a scenario where we are monitoring an application. We integrate application logs (with tools like ELK stack – Elasticsearch, Logstash, Kibana), system metrics (like CPU, memory using Prometheus), and business metrics (sales data, user activity from our analytics platform). This is typically achieved using a centralized logging and monitoring system, correlating events across different data sources with timestamps. For example, a sudden spike in application errors (from logs) correlated with high CPU usage (from system metrics) and a drop in sales (business metrics) points to a clear issue requiring immediate attention. By using a central dashboard and applying correlation rules, the picture becomes far clearer, allowing for faster and more effective problem resolution.
Q 26. What is your experience with automated monitoring systems?
I have extensive experience with automated monitoring systems. In a previous project, we implemented a fully automated system using Infrastructure as Code (IaC) principles. This automated the deployment and configuration of our monitoring agents across our entire infrastructure. We used tools like Ansible and Terraform to automate the process, ensuring consistent monitoring across all environments. This automation drastically reduced the time and effort required for managing the monitoring infrastructure, allowing us to focus on analyzing data and addressing issues rather than managing the monitoring tools themselves. Furthermore, it improved consistency and reduced human error, making the monitoring system more reliable and efficient.
Q 27. How do you ensure the security and integrity of monitoring data?
Security and data integrity are paramount in monitoring. We employ several strategies: First, data encryption both in transit and at rest is crucial. We use strong encryption protocols (like TLS/SSL) to protect data transmitted across networks. Data stored in databases is also encrypted using appropriate techniques. Second, access control is strictly enforced. The principle of least privilege is applied, granting only necessary access to monitoring data. Third, regular security audits and vulnerability scans are conducted to identify and address any potential security weaknesses. Finally, data integrity is maintained through checksums and version control, ensuring data hasn’t been tampered with. This multi-layered approach ensures the security and reliability of our monitoring data.
Q 28. Describe a time you had to make a critical decision based on monitoring data.
During a major website launch, our monitoring dashboards showed a sharp increase in error rates and extremely high latency. Initially, we suspected a DDoS attack. However, a deeper dive into the data revealed that the surge was localized to a specific geographic region. We correlated this with a sudden outage reported by our cloud provider in that region. This insight allowed us to quickly shift traffic away from the affected region to our backup infrastructure, minimizing disruption to our users. Had we only relied on initial superficial observations, we might have incorrectly implemented costly DDoS mitigation measures, wasting resources and potentially worsening the situation. The ability to analyze data thoroughly and correlate different information sources led to a quick, effective, and appropriate response.
Key Topics to Learn for Observation and Monitoring Interview
- Data Collection Methods: Understanding various techniques for observation and data recording, including structured vs. unstructured observation, and the strengths and weaknesses of each. Practical application: Choosing the appropriate method for a specific scenario, considering factors like resources and desired level of detail.
- Analytical Skills: Interpreting collected data, identifying trends, patterns, and anomalies. Practical application: Developing reports based on observations and communicating findings clearly and concisely. Consider exploring statistical analysis techniques relevant to your field.
- Technological Proficiency: Familiarity with relevant software and hardware used in observation and monitoring (e.g., data logging systems, video analysis software). Practical application: Demonstrating your ability to utilize these tools effectively and troubleshoot issues.
- Ethical Considerations: Understanding and adhering to ethical guidelines regarding data privacy, informed consent, and observer bias. Practical application: Designing observation protocols that respect ethical principles and minimize potential biases.
- Reporting and Communication: Effectively presenting findings to diverse audiences, both verbally and in written form. Practical application: Preparing clear and concise reports summarizing observations and recommendations.
- Problem-Solving & Critical Thinking: Analyzing observed data to identify root causes of problems, propose solutions, and evaluate their effectiveness. Practical application: Working through case studies or hypothetical scenarios to demonstrate your problem-solving skills.
Next Steps
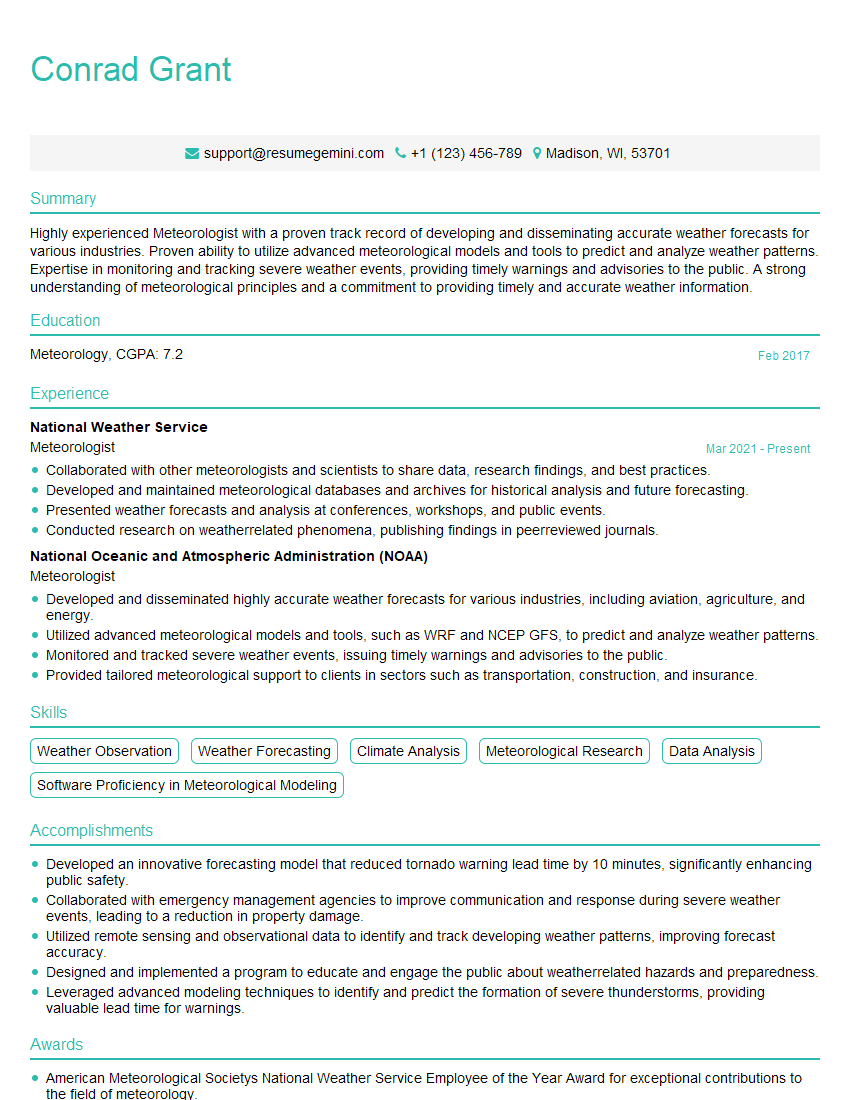
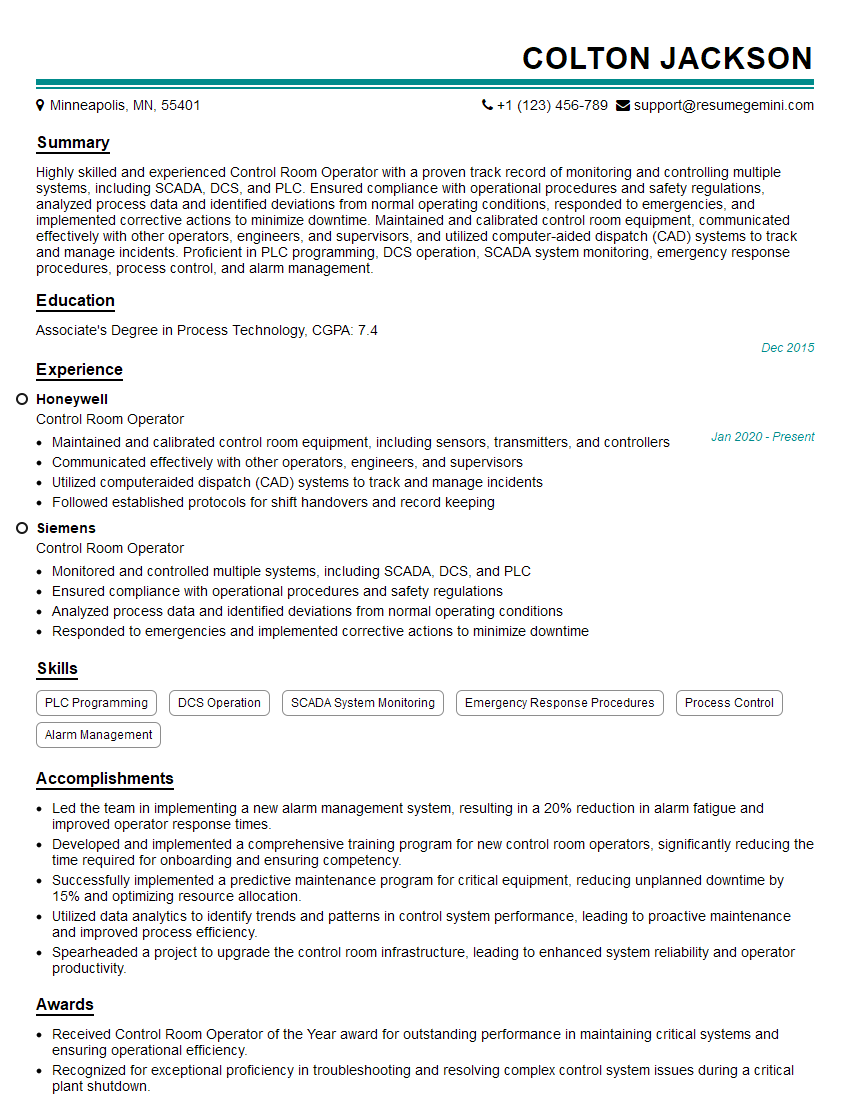
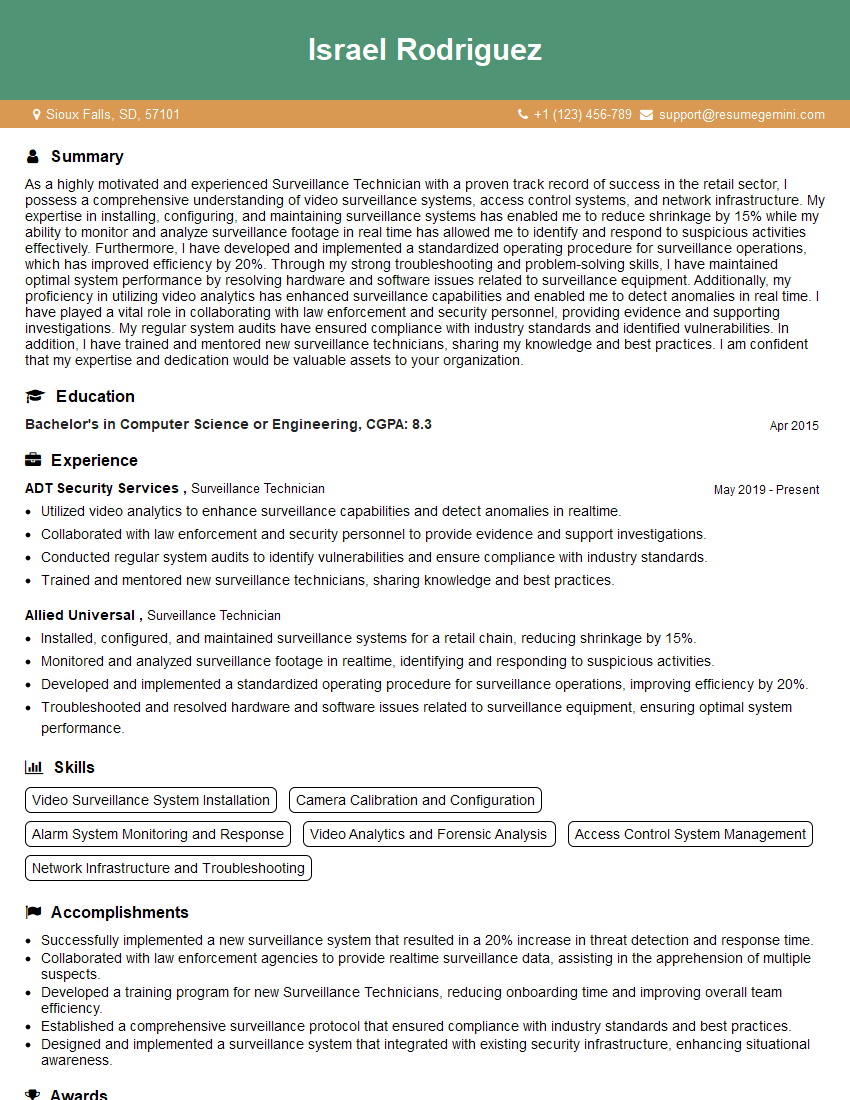
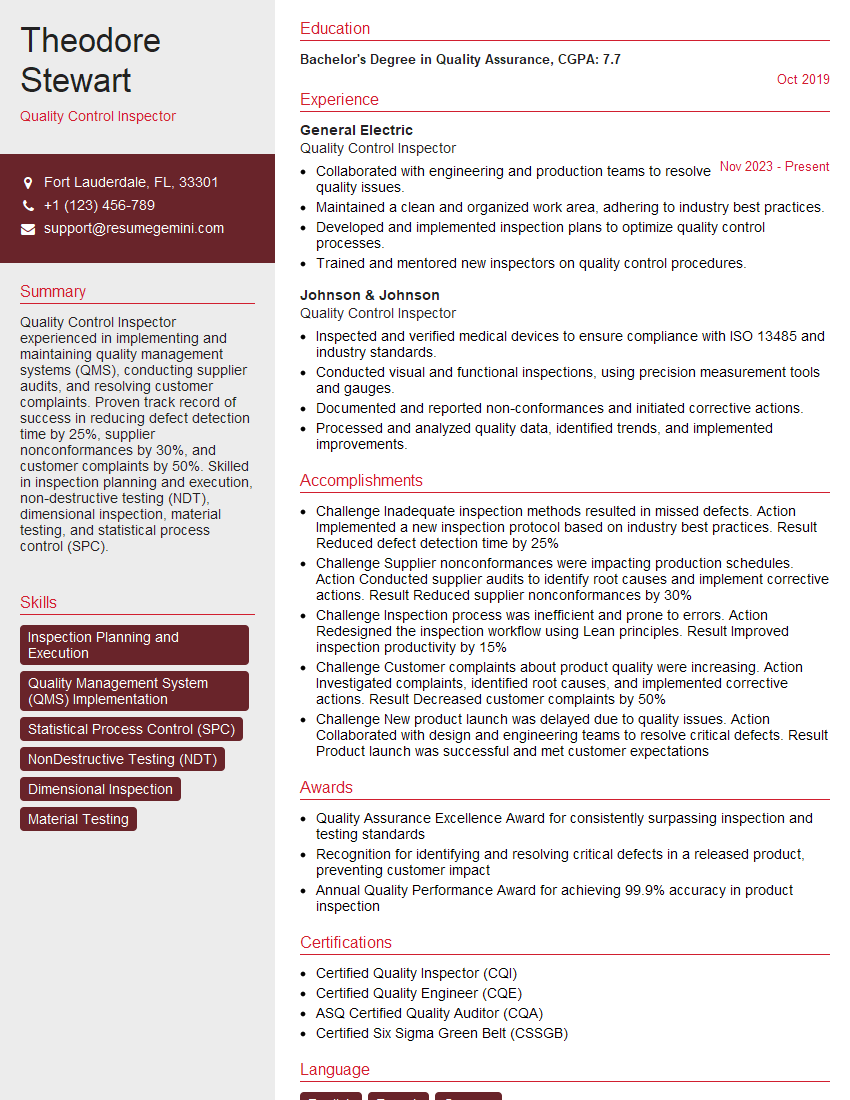
Mastering observation and monitoring skills is crucial for career advancement in many fields, opening doors to specialized roles and increased responsibilities. An ATS-friendly resume is essential for maximizing your job prospects. It needs to highlight your key skills and experiences in a way that Applicant Tracking Systems can easily recognize. We strongly recommend using ResumeGemini to craft a compelling and effective resume tailored to the Observation and Monitoring field. ResumeGemini offers tools and resources to build a professional resume that showcases your qualifications and makes you stand out to potential employers. Examples of resumes tailored to Observation and Monitoring are available for your review.
Explore more articles
Users Rating of Our Blogs
Share Your Experience
We value your feedback! Please rate our content and share your thoughts (optional).
What Readers Say About Our Blog
This was kind of a unique content I found around the specialized skills. Very helpful questions and good detailed answers.
Very Helpful blog, thank you Interviewgemini team.
