Every successful interview starts with knowing what to expect. In this blog, we’ll take you through the top Performance Testing and Evaluation interview questions, breaking them down with expert tips to help you deliver impactful answers. Step into your next interview fully prepared and ready to succeed.
Questions Asked in Performance Testing and Evaluation Interview
Q 1. Explain the difference between load testing, stress testing, and endurance testing.
Load testing, stress testing, and endurance testing are all crucial performance testing types, but they differ in their objectives and methodologies. Think of it like testing a bridge:
- Load Testing: This is like testing the bridge under normal traffic conditions. We simulate expected user load to determine how the system performs under typical usage. The goal is to identify performance bottlenecks before they impact real users. For example, we might simulate 100 concurrent users browsing an e-commerce site to see if the response times remain acceptable.
- Stress Testing: This is like testing the bridge to its breaking point. We gradually increase the load beyond normal expectations to find the system’s breaking point and determine how it behaves under extreme conditions. The aim is to identify the maximum load the system can handle before it fails or becomes unstable. We might continue increasing the number of concurrent users on the e-commerce site until it crashes or response times become unacceptable. This helps determine the system’s resilience.
- Endurance Testing (also known as soak testing): This is like leaving the bridge under normal load for an extended period. We subject the system to a constant load for an extended time (hours, days) to identify issues related to resource leaks, memory management, or other long-term performance degradation. For example, we would maintain the 100 concurrent user load on the e-commerce site for 24 hours to see if any performance issues emerge over time. This is crucial for systems designed for continuous operation.
Q 2. Describe your experience with JMeter or LoadRunner.
I have extensive experience with both JMeter and LoadRunner, having used them on numerous projects across various industries. JMeter, with its open-source nature and flexibility, is my go-to tool for most projects. I appreciate its ease of scripting, the extensive range of protocols it supports (HTTP, HTTPS, JDBC, etc.), and the powerful reporting features. I’ve used it to design and execute complex performance tests involving thousands of virtual users, generating detailed performance reports that help pinpoint bottlenecks.
LoadRunner, while a commercial tool, offers a more comprehensive suite of features, especially around advanced analytics and sophisticated user simulation. I’ve used it in situations requiring highly realistic user behavior modeling or integrated monitoring with enterprise-level systems. For instance, in one project, LoadRunner’s advanced correlation features were crucial in simulating real-world user interactions and accurately identifying performance limitations in a complex banking application.
My experience spans the entire performance testing lifecycle using both tools—from test planning and scripting to execution, analysis, and reporting. I’m proficient in developing realistic test scenarios, analyzing test results to identify performance bottlenecks, and recommending effective solutions.
Q 3. How do you identify performance bottlenecks in an application?
Identifying performance bottlenecks requires a systematic approach. It’s like detective work, systematically eliminating suspects until you find the culprit. My approach typically involves these steps:
- Analyzing Performance Monitoring Data: This is the most critical step. I leverage application performance monitoring (APM) tools along with metrics from the performance testing tool to analyze CPU utilization, memory usage, I/O operations, network latency, and database query performance. High CPU or memory utilization often suggests a code optimization issue or resource contention. Slow database queries, on the other hand, could point to a database design problem or inefficient queries.
- Profiling Code: For more granular analysis, I use profiling tools to identify slow-running code sections. This helps pinpoint specific code segments that need optimization.
- Reviewing Logs: Server logs and application logs provide crucial information about exceptions, errors, and unusual activity. Analyzing these can often reveal hidden performance issues.
- Network Analysis: Network bottlenecks can significantly impact performance. Tools like Wireshark can be helpful in identifying slow network connections or high network latency.
- Database Tuning: Database queries are frequent performance bottlenecks. I use database monitoring and tuning tools to optimize database performance, index tables correctly, and optimize queries.
By combining data from these different sources, I can build a comprehensive picture of the performance bottlenecks and prioritize fixing the most impactful issues first.
Q 4. What are the key performance indicators (KPIs) you monitor during performance testing?
The key performance indicators (KPIs) I monitor during performance testing are vital for assessing system performance. They are essentially the vital signs of the system under test.
- Response Time: The time it takes for the system to respond to a request. A slow response time directly impacts user experience.
- Throughput: The number of requests processed per unit of time (e.g., requests per second). This indicates the system’s capacity.
- Error Rate: The percentage of failed requests. High error rates indicate system instability or bugs.
- Resource Utilization (CPU, Memory, Disk I/O, Network): Monitoring these resources helps identify bottlenecks.
- Transaction Success Rate: The percentage of completed transactions.
- Concurrency: The number of simultaneous users or requests handled by the system.
- Page Load Time: For web applications, this is crucial for user experience.
The specific KPIs I focus on depend on the application and the goals of the performance testing. For instance, for a real-time gaming application, I might place greater emphasis on response time and concurrency, whereas for an e-commerce site, throughput and transaction success rate might be more crucial.
Q 5. Explain your approach to designing a performance test plan.
Designing a performance test plan is crucial for a successful performance test. It’s the blueprint for the entire process. My approach involves the following steps:
- Defining Objectives: Clearly state the goals of the performance test. What are we trying to achieve? Are we testing scalability, stability, or response times?
- Identifying Test Environment: Specify the hardware and software configuration that will be used for the test.
- Defining Test Scenarios: Create realistic user scenarios representing typical user behavior. This requires a good understanding of how users will interact with the application.
- Selecting KPIs: Identify the key performance indicators that will be measured.
- Determining Test Data: Decide on the type and volume of data needed for the test.
- Creating a Test Script: Develop the scripts to simulate user behavior.
- Test Execution Plan: Define the timeline for test execution and resource allocation.
- Reporting and Analysis: Define how test results will be analyzed and reported.
A well-defined test plan ensures that the performance test is comprehensive, efficient, and delivers valuable insights into the application’s performance.
Q 6. How do you handle performance issues found during testing?
Handling performance issues identified during testing is a collaborative process involving developers, operations, and performance engineers. My approach is systematic and involves the following steps:
- Reproduce the Issue: First, we must consistently reproduce the issue in a controlled environment to ensure it’s not a fluke.
- Analyze Root Cause: Leveraging the data collected during testing (logs, metrics, traces), we identify the root cause of the performance problem. This often involves careful examination of code, database queries, and server configuration.
- Propose Solutions: Based on the root cause analysis, we suggest solutions to address the performance issues. These could include code optimization, database tuning, hardware upgrades, or changes to application architecture.
- Implement and Retest: Developers implement the proposed solutions, and we conduct another round of performance testing to validate the effectiveness of the fixes.
- Document Findings and Recommendations: We document the identified performance issues, their root causes, implemented solutions, and resulting improvements. This documentation is crucial for future development and maintenance.
Throughout this process, collaboration and clear communication are key. Regular updates and discussions among the team ensure everyone is informed and aligned on the progress.
Q 7. What are some common performance testing tools and their strengths and weaknesses?
Several tools are available for performance testing, each with its strengths and weaknesses. Here’s a comparison of some popular options:
- JMeter:
- Strengths: Open-source, highly customizable, supports various protocols, large community support.
- Weaknesses: Can be complex to learn for beginners, limited advanced analytics compared to commercial tools.
- LoadRunner:
- Strengths: Powerful features for advanced analytics, realistic user simulation, robust monitoring capabilities.
- Weaknesses: Expensive, steeper learning curve, complex setup and configuration.
- Gatling:
- Strengths: Based on Scala, excellent for complex scenarios, highly scalable, good performance.
- Weaknesses: Requires Scala programming knowledge, smaller community compared to JMeter.
- k6:
- Strengths: Modern, JavaScript-based, open-source, developer-friendly, excellent for cloud-based testing.
- Weaknesses: Relatively new compared to other tools, community is still growing.
The best tool depends on the specific needs of the project, the team’s skillset, and the budget. A thorough evaluation of these factors is crucial before selecting a performance testing tool.
Q 8. Describe your experience with performance monitoring tools like Dynatrace or New Relic.
I have extensive experience with both Dynatrace and New Relic, using them for various performance monitoring tasks across diverse projects. These tools are invaluable for real-time performance analysis and troubleshooting. For instance, in one project involving a high-traffic e-commerce platform, we leveraged Dynatrace’s distributed tracing capabilities to pinpoint a bottleneck in the order processing pipeline – a specific database query that was unexpectedly slow under load. Dynatrace helped us visualize the entire request flow, identifying this issue quickly. New Relic, on the other hand, excelled in its ability to provide granular metrics on application server performance, enabling us to optimize resource allocation and prevent crashes. I’m proficient in configuring alerts, dashboards, and custom metrics within both platforms to ensure proactive monitoring and quick identification of performance degradation.
Specifically, I’m comfortable using their features for:
- Real-time monitoring of key metrics such as response times, CPU utilization, memory usage, and network throughput.
- Identifying slow database queries, inefficient code sections, and other performance bottlenecks.
- Analyzing application logs and tracing errors to their root cause.
- Creating custom dashboards and reports to track performance over time.
- Setting up alerts to notify teams of critical performance issues.
Q 9. How do you determine the appropriate workload for a performance test?
Determining the appropriate workload for a performance test is crucial for generating meaningful results. It involves understanding the anticipated user load and behavior of your application in a production-like environment. This isn’t about simply throwing a massive number of virtual users at the system; it requires a strategic approach. We start by gathering requirements from stakeholders, defining key performance indicators (KPIs), and analyzing historical data (if available). For example, if we’re testing a banking application, we’d consider peak transaction volumes, average transaction time, and the types of transactions (e.g., account balance checks, fund transfers).
The process often involves:
- Understanding Business Requirements: Defining the acceptable performance levels (e.g., response time targets) and potential scenarios (e.g., high traffic during promotional sales).
- Analyzing Historical Data: Examining past usage patterns to determine peak loads and normal usage scenarios.
- Creating User Load Profiles: Modeling representative user behavior, including different types of users and their actions.
- Scaling Gradually: Starting with a smaller load and progressively increasing the number of virtual users to observe the system’s behavior under increasing pressure.
- Employing Load Models:Using models like constant load, step load, ramp-up, and spike load to simulate different scenarios and assess the system’s resilience.
Often, a combination of these methods is used to create a comprehensive and realistic workload model.
Q 10. Explain the concept of baselining in performance testing.
Baselining in performance testing is like establishing a ‘before’ picture. It’s the process of establishing a known, stable performance level for your application under a specific workload. This baseline serves as the reference point against which future performance tests are compared. Think of it as the starting point for measuring improvements (or degradations). Once the baseline is established, subsequent tests show how changes – code updates, infrastructure changes, etc. – impact system performance.
For example, before rolling out a new feature, you would establish a baseline by performing a comprehensive performance test covering expected production user traffic. This provides a benchmark – e.g., average response time, throughput, resource utilization. Then, after the feature is deployed, you run identical tests and compare the results to the baseline to measure the feature’s impact on performance. Any significant deviation highlights potential problems that need investigation.
Q 11. How do you analyze performance test results and identify areas for improvement?
Analyzing performance test results involves a systematic approach to identify bottlenecks and areas for improvement. It’s not just about looking at overall numbers; it’s about digging deep to understand *why* the system performed the way it did. My approach starts with visualizing the data using graphs and charts generated by the performance testing tools. I typically look at metrics like:
- Response times: Analyzing average, minimum, maximum, and percentile values to identify slow transactions.
- Throughput: Measuring the number of requests processed per second or minute to assess the overall capacity.
- Resource utilization: Examining CPU, memory, disk I/O, and network usage to identify resource constraints.
- Error rates: Tracking error percentages and types to identify potential problems.
Then, I use this data to pinpoint bottlenecks, which could be anything from database queries to network latency or even inefficient code. If necessary, I conduct further testing with targeted focus on specific suspected areas. Root cause analysis and using tools like APM (Application Performance Monitoring) are also critical components of this process. Once identified, we work collaboratively with developers and infrastructure teams to implement fixes and improvements.
Q 12. What is the difference between response time and throughput?
Response time and throughput are both key performance indicators (KPIs), but they represent different aspects of system performance. Response time is the time it takes for a system to respond to a request, while throughput is the rate at which the system can process requests. Think of it this way: response time is the speed of an individual runner, while throughput is the number of runners that cross the finish line in a given time.
Response time focuses on the user experience; a shorter response time indicates a better user experience. Throughput focuses on the system’s capacity; a higher throughput indicates a system capable of handling more requests.
For instance, a system might have a fast response time (e.g., 200ms) but low throughput (e.g., 10 requests per second) if it has limited processing power. Conversely, a system might have slower response time (e.g., 500ms) but high throughput (e.g., 100 requests per second) if it’s optimized to handle large volumes but is not optimized for speed of individual requests. A balanced approach is ideal.
Q 13. How do you handle false positives in performance testing?
False positives in performance testing are results that indicate a problem when there isn’t one. They can waste time and resources investigating non-issues. Handling them requires careful investigation and analysis. My approach involves several steps:
- Verify the Test Environment: Ensure the test environment accurately reflects the production environment. Inconsistent configurations can lead to false positives.
- Review Test Data and Scripts: Check for errors in test scripts or data sets that might be causing artificial performance degradation.
- Analyze System Logs: Examine application and system logs for any anomalies or errors that might correlate with the reported performance issues. Often, the true root cause is found here.
- Repeat the Test: Rerun the test multiple times to rule out transient issues or random fluctuations.
- Investigate Context: Consider external factors, such as network congestion or other concurrent processes, which might have influenced the results.
It’s a process of elimination. By methodically checking each potential cause, you can determine whether the issue is a genuine performance problem or a false positive.
Q 14. What are some common challenges in performance testing and how have you overcome them?
Performance testing presents various challenges. One common issue is replicating real-world user behavior accurately. In one project, we struggled to model the complex user interactions of a social media application. We overcame this by using a combination of synthetic tests (simulating user behavior) and real user monitoring (RUM) data to get a more holistic view of the system’s behavior under different usage patterns.
Another challenge is managing the test environment. Ensuring that the testing environment closely mirrors production can be difficult, especially with complex systems. We addressed this by employing infrastructure-as-code (IaC) to create consistent, repeatable test environments. Other common challenges include the time and resource constraints associated with testing, lack of skilled testers, dealing with external dependencies (like databases or third-party APIs), and handling performance issues which aren’t easily traceable in a large or complex system. For resource constraints, we employed techniques like test automation and parallelization to optimize resource utilization.
For each challenge, careful planning, strategic use of tools, and a collaborative approach were key to overcoming them.
Q 15. Explain your experience with scripting performance tests.
Scripting performance tests is crucial for automating the process and ensuring consistent testing. My experience spans various tools like JMeter, LoadRunner, and k6. I’m proficient in creating scripts for different protocols, including HTTP, HTTPS, WebSockets, and JDBC. For example, in a recent project involving an e-commerce website, I used JMeter to simulate thousands of concurrent users performing actions like browsing products, adding items to carts, and checking out. This allowed us to identify bottlenecks in the system under heavy load. My scripts incorporate features like parameterization, loops, and assertions to effectively test various scenarios and validate the results. I also have experience incorporating custom functions and plugins to handle more complex testing needs, such as simulating realistic user behavior with think times and custom data sets. Furthermore, I am familiar with using various scripting languages like Groovy and BeanShell for extending the capabilities of my chosen tools.
Career Expert Tips:
- Ace those interviews! Prepare effectively by reviewing the Top 50 Most Common Interview Questions on ResumeGemini.
- Navigate your job search with confidence! Explore a wide range of Career Tips on ResumeGemini. Learn about common challenges and recommendations to overcome them.
- Craft the perfect resume! Master the Art of Resume Writing with ResumeGemini’s guide. Showcase your unique qualifications and achievements effectively.
- Don’t miss out on holiday savings! Build your dream resume with ResumeGemini’s ATS optimized templates.
Q 16. How do you ensure the reliability and repeatability of performance tests?
Reliability and repeatability are paramount in performance testing. We achieve this through a multi-pronged approach. First, we meticulously document the test environment, including hardware specifications (CPU, memory, network), software versions (OS, application server, database), and network configuration. This ensures consistency across test runs. Second, we use parameterized scripts to avoid hardcoding values, allowing us to easily modify input data and test various scenarios. Third, we establish a baseline performance run to set a reference point for comparison. Fourth, we implement robust error handling and logging in our scripts to track issues and isolate failures. We also employ techniques like using a controlled test environment, minimizing external factors (like network fluctuations), and executing tests at consistent times of the day. Finally, we leverage version control to manage test scripts, making it easier to reproduce and compare results across different executions. For instance, if a test failure is encountered, we can easily revert to a previous version of the script to verify the issue.
Q 17. What is the role of non-functional testing in software development?
Non-functional testing, including performance testing, is critical because it validates the system’s ability to meet operational requirements beyond the basic functionality. While functional testing verifies that the software *does* what it’s supposed to do, non-functional testing verifies that it does so *well*. It focuses on attributes like performance (response time, throughput), scalability (handling increased load), security (protecting against vulnerabilities), usability (ease of use), reliability (stability and error handling), and maintainability. Ignoring non-functional aspects can lead to applications that are slow, crash under pressure, or are insecure, resulting in poor user experience, financial loss, and reputational damage. A successful application needs to perform well and be reliable in addition to working correctly.
Q 18. Explain the concept of resource contention in performance testing.
Resource contention occurs when multiple processes or threads simultaneously try to access the same limited resource, leading to performance degradation or failure. Imagine a highway with only one lane – cars will queue and slow down. In software, this resource could be anything from CPU cycles, memory, database connections, network bandwidth, or disk I/O. For example, if multiple users try to access the same database table concurrently without proper locking mechanisms, the database may become a bottleneck. During performance testing, detecting resource contention is crucial. Tools like system monitors (Windows Performance Monitor, Linux ‘top’ command) and application-level performance monitoring (APM) tools provide insights into resource utilization. Analyzing these metrics helps pinpoint bottlenecks and address them through techniques like database optimization, load balancing, or application code improvements. Identifying and resolving resource contention is vital for ensuring application scalability and performance under load.
Q 19. How do you correlate performance issues with application code?
Correlating performance issues with application code requires a systematic approach. We start by analyzing performance test results, identifying specific areas of slowdowns or errors. Then, we leverage APM tools to pinpoint bottlenecks within the application code. These tools provide detailed insights into transaction traces, method execution times, and database queries, allowing us to identify specific code sections contributing to poor performance. Profiling tools can also be helpful for analyzing code execution and identifying hot spots. Furthermore, logging and tracing mechanisms within the application itself can provide invaluable information. A combination of these techniques enables us to directly link performance issues to specific lines of code, facilitating efficient debugging and optimization. For example, if we find that a particular database query takes an unusually long time, we can analyze the query and the database schema to optimize the query or the data model to improve performance.
Q 20. Describe your experience with performance testing in cloud environments (AWS, Azure, GCP).
I have extensive experience with performance testing in cloud environments, including AWS, Azure, and GCP. My experience involves leveraging cloud-based load testing services like AWS Load Testing, Azure Load Testing, and Google Cloud’s load testing options. I understand how to provision and configure cloud resources for performance tests, including virtual machines, load balancers, and databases. I’m familiar with the unique challenges of cloud environments, such as network latency and scaling limitations, and know how to account for these in test design and execution. A recent project involved migrating an on-premise application to AWS. We utilized AWS Load Testing to simulate realistic user load in the cloud environment before the actual migration, identifying and resolving performance bottlenecks proactively. This ensured a smooth migration and optimal application performance in the cloud.
Q 21. What is your experience with using CI/CD pipelines for performance testing?
Integrating performance testing into CI/CD pipelines is essential for continuous improvement. I have experience automating performance tests using tools like Jenkins, GitLab CI, and Azure DevOps. This involves creating scripts that automatically run performance tests, analyze results, and report findings. The tests are triggered automatically upon code commits or deployments, providing immediate feedback on the impact of code changes on application performance. We use thresholds to determine pass/fail criteria, ensuring quick detection of performance regressions. For example, a new feature causing a response time increase exceeding a defined threshold would trigger an alert and prevent the deployment. Integrating performance testing early in the CI/CD process helps ensure that performance is considered throughout the software development lifecycle, leading to a faster and more efficient delivery of high-performing applications.
Q 22. How do you prioritize performance test defects based on their severity and impact?
Prioritizing performance test defects involves a careful assessment of their severity and impact on the system’s overall performance and user experience. We use a prioritization matrix, often incorporating a severity scale (e.g., critical, major, minor) and an impact scale (e.g., high, medium, low). This matrix helps us objectively rank defects.
For example, a critical severity and high impact defect might be a complete system crash under moderate load. This would be prioritized immediately for fixing. Conversely, a minor severity and low impact defect like a slight increase in page load time under extremely high load might be deferred until later sprints if the impact is negligible for normal user conditions. We usually involve stakeholders (developers, product owners) in this process to ensure alignment on the prioritization.
In practice, I often employ a weighted scoring system. For example, Critical=5, Major=3, Minor=1 for severity and High=4, Medium=2, Low=1 for impact. Multiplying these scores provides a numerical ranking that clearly indicates the priority. The defects with the highest weighted scores are addressed first.
Q 23. Describe your experience with performance testing of different types of applications (web, mobile, API).
My experience spans various application types, and I’ve adapted my testing strategies accordingly. For web applications, I focus on metrics like page load time, response time, and throughput, using tools like JMeter and LoadRunner. I simulate realistic user scenarios including browsing, form submissions, and authentication processes. For mobile applications, I consider network conditions (3G, 4G, 5G), device capabilities, and battery drain. I use tools like JMeter and Appium, creating tests which run on real devices and emulators. Furthermore, I focus on optimizing the app for responsiveness and smooth user interactions.
With API performance testing, I concentrate on endpoint response times, throughput, and error rates. Tools like Postman and k6 are commonly used, and the focus shifts to proper handling of requests, efficient data processing, and the prevention of bottlenecks within the API infrastructure. For instance, while testing a mobile banking app, I’d simulate hundreds of concurrent logins and money transfers to assess the API’s capacity and responsiveness under stress. The goal is to ensure the API consistently provides fast and reliable service even under peak load.
Q 24. How do you measure the performance of a database?
Measuring database performance involves analyzing several key metrics. Query response time is critical – how long it takes to execute SQL queries. We use tools like SQL Profiler or database monitoring systems to track this. Transaction throughput measures the number of transactions processed per unit of time, giving an idea of the database’s capacity. CPU usage, memory usage, and disk I/O are also important indicators of overall system health and performance. If these resources are nearing capacity, it suggests performance bottlenecks.
Furthermore, we analyze deadlocks and lock contention. Deadlocks are when two or more database processes block each other indefinitely, halting operations. Lock contention occurs when multiple processes try to access the same data simultaneously, leading to performance degradation. Regular database health checks, tuning query execution plans, and optimizing database schema are crucial steps in maintaining its performance.
Q 25. What are some best practices for designing and executing performance tests?
Best practices for performance testing hinge on a well-defined process. It begins with clear objectives—what are we aiming to achieve? Are we measuring response times under a specific load, identifying bottlenecks, or verifying the system’s scalability? This clarity dictates the scope and tests to be implemented.
- Realistic test scenarios: We simulate real-world user behavior to capture accurate performance data. This includes different types of users, load patterns, and data sets.
- Load and stress testing: Load testing assesses performance under expected loads, while stress testing pushes the system beyond its limits to identify breaking points and resilience.
- Comprehensive monitoring: During testing, we monitor key metrics to pinpoint issues, such as CPU usage, memory utilization, and network latency.
- Root cause analysis: Any performance issues require thorough investigation to uncover the root causes. Profiling tools and code analysis are frequently used here.
- Regular testing: Performance testing isn’t a one-time event. It’s integrated into the software development lifecycle (SDLC) to catch performance regressions early.
For example, if testing an e-commerce site, we’d simulate a large number of concurrent users adding items to their carts, proceeding to checkout, and making purchases to evaluate the site’s behavior under peak demand. The same approach is applied for many other software systems.
Q 26. How would you approach performance testing of a microservices architecture?
Performance testing a microservices architecture presents unique challenges. The distributed nature of the system requires a different approach compared to monolithic applications. Instead of testing the entire system as a single unit, we focus on individual services and their interactions. We conduct performance tests for each service individually to identify bottlenecks, then test the integration between services to examine the performance of the overall system.
Tools like JMeter and Gatling are helpful for simulating requests to multiple microservices. We need to carefully monitor the metrics of each individual service and identify inter-service dependencies to prevent issues. Testing different service combinations and varying loads is crucial to identify bottlenecks across services. Furthermore, monitoring distributed tracing tools are used to follow requests across services and understand the flow of requests. For example, if a request is significantly slow, a tracing tool would help determine the specific service that caused the delay.
Q 27. Explain your understanding of different performance testing methodologies (e.g., waterfall, agile).
Performance testing methodologies can be broadly classified into waterfall and agile approaches. In a waterfall model, performance testing is typically a separate phase, often conducted towards the end of the development cycle. This approach is less flexible and can lead to late detection of performance issues, requiring significant rework.
In contrast, the agile methodology integrates performance testing throughout the SDLC, performing tests regularly during iterative development. This early and continuous testing approach helps identify issues early, when they are less expensive to resolve. Agile performance testing utilizes shorter testing cycles, enabling faster feedback loops and iterative improvements. In practice, agile methodologies allow for more flexibility and adaptability, enabling the quick resolution of performance issues.
Q 28. What is your experience with capacity planning and performance optimization?
Capacity planning involves determining the required resources (servers, network bandwidth, database capacity) to handle anticipated workloads and user demand. It’s about proactively predicting the system’s future needs, preventing performance bottlenecks, and ensuring sufficient resources are available to meet expected growth. Performance optimization, on the other hand, is about improving the efficiency of the existing system to reduce resource consumption, improve response times, and enhance scalability.
My experience with both involves creating capacity models based on historical data, projected growth, and performance testing results. These models help estimate future resource requirements. Optimization involves identifying performance bottlenecks, usually using profiling tools and analyzing resource usage patterns. Optimization techniques can range from database tuning to code refactoring to hardware upgrades, depending on the specific issue and infrastructure. For instance, in a large online retail application, capacity planning involves predicting peak holiday shopping loads and ensuring the infrastructure can handle them smoothly. Performance optimization would focus on accelerating page load times, optimizing database queries, and ensuring efficient load balancing across servers.
Key Topics to Learn for Performance Testing and Evaluation Interview
- Performance Testing Fundamentals: Understanding different performance testing types (load, stress, endurance, spike testing), their goals, and when to apply each.
- Practical Application: Designing and executing performance tests using tools like JMeter or LoadRunner. Analyzing test results to identify bottlenecks and performance issues.
- Metrics and Analysis: Interpreting key performance indicators (KPIs) like response time, throughput, resource utilization. Developing strategies for performance improvement based on data analysis.
- Non-Functional Requirements: Understanding how performance testing aligns with overall application quality and business needs. Communicating performance test results effectively to technical and non-technical audiences.
- Tool Selection and Implementation: Evaluating and selecting appropriate performance testing tools based on project requirements. Setting up and configuring testing environments.
- Performance Bottleneck Identification & Resolution: Utilizing profiling tools and debugging techniques to pinpoint performance issues in code, databases, or infrastructure. Proposing solutions to address identified bottlenecks.
- Scripting and Automation: Automating performance tests using scripting languages to improve efficiency and repeatability.
- Cloud-Based Performance Testing: Understanding the unique considerations of performance testing in cloud environments (AWS, Azure, GCP).
Next Steps
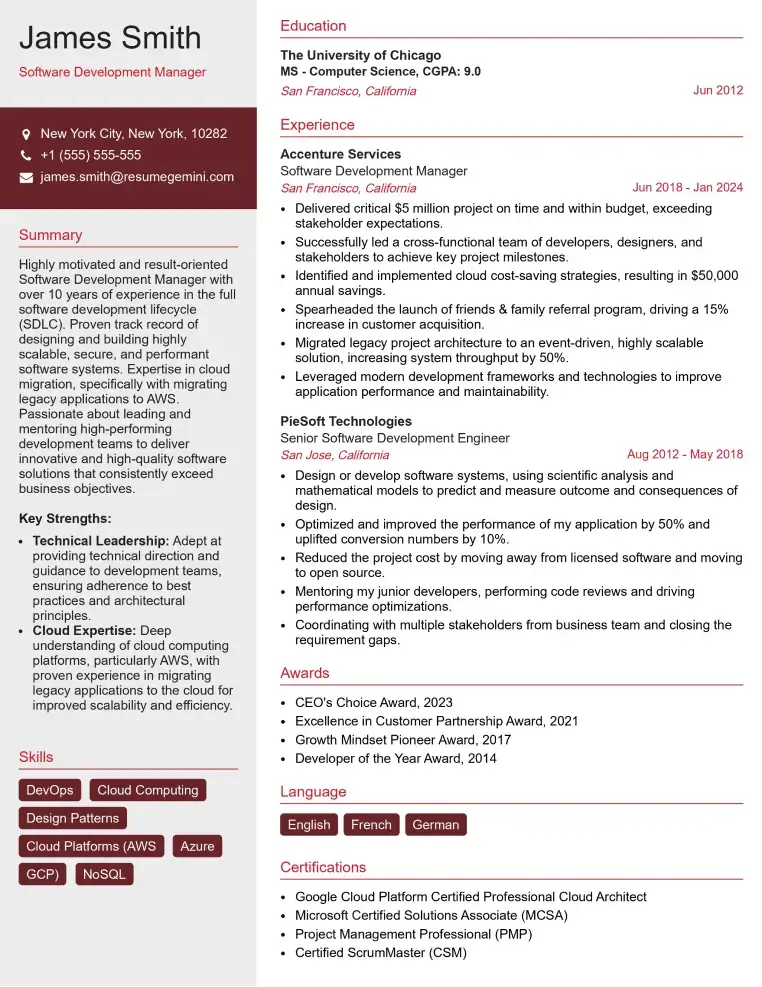
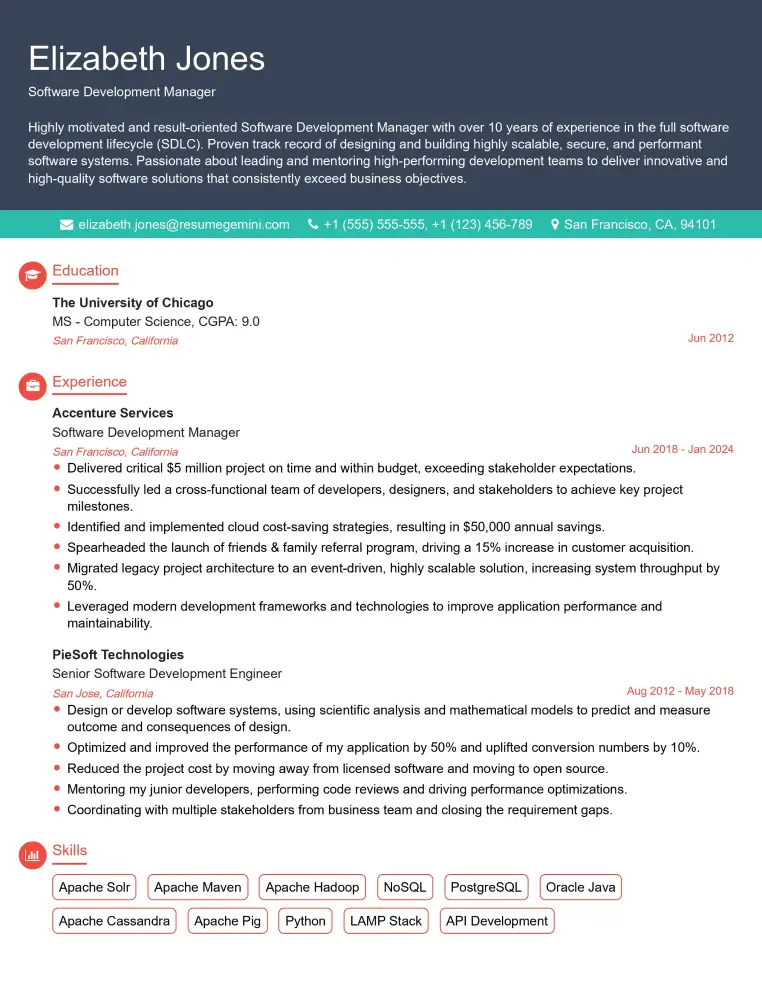
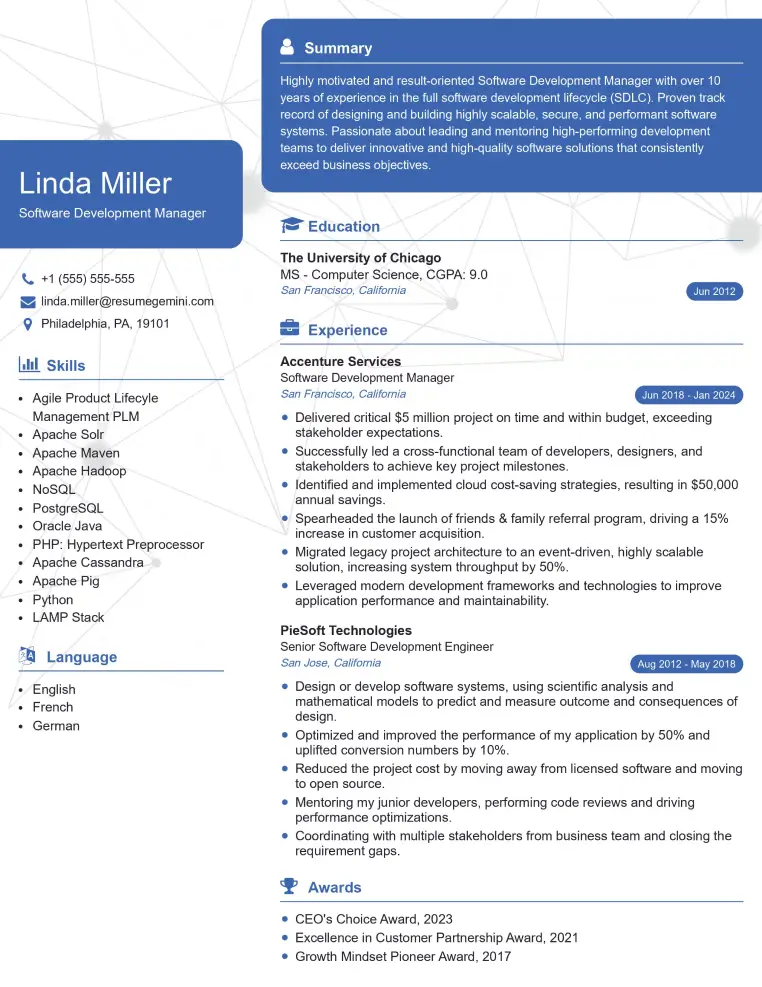
Mastering Performance Testing and Evaluation is crucial for career advancement in the ever-evolving tech landscape. It demonstrates a valuable skillset highly sought after by organizations of all sizes. To maximize your job prospects, creating a strong, ATS-friendly resume is essential. ResumeGemini offers a trusted platform for building professional, impactful resumes tailored to your specific experience. We provide examples of resumes specifically designed for Performance Testing and Evaluation professionals to help you showcase your skills effectively. Take the next step towards your dream career – build your best resume with ResumeGemini!
Explore more articles
Users Rating of Our Blogs
Share Your Experience
We value your feedback! Please rate our content and share your thoughts (optional).
What Readers Say About Our Blog
This was kind of a unique content I found around the specialized skills. Very helpful questions and good detailed answers.
Very Helpful blog, thank you Interviewgemini team.
