Preparation is the key to success in any interview. In this post, we’ll explore crucial Qualitative and Quantitative Assessment Methods interview questions and equip you with strategies to craft impactful answers. Whether you’re a beginner or a pro, these tips will elevate your preparation.
Questions Asked in Qualitative and Quantitative Assessment Methods Interview
Q 1. Explain the difference between qualitative and quantitative data.
Qualitative and quantitative data represent fundamentally different approaches to understanding the world. Qualitative data focuses on qualities or characteristics, providing rich descriptive information that is often subjective and exploratory. Think of it as exploring the ‘why’ behind a phenomenon. Quantitative data, on the other hand, focuses on quantities or numerical measurements, offering objective and statistically analyzable information. This approach is often used to test hypotheses and establish relationships between variables. It seeks to answer the ‘how many’ or ‘how much’.
Example: Imagine you’re studying customer satisfaction with a new product. Qualitative data might involve in-depth interviews exploring customers’ feelings and experiences, resulting in detailed narratives and descriptions. Quantitative data might involve a survey asking customers to rate their satisfaction on a numerical scale (e.g., 1 to 5), providing numerical data amenable to statistical analysis to determine the average satisfaction level.
Q 2. Describe three qualitative data collection methods and their strengths and weaknesses.
Three common qualitative data collection methods are:
- In-depth Interviews: These involve structured or semi-structured conversations with individuals to explore their experiences, perspectives, and beliefs in detail. Strengths: Rich, detailed data; allows for probing and clarification; excellent for understanding complex issues. Weaknesses: Time-consuming; can be subjective; may be influenced by interviewer bias.
- Focus Groups: These are guided group discussions where participants interact and share their views on a specific topic. Strengths: Generates diverse perspectives; allows for interaction and spontaneous discussion; can be more efficient than individual interviews. Weaknesses: Dominant participants can influence others; groupthink can occur; less depth of individual perspectives than interviews.
- Ethnographic Observation: This method involves immersing oneself in a particular setting or culture to observe and document behaviors and interactions naturally. Strengths: Provides rich contextual data; captures natural behaviors; can uncover hidden meanings and patterns. Weaknesses: Can be time-consuming and resource-intensive; researcher presence can influence behavior; subjective interpretation of observations.
Q 3. What are three quantitative data collection methods and their strengths and weaknesses?
Three common quantitative data collection methods are:
- Surveys: These involve administering questionnaires to a sample population to collect structured data. Strengths: Efficient for large samples; allows for standardized comparisons; relatively inexpensive. Weaknesses: Low response rates can be a problem; superficial answers may be given; limited scope for exploring complex issues.
- Experiments: These involve manipulating an independent variable to observe its effect on a dependent variable, often in a controlled setting. Strengths: Allows for establishing cause-and-effect relationships; high level of control; can be replicated. Weaknesses: Artificiality of the setting can limit generalizability; ethical concerns may arise; may be expensive and time-consuming.
- Existing Data Analysis (Secondary Data): This involves analyzing data already collected for other purposes, such as census data, government records, or organizational databases. Strengths: Cost-effective; readily available data; large sample sizes are often available. Weaknesses: Data may not perfectly align with the research question; potential for biases in data collection; limited control over data quality.
Q 4. How do you ensure the reliability and validity of qualitative data?
Ensuring reliability and validity in qualitative research requires meticulous attention to detail throughout the research process. Reliability refers to the consistency of the findings; would another researcher arrive at similar conclusions using the same methods? Validity refers to the accuracy and truthfulness of the findings; are you actually measuring what you intend to measure?
Strategies to enhance reliability and validity include:
- Triangulation: Using multiple data sources (e.g., interviews, observations, documents) to corroborate findings.
- Member Checking: Sharing findings with participants to ensure accuracy and gain feedback.
- Peer Review: Having other researchers review the data analysis and interpretations.
- Detailed Documentation: Maintaining thorough records of data collection, analysis, and interpretations to ensure transparency and replicability.
- Reflexivity: Researchers acknowledging their own biases and how they might influence the research process.
For instance, in a study on workplace stress, triangulation might involve interviewing employees, observing workplace interactions, and analyzing company documents. Member checking would involve sharing the findings with employees to confirm their accuracy.
Q 5. How do you ensure the reliability and validity of quantitative data?
Ensuring reliability and validity in quantitative research relies heavily on sound research design and statistical methods. Reliability focuses on the consistency and stability of measurements. Validity examines whether the instrument accurately measures the intended construct.
Techniques to achieve reliability and validity include:
- Random Sampling: To ensure a representative sample of the population, minimizing sampling bias.
- Pilot Testing: Testing the instruments and procedures on a small group before administering them to the main sample.
- Internal Consistency (Cronbach’s alpha): Evaluating the consistency of items within a scale or questionnaire.
- Test-Retest Reliability: Administering the same measure at two different times to assess consistency over time.
- Content Validity: Ensuring the measure covers all aspects of the construct.
- Criterion Validity: Comparing the measure to an established criterion or gold standard.
- Construct Validity: Demonstrating the measure accurately reflects the underlying theoretical construct.
For example, in a study examining the effectiveness of a new teaching method, test-retest reliability would involve giving the same achievement test to students at two different time points. Content validity would require the test to cover all relevant aspects of the curriculum.
Q 6. What are some common biases in qualitative research and how can they be mitigated?
Qualitative research is susceptible to several biases. Confirmation bias, where researchers seek evidence confirming their pre-existing beliefs, is a common threat. Researcher bias, where the researcher’s own perspectives influence data collection and interpretation, is another significant concern. Sampling bias can occur if the sample does not accurately represent the population of interest. Finally, Hawthorne effect may cause participants to alter their behavior simply because they are being observed.
Mitigation strategies include:
- Reflexivity: Researchers actively reflecting on their own biases and how they might affect the research process.
- Triangulation: Using multiple data sources to minimize reliance on a single perspective.
- Peer debriefing: Discussing data and interpretations with colleagues to identify potential biases.
- Audit trail: Maintaining detailed records of research activities for transparency and scrutiny.
- Using diverse research teams: Bringing together researchers with different backgrounds and perspectives to reduce bias.
Q 7. What are some common biases in quantitative research and how can they be mitigated?
Quantitative research also faces potential biases. Sampling bias, as already mentioned, can skew results if the sample isn’t representative. Measurement bias occurs when the measurement instrument itself is flawed, leading to inaccurate data. Response bias can result from participants providing inaccurate or socially desirable answers. Publication bias, common in meta-analyses, occurs when studies with positive results are more likely to be published than those with null findings.
Strategies for mitigation include:
- Random sampling techniques: Employing methods such as simple random sampling or stratified random sampling to ensure a representative sample.
- Validated instruments: Using established and rigorously tested measurement instruments.
- Blinding: Concealing the treatment conditions from participants and researchers (in experiments) to reduce bias.
- Statistical controls: Adjusting for confounding variables during data analysis to minimize bias.
- Transparency and open science practices: Sharing data and methods openly to enable scrutiny and replication.
Q 8. Explain the concept of sampling in both qualitative and quantitative research.
Sampling, in both qualitative and quantitative research, is the process of selecting a subset of individuals or items from a larger population to gather data. The goal is to obtain a representative sample that accurately reflects the characteristics of the entire population, allowing us to make inferences about the population based on the sample data. However, the approaches differ significantly.
In quantitative research, the focus is on obtaining a statistically representative sample to generalize findings to a larger population. Larger sample sizes are often preferred to increase the precision and reliability of the estimates. Probability sampling techniques are commonly employed to ensure each member of the population has a known chance of being selected.
In qualitative research, the emphasis is on in-depth understanding of a phenomenon rather than statistical generalizability. Sample sizes are typically smaller, and the focus is on selecting participants who can provide rich and insightful data relevant to the research question. Purposive or theoretical sampling methods are frequently used to select participants based on their specific characteristics or experiences.
Q 9. What are different types of sampling techniques and when would you use each?
Several sampling techniques exist, each appropriate for different research contexts:
- Simple Random Sampling (Quantitative): Each member of the population has an equal chance of being selected. Imagine drawing names from a hat. This is good for large, easily accessible populations.
- Stratified Random Sampling (Quantitative): The population is divided into strata (subgroups), and a random sample is taken from each stratum. For instance, if studying customer satisfaction, you might stratify by age group to ensure representation from each age bracket.
- Cluster Sampling (Quantitative): The population is divided into clusters (e.g., schools within a district), and a random sample of clusters is selected. All members within the selected clusters are then included in the sample. Useful for geographically dispersed populations.
- Convenience Sampling (Qualitative & Quantitative): Participants are selected based on their availability. While easy, it’s prone to bias. For example, surveying only students who attend a particular class.
- Purposive Sampling (Qualitative): Participants are selected based on their specific characteristics or expertise relevant to the research question. For example, interviewing experts in a field to understand their perspectives on a particular issue.
- Snowball Sampling (Qualitative): Participants are asked to refer other potential participants. Helpful for reaching hard-to-reach populations.
- Theoretical Sampling (Qualitative): Sampling is driven by emerging themes and theoretical insights during data analysis. It’s iterative, with data collection and analysis happening simultaneously.
Q 10. Describe the process of developing a questionnaire for quantitative research.
Developing a questionnaire for quantitative research is a meticulous process. It involves several key steps:
- Define Objectives and Research Questions: Clearly articulate what you aim to measure. This will guide the development of specific questions.
- Identify Target Population: Understand the characteristics of the people you want to survey to tailor language and question types appropriately.
- Choose Question Types: Select appropriate question formats (e.g., multiple-choice, Likert scale, rating scales, open-ended) based on the type of data you want to collect. Multiple choice is good for objective data, Likert scales for attitudes, and open-ended for nuanced insights.
- Write Clear and Concise Questions: Avoid jargon, ambiguity, and leading questions. Each question should have a single, clear meaning.
- Pilot Test the Questionnaire: Administer the questionnaire to a small group to identify any issues with clarity, wording, or flow. Refine the questionnaire based on feedback received.
- Ensure Reliability and Validity: Consider established scales or validated instruments when available to enhance reliability and validity. Reliability refers to consistent measurements, and validity ensures the questionnaire measures what it intends to.
- Establish Ethical Considerations: Ensure informed consent, anonymity, and confidentiality are maintained throughout the process.
Q 11. Explain the process of conducting a thematic analysis of qualitative data.
Thematic analysis is a widely used qualitative data analysis method for identifying patterns, themes, and meanings within qualitative data. It’s a flexible approach adaptable to various research questions. The process typically includes:
- Familiarization with Data: Repeatedly read the data (transcripts, field notes, documents) to gain a general understanding.
- Coding: Identify meaningful segments of text and assign codes that capture the essence of each segment. These codes represent initial themes.
- Developing Themes: Group similar codes together to form broader themes that capture recurring patterns and meanings across the data. This is iterative and involves constant comparison and refinement.
- Reviewing Themes: Assess the coherence and validity of identified themes by comparing them with the original data. Refine and redefine themes as needed.
- Defining and Naming Themes: Develop detailed descriptions of each theme, providing specific examples from the data. Give meaningful names to themes.
- Writing up the Analysis: Present findings by describing the themes and illustrating them with relevant quotations from the data. This often involves developing a narrative that links themes together to answer research questions.
Q 12. How do you analyze data from open-ended survey questions?
Analyzing data from open-ended survey questions often involves a combination of qualitative and quantitative techniques. The process might look like this:
- Data Preparation: Transcribe the responses, ensuring accuracy and consistency.
- Coding and Categorization: Read through the responses multiple times. Identify recurring themes, ideas, and opinions. Assign codes or categories to represent these patterns. This may involve using software like NVivo or Atlas.ti.
- Frequency Counting: Once categorized, count the frequency of each code or category to obtain a quantitative summary of the responses. This provides insights into the prevalence of different views or opinions.
- Interpretation: Examine the frequency counts in relation to the themes you identified. Analyze the content of responses within each category for a richer understanding. This involves interpreting the meaning and significance of the patterns observed.
- Reporting: Summarize your findings, presenting both quantitative summaries (e.g., frequencies) and qualitative illustrations (e.g., excerpts of responses) to support your interpretations.
Consider using a mix of visual representations, such as charts and graphs alongside verbatim examples.
Q 13. What statistical software are you proficient in?
I am proficient in several statistical software packages, including:
- R: A powerful and versatile open-source language and environment for statistical computing and graphics.
- SPSS: A widely used commercial software package for statistical analysis.
- SAS: Another commercial software package, particularly strong for large-scale data analysis.
- Stata: A commercial software package known for its econometrics capabilities and user-friendly interface.
My expertise extends to data cleaning, manipulation, statistical modeling, and data visualization within these platforms.
Q 14. Explain the difference between descriptive and inferential statistics.
Descriptive statistics summarize and describe the main features of a dataset without making inferences about a larger population. They aim to provide a concise overview of the data. Examples include:
- Measures of central tendency: Mean, median, mode
- Measures of dispersion: Range, variance, standard deviation
- Frequency distributions: Histograms, bar charts
Inferential statistics, on the other hand, use sample data to make inferences and draw conclusions about a larger population. They involve hypothesis testing and estimation of population parameters. Examples include:
- t-tests: Comparing means between two groups
- ANOVA: Comparing means across multiple groups
- Regression analysis: Examining relationships between variables
Imagine surveying 100 students about their study habits. Descriptive statistics would tell you the average study time, the most common study location, etc. Inferential statistics would allow you to test if there’s a significant difference in study time between male and female students, generalizing this finding to the entire student population.
Q 15. What are different types of statistical tests and when would you use each?
Statistical tests are crucial for analyzing quantitative data and drawing meaningful conclusions. The choice of test depends heavily on the type of data you have (categorical or continuous), the number of groups you’re comparing, and the research question you’re asking. Here are a few examples:
- t-test: Compares the means of two groups. For example, comparing the average test scores of students who received a new teaching method versus those who received the traditional method. We’d use an independent samples t-test if the groups are independent and a paired samples t-test if the same subjects are measured twice (e.g., before and after an intervention).
- ANOVA (Analysis of Variance): Compares the means of three or more groups. For example, comparing the effectiveness of three different drugs in treating depression.
- Chi-square test: Analyzes the relationship between two categorical variables. For example, examining whether there’s an association between smoking status (smoker/non-smoker) and lung cancer diagnosis (yes/no).
- Correlation: Measures the strength and direction of the linear relationship between two continuous variables. For instance, investigating the correlation between hours of study and exam scores.
- Regression analysis: Predicts the value of one variable based on the value of one or more other variables. For example, predicting house prices based on size, location, and age.
Choosing the right test is critical for valid results. Incorrectly applying a test can lead to inaccurate conclusions.
Career Expert Tips:
- Ace those interviews! Prepare effectively by reviewing the Top 50 Most Common Interview Questions on ResumeGemini.
- Navigate your job search with confidence! Explore a wide range of Career Tips on ResumeGemini. Learn about common challenges and recommendations to overcome them.
- Craft the perfect resume! Master the Art of Resume Writing with ResumeGemini’s guide. Showcase your unique qualifications and achievements effectively.
- Don’t miss out on holiday savings! Build your dream resume with ResumeGemini’s ATS optimized templates.
Q 16. How do you interpret p-values and confidence intervals?
P-values and confidence intervals are both crucial for interpreting statistical results, but they provide different types of information.
P-value: The p-value represents the probability of obtaining the observed results (or more extreme results) if there is no real effect (the null hypothesis is true). A small p-value (typically less than 0.05) suggests that the observed results are unlikely to have occurred by chance alone, leading us to reject the null hypothesis. Think of it as the strength of evidence *against* the null hypothesis. It doesn’t tell us about the size of the effect.
Confidence interval (CI): A confidence interval provides a range of plausible values for a population parameter (e.g., mean difference between groups). A 95% confidence interval means that if we were to repeat the study many times, 95% of the calculated confidence intervals would contain the true population parameter. A narrower CI indicates greater precision in estimating the parameter.
Example: Let’s say we’re comparing two groups’ average heights. We might get a p-value of 0.01 and a 95% confidence interval of (2.5 cm, 4.5 cm). The p-value tells us that the difference in heights is statistically significant (unlikely due to chance), while the confidence interval tells us that the true difference in average heights is likely between 2.5 cm and 4.5 cm.
Q 17. Explain the concept of effect size and its importance.
Effect size quantifies the magnitude of an effect, irrespective of sample size. It answers the question: “How big is the effect?” Unlike p-values, which are influenced by sample size, effect size provides a standardized measure of the difference or relationship between variables. This is crucial because a statistically significant result (low p-value) with a small effect size might not be practically meaningful.
Importance: Effect size is vital for several reasons:
- Practical significance: A small effect might be statistically significant in a large sample but practically insignificant. Effect size helps us determine the real-world importance of the findings.
- Meta-analysis: Effect sizes allow researchers to combine results from multiple studies, providing a more robust understanding of an effect.
- Power analysis: Effect size is needed to determine the sample size required for a study to have sufficient power to detect a meaningful effect.
Examples: Common effect size measures include Cohen’s d (for comparing means), Pearson’s r (for correlation), and eta-squared (for ANOVA).
Q 18. How do you handle missing data in a quantitative dataset?
Missing data is a common challenge in quantitative research. How you handle it can significantly impact your results. There’s no single “best” method, and the optimal approach depends on the pattern and extent of missing data, as well as the characteristics of your dataset.
- Listwise deletion: The simplest approach. Exclude any participant with any missing data. This is easy but can lead to substantial loss of data and bias if the missing data is not completely random.
- Pairwise deletion: Use all available data for each analysis. This can be problematic if different analyses use different subsets of data.
- Imputation: Replace missing values with estimated values. Common methods include mean/median imputation (simple but potentially problematic), regression imputation, and multiple imputation (more sophisticated, preferred for complex patterns of missing data). Multiple imputation is generally recommended because it accounts for uncertainty in the imputed values.
Before choosing a method, it’s important to understand the mechanism of missing data (missing completely at random (MCAR), missing at random (MAR), or missing not at random (MNAR)) and assess the impact of missing data on your results.
Q 19. How do you visualize data effectively for both qualitative and quantitative findings?
Effective data visualization is key to communicating research findings clearly and concisely. The choice of visualization depends on the type of data and the message you want to convey.
Quantitative Data:
- Histograms and box plots: Show the distribution of a continuous variable.
- Scatter plots: Illustrate the relationship between two continuous variables.
- Bar charts and pie charts: Display the frequencies or proportions of categorical variables.
- Line graphs: Show trends over time.
Qualitative Data:
- Word clouds: Highlight frequently occurring words in textual data.
- Network diagrams: Show relationships between concepts or themes.
- Theme maps: Visually represent key themes identified in qualitative data.
- Quotes or excerpts: Illustrate specific points or findings.
Regardless of data type, good visualizations are clear, concise, accurately represent the data, and avoid misleading the audience.
Q 20. What ethical considerations are important in qualitative and quantitative research?
Ethical considerations are paramount in both qualitative and quantitative research. They ensure the protection of participants’ rights and the integrity of the research process.
Quantitative Research:
- Informed consent: Participants must be fully informed about the study’s purpose, procedures, and potential risks before agreeing to participate.
- Data privacy and confidentiality: Protecting participants’ identities and ensuring that data is handled securely and responsibly is crucial.
- Avoiding bias: Researchers must strive to design and conduct the study in a way that minimizes bias and ensures the results are accurate and reliable.
Qualitative Research:
- Anonymity and confidentiality: Protecting participants’ identities is critical, especially in sensitive topics.
- Reflexivity: Researchers must acknowledge their own biases and how they might influence the research process and interpretation of findings.
- Ethical reporting: Researchers should accurately represent the data and findings, avoiding misrepresentation or selective reporting.
- Vulnerable populations: Extra precautions are needed when working with vulnerable populations (e.g., children, people with disabilities) to ensure their well-being and protect their rights.
Ethical review boards (IRBs) play a vital role in ensuring that research is conducted ethically.
Q 21. Describe a time you had to deal with conflicting qualitative and quantitative findings.
In a study examining the effectiveness of a new employee training program, we found conflicting results. Quantitative data (test scores, productivity metrics) showed a modest but statistically significant improvement in the trained group. However, qualitative data (interviews with employees) revealed significant dissatisfaction with certain aspects of the program, suggesting a negative impact on employee morale and engagement. This created a tension between the positive quantitative results and the negative qualitative feedback.
To resolve this conflict, we delved deeper into the data. We analyzed the qualitative data more thoroughly, identifying specific aspects of the program that caused dissatisfaction. We then revisited the quantitative data to see if subgroups within the trained group exhibited varying levels of improvement based on factors identified in the qualitative data. This revealed that while the overall improvement was modest, certain subgroups (those who found the program engaging) showed significantly better results. This integrated analysis allowed us to present a more nuanced and accurate picture of the program’s impact, highlighting both its strengths and weaknesses and guiding improvements for future iterations.
Q 22. How do you ensure the generalizability of your research findings?
Ensuring the generalizability of research findings, often called external validity, is crucial for ensuring the results of a study can be applied to a larger population beyond the specific sample studied. It’s like baking a cake – you wouldn’t want a recipe that only works with one specific oven and type of flour! To achieve this, we need to carefully consider the sampling method.
Representative Sampling: Employing probability sampling techniques, such as simple random sampling, stratified sampling, or cluster sampling, is key. These methods ensure every member of the population has a known chance of being selected, increasing the likelihood that the sample accurately reflects the population.
Large Sample Size: Larger samples provide more statistical power, reducing the margin of error and increasing confidence in the results’ generalizability. Think of it like taking more measurements when trying to determine the average height of trees in a forest – the more trees you measure, the more accurate your average will be.
Clearly Defined Population: Specifying the target population precisely avoids misinterpretations and limits the scope of generalizability. For instance, a study on the effectiveness of a new teaching method in elementary schools shouldn’t be generalized to high school students without further research.
Replication: Conducting the study again with different samples and in different settings can confirm the robustness of the findings and increase confidence in their generalizability. This is like testing the cake recipe in multiple ovens and with different flours.
By carefully addressing these aspects, we significantly improve the chances that our research conclusions can be validly extended to a broader context.
Q 23. Explain the concept of triangulation in research.
Triangulation is a powerful research strategy that involves using multiple methods, data sources, or perspectives to examine the same phenomenon. It’s similar to using multiple GPS devices to locate a precise location – a single device might be slightly off, but using several increases the accuracy significantly.
Methodological Triangulation: Combining qualitative and quantitative approaches. For example, using surveys (quantitative) to gather broad data and then conducting interviews (qualitative) to explore specific responses in more depth.
Data Source Triangulation: Using data from different sources, such as interviews, observations, and documents. This helps validate findings by looking for consistency across different types of evidence. For example, examining employee satisfaction using surveys, focus groups, and performance reviews.
Investigator Triangulation: Employing multiple researchers to analyze the data independently. This minimizes bias and helps ensure the interpretations are reliable. This is akin to having multiple chefs taste-test the cake recipe to ensure consistency of taste and quality.
Theory Triangulation: Using different theoretical lenses to interpret the data. This can reveal different nuances and interpretations of the same data. For example, applying social cognitive theory and social exchange theory to understand workplace behavior.
Triangulation enhances the validity and reliability of research findings by providing a more comprehensive and robust understanding of the research question.
Q 24. How do you choose the appropriate research method (qualitative or quantitative) for a given research question?
Choosing between qualitative and quantitative research methods depends heavily on the research question. The key difference lies in the type of data collected and the way it is analyzed.
Quantitative Research: Suitable for questions focusing on measuring and quantifying variables, testing hypotheses, and identifying relationships between variables. This is usually employed when you need numerical data to draw statistical conclusions. Example: What is the correlation between hours of study and exam scores?
Qualitative Research: Best suited for exploring complex social phenomena, understanding experiences and perspectives, and generating hypotheses. This method delves deep into the ‘why’ behind behaviors or events. Example: How do students experience online learning during a pandemic?
If your research question requires measuring and testing relationships, use quantitative methods. If it requires in-depth understanding and exploration of complex phenomena, then qualitative methods are more appropriate. Sometimes, a mixed-methods approach, combining both, can offer a richer understanding.
Q 25. What are some limitations of qualitative research?
Qualitative research, while valuable for in-depth understanding, has some limitations:
Subjectivity: Interpretation of qualitative data can be subjective and influenced by the researcher’s biases. Mitigation strategies include using multiple researchers, rigorous coding schemes, and transparent reporting methods.
Limited Generalizability: Findings from small, purposive samples may not be easily generalizable to larger populations. Strategies to address this include careful sampling and theoretical sampling.
Time-Consuming: Data collection and analysis can be time-intensive, especially with detailed interviews or extensive fieldwork.
Difficult to Replicate: The context-dependent nature of qualitative research can make replication challenging.
It’s essential to acknowledge these limitations when conducting and interpreting qualitative research.
Q 26. What are some limitations of quantitative research?
Quantitative research, while offering statistical power, also presents limitations:
Superficial Understanding: Focus on quantifiable variables can lead to a superficial understanding of complex phenomena. The ‘what’ might be clear, but the ‘why’ may remain hidden.
Oversimplification: Reducing complex realities to numerical data can result in oversimplification and loss of context.
Artificiality: The controlled environment of many quantitative studies can create artificial situations that may not reflect real-world contexts.
Measurement Issues: The validity and reliability of measurement tools and instruments can significantly impact the accuracy of results.
These limitations highlight the need for careful consideration of research design and measurement techniques.
Q 27. Describe your experience with data cleaning and preparation.
Data cleaning and preparation is a critical step in any research project, regardless of the method. My experience involves several key stages:
Data Import and Inspection: This initial step involves importing data from various sources (surveys, databases, etc.) and visually inspecting it for inconsistencies, errors, and missing values.
Data Cleaning: This involves addressing issues like outliers, missing values, and inconsistencies. Strategies include removing outliers, imputing missing data using appropriate methods (e.g., mean imputation, regression imputation), and correcting errors based on data patterns or external information.
Data Transformation: This may involve converting data into a suitable format for analysis (e.g., recoding variables, creating new variables from existing ones). For example, transforming raw scores into z-scores for standardization. I’m proficient in using statistical software like R and SPSS for these tasks.
Data Validation: Before proceeding to analysis, I always conduct validation checks to ensure data accuracy and consistency, utilizing both visual checks and statistical methods.
I have extensive experience handling large datasets and managing data cleaning challenges, ensuring the integrity of the data used in subsequent analysis.
Q 28. Describe your experience with reporting research findings.
Reporting research findings is the final, yet crucial, stage of the research process. My experience includes:
Structured Reporting: I follow a consistent structure in my reports, generally including an abstract, introduction, methodology, results, discussion, and conclusion.
Clear and Concise Writing: I ensure the findings are communicated clearly and concisely, avoiding jargon unless absolutely necessary, and using visual aids (tables, charts, graphs) to enhance understanding.
Data Visualization: I utilize appropriate data visualization techniques to effectively present the findings, selecting charts and graphs that best represent the data and conclusions.
Interpretation and Discussion: I go beyond simply presenting the data; I interpret the findings, discussing their implications, limitations, and future research directions.
Tailoring to Audience: I adapt my reporting style to the target audience, considering their level of understanding and knowledge of the research topic.
I’m proficient in preparing reports for academic journals, conferences, and other professional settings, ensuring that the findings are presented accurately and effectively.
Key Topics to Learn for Qualitative and Quantitative Assessment Methods Interview
- Qualitative Methods: Understanding the Nuances: Explore different qualitative approaches like interviews, focus groups, and ethnography. Understand data collection techniques, analysis strategies (e.g., thematic analysis, grounded theory), and the strengths and limitations of each method. Consider ethical implications in qualitative research.
- Quantitative Methods: Harnessing the Power of Data: Master core statistical concepts like descriptive statistics, inferential statistics (hypothesis testing, regression analysis), and different sampling techniques. Familiarize yourself with various quantitative research designs (e.g., experimental, correlational). Practice interpreting statistical output and drawing meaningful conclusions.
- Mixed Methods Research: Blending Perspectives: Understand the rationale and strategies for combining qualitative and quantitative methods in a single study. Explore different mixed methods designs and how to integrate findings from both approaches to gain a comprehensive understanding.
- Practical Applications: Real-World Scenarios: Prepare examples of how you’ve applied or would apply these methods to solve real-world problems. Think about case studies in your field and how different assessment methods would be appropriate and insightful.
- Data Visualization and Reporting: Communicating Your Findings Effectively: Practice creating clear and concise visualizations of data from both qualitative and quantitative sources. Learn to effectively communicate your findings in written reports or presentations.
- Reliability and Validity: Ensuring the Quality of Your Assessments: Deepen your understanding of the key concepts of reliability and validity in both qualitative and quantitative research and how they apply to the various methods you’ve studied. Be prepared to discuss how you ensure rigor in your assessment work.
- Critical Evaluation of Research: Assessing the Strengths and Weaknesses of Studies: Develop your ability to critically evaluate research papers, considering methodological strengths, limitations, and potential biases.
Next Steps
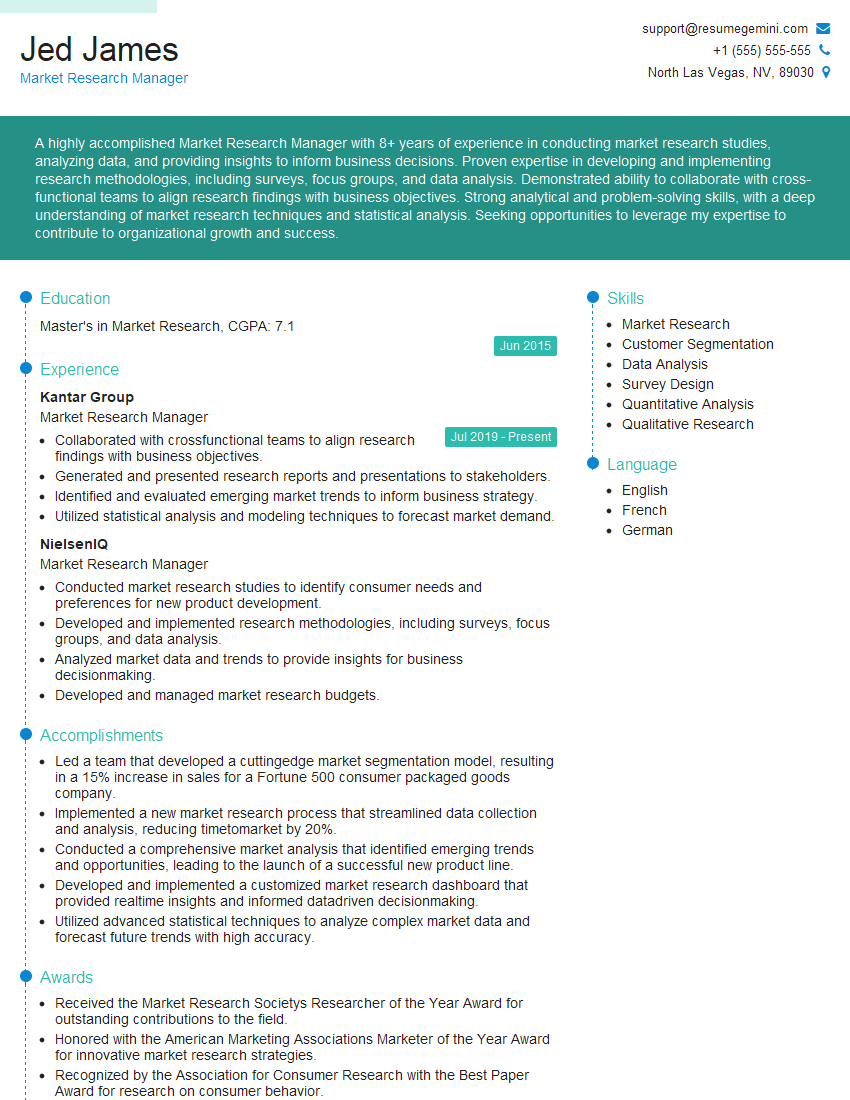
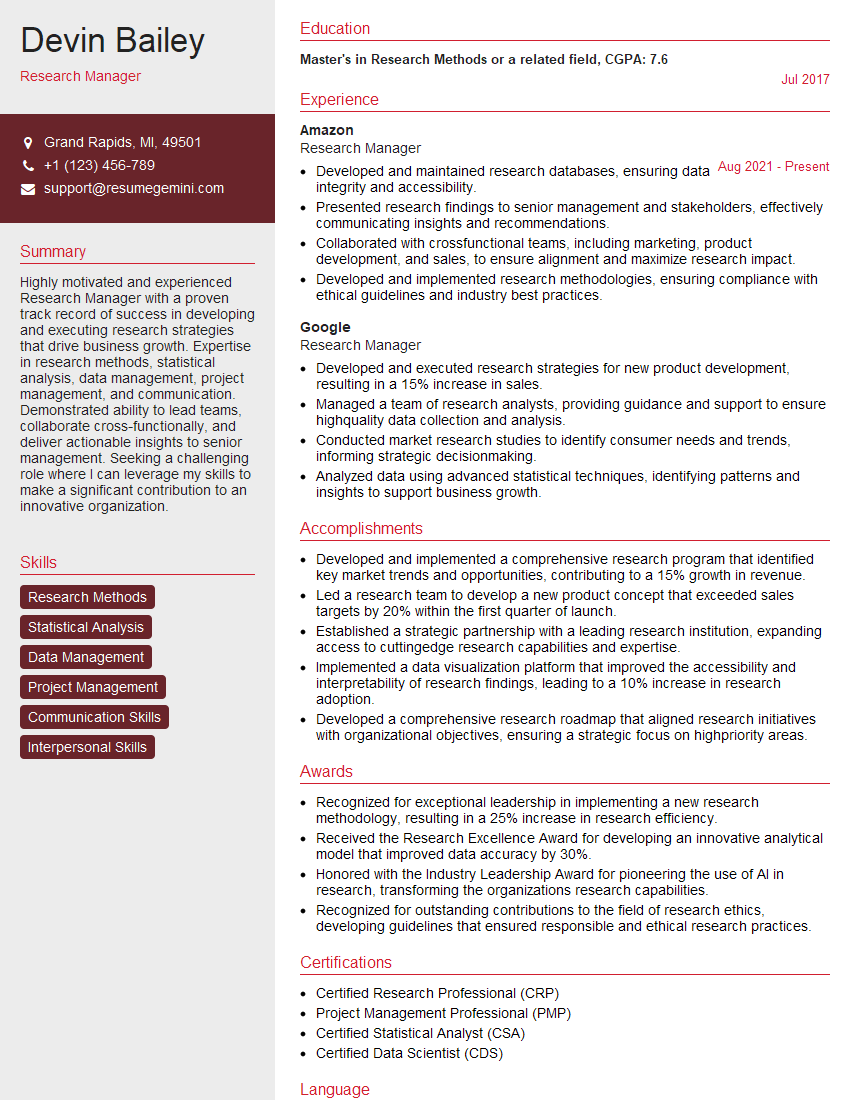
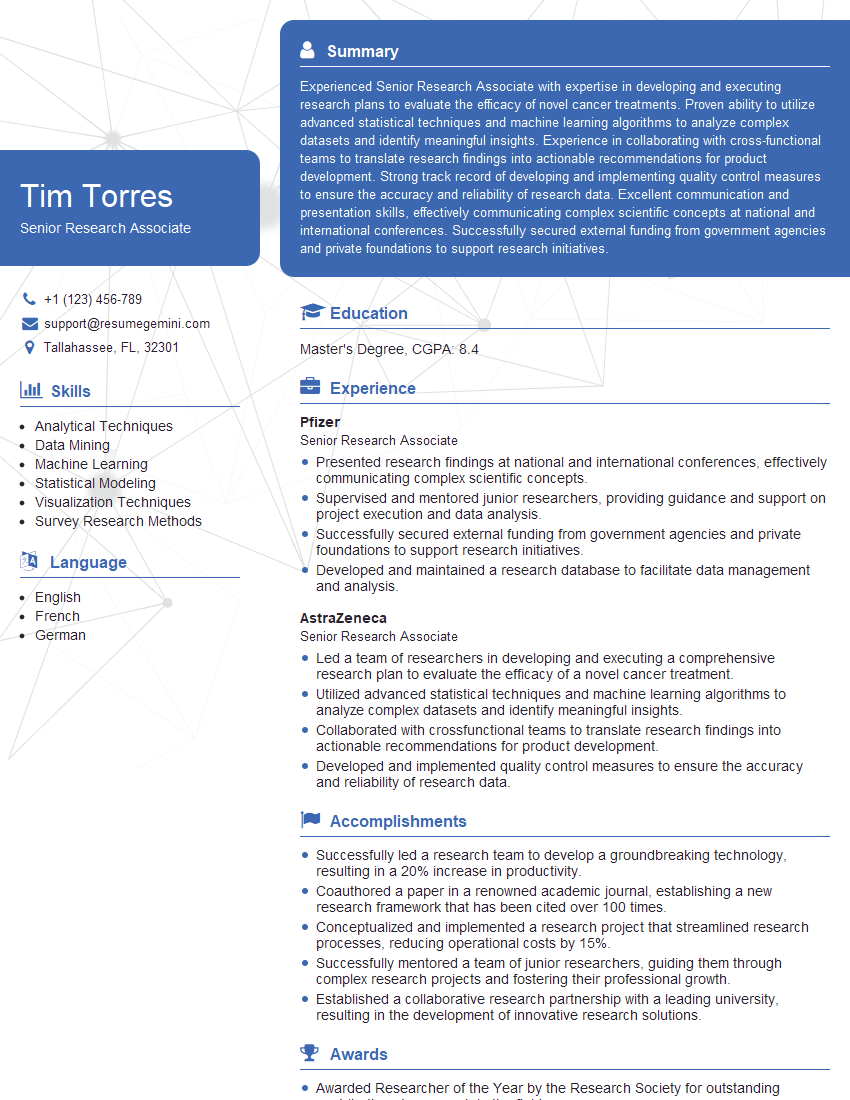
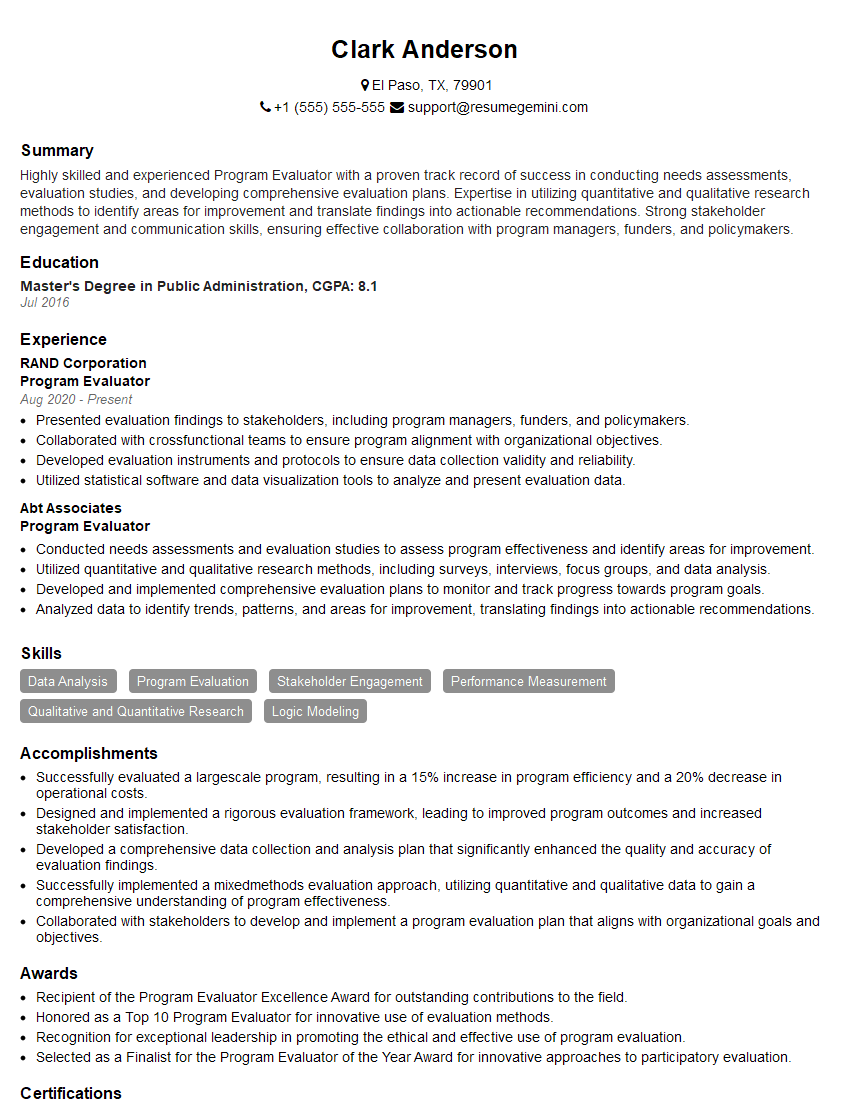
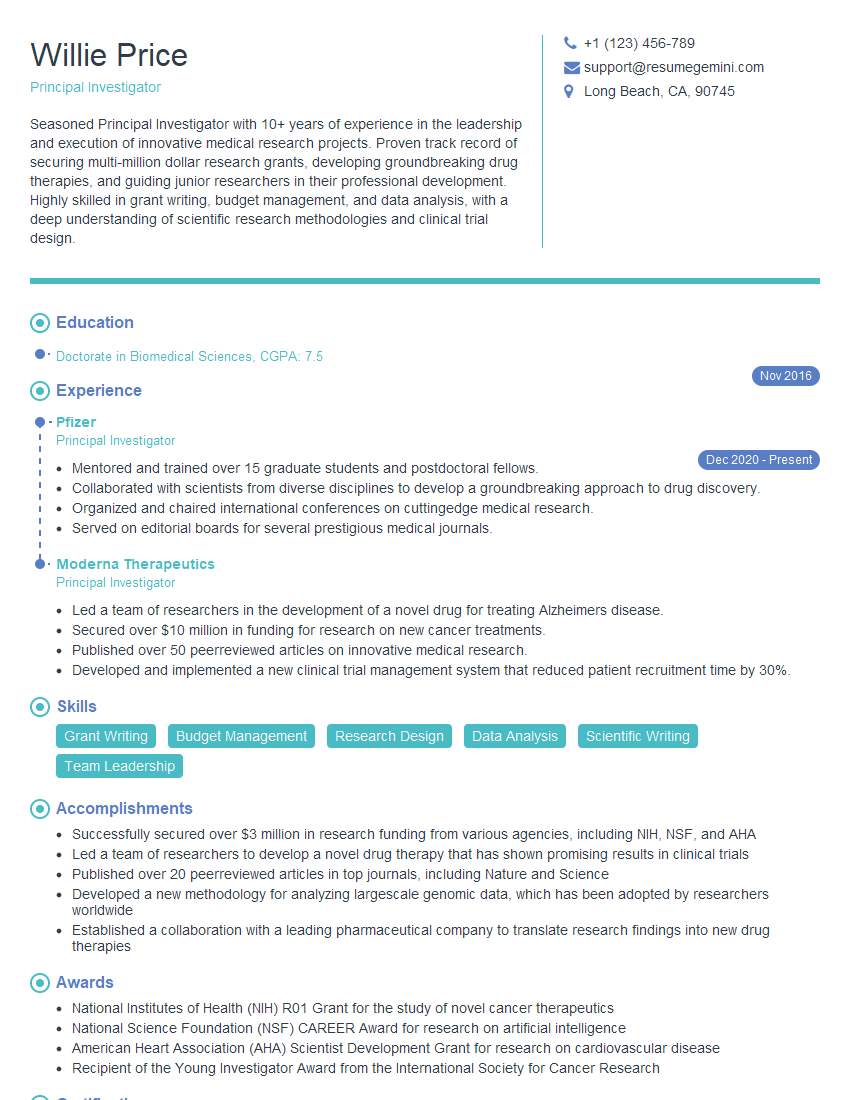
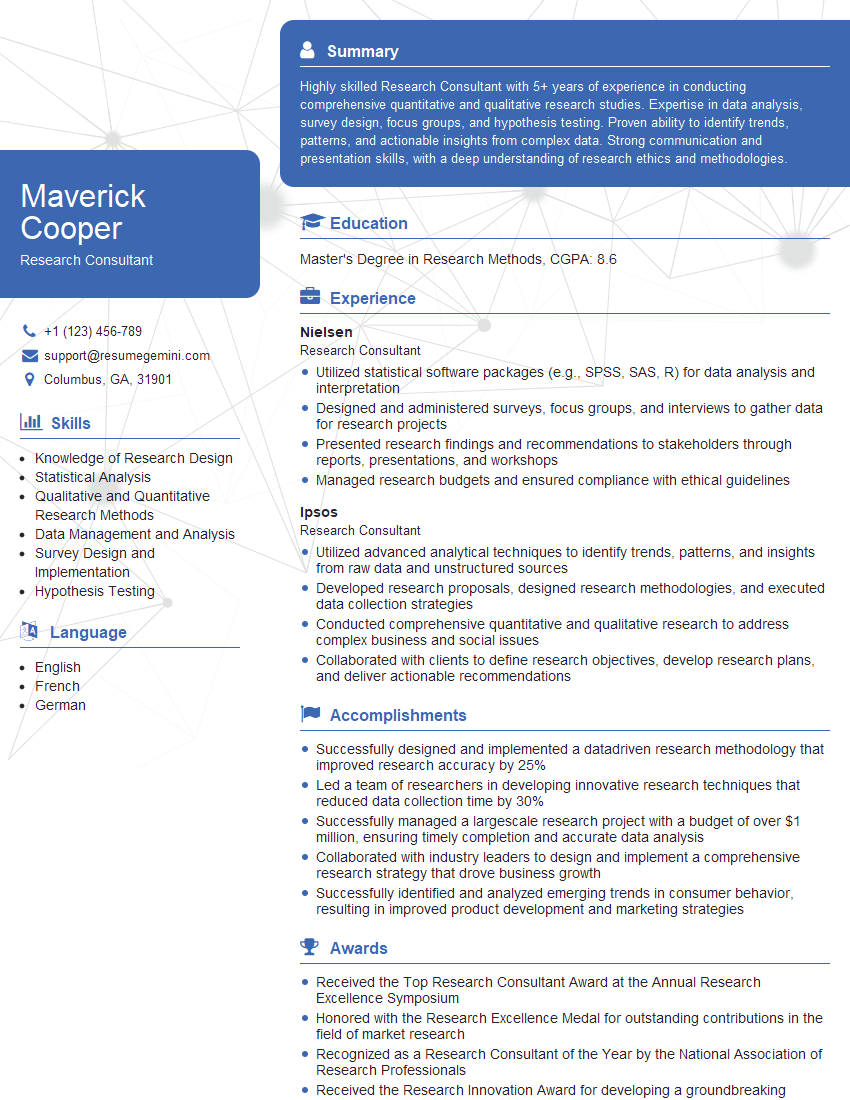
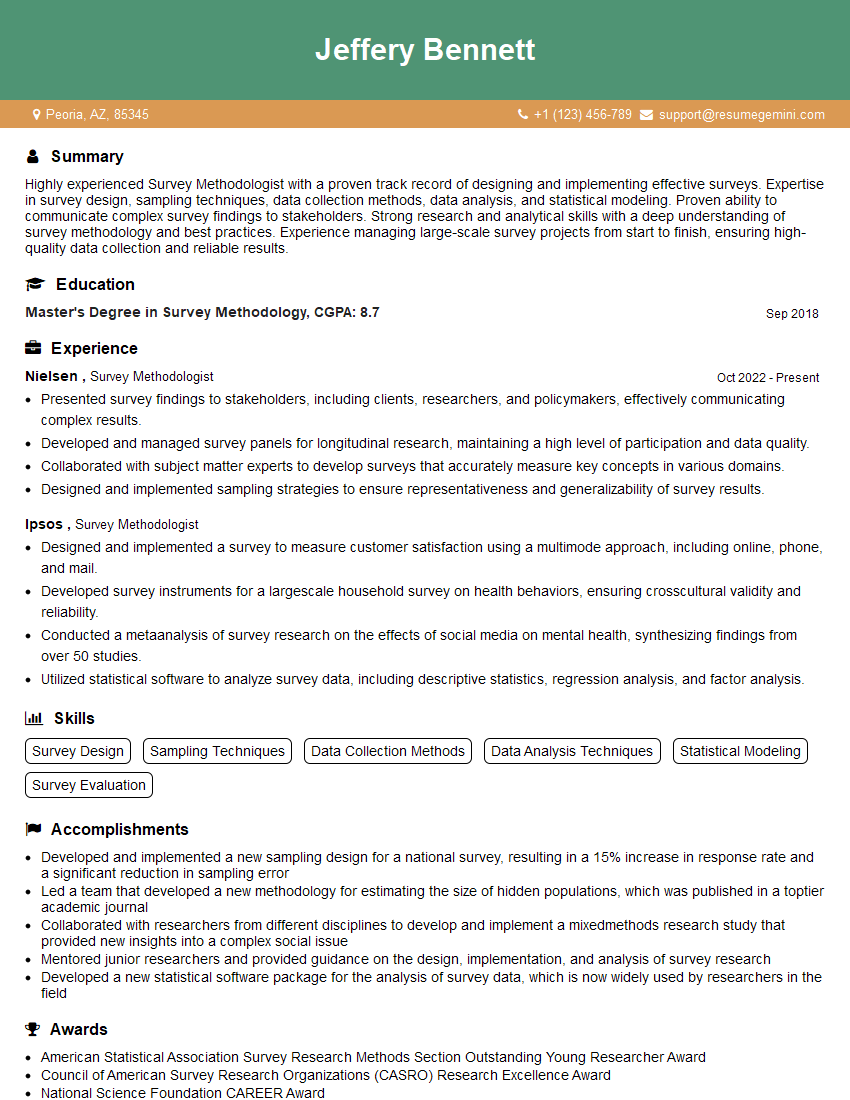
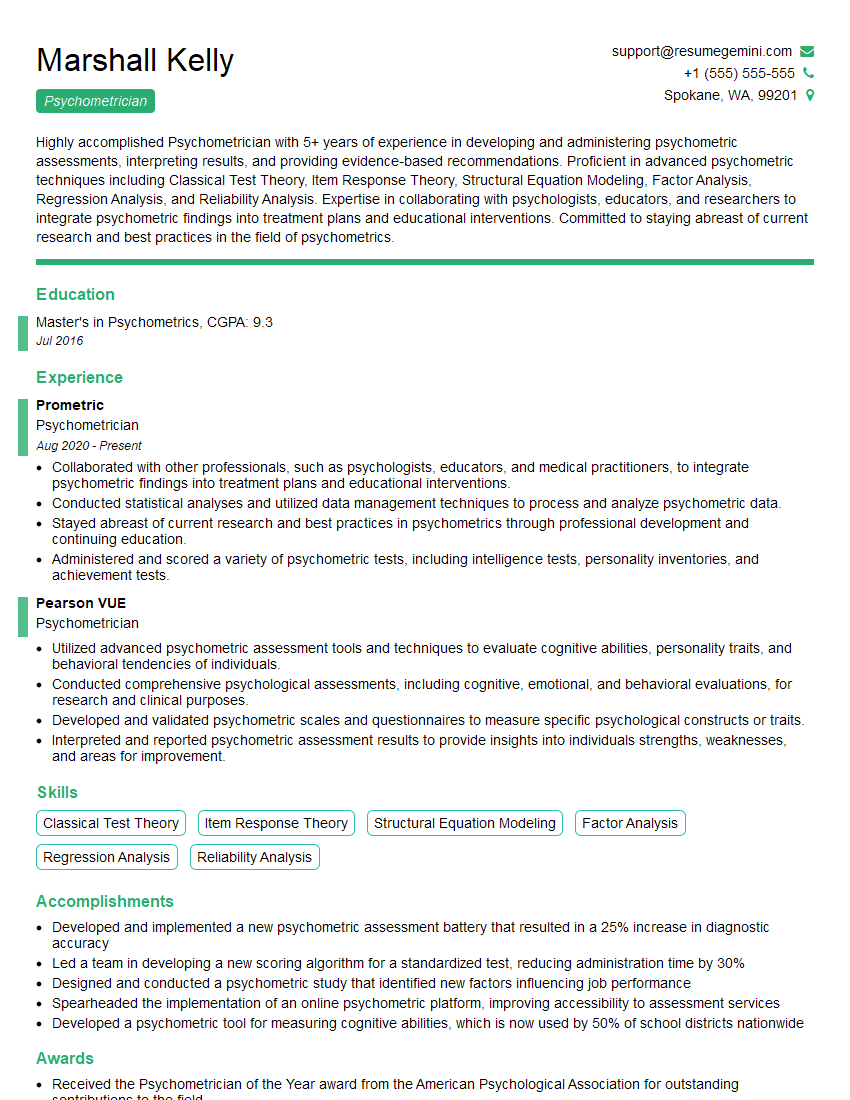
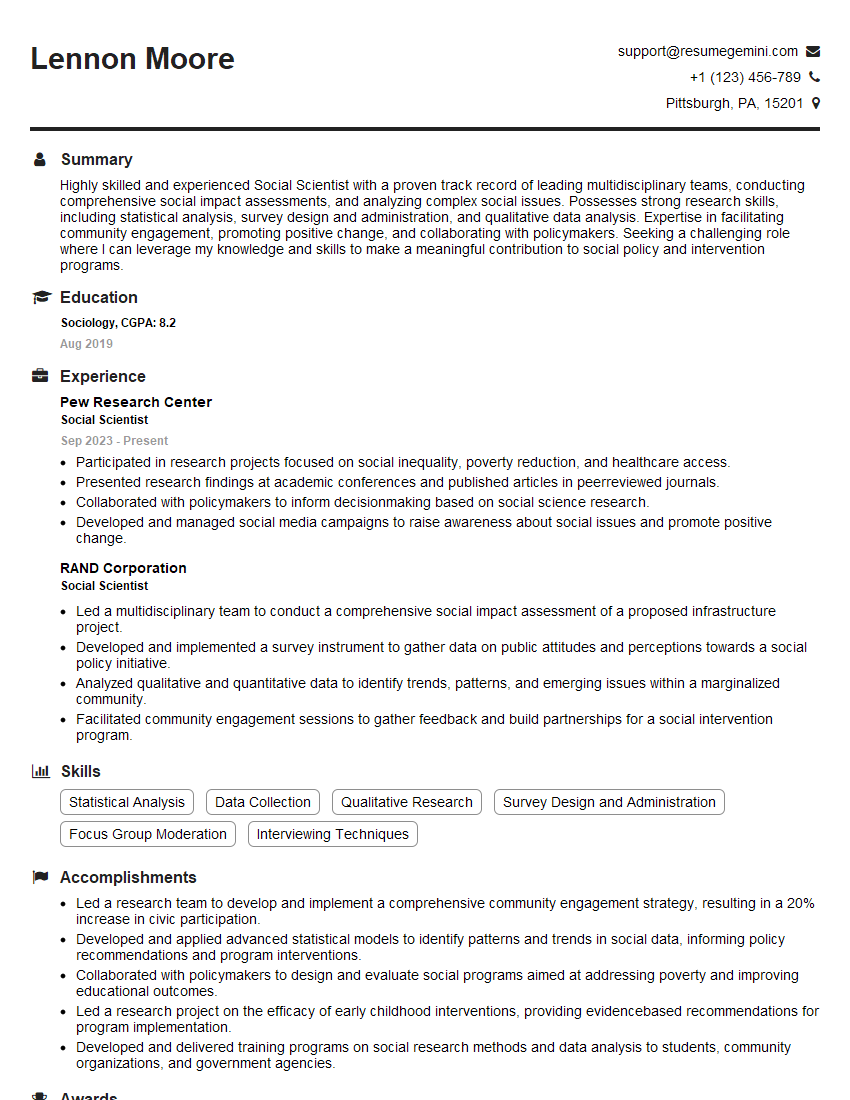
Mastering Qualitative and Quantitative Assessment Methods significantly enhances your analytical skills and problem-solving abilities, making you a highly valuable asset in any field requiring data-driven decision-making. This expertise opens doors to exciting career opportunities and advancements. To maximize your job prospects, it’s crucial to present your skills effectively through a well-crafted, ATS-friendly resume. ResumeGemini is a trusted resource to help you build a professional resume that highlights your achievements and catches the eye of recruiters. We provide examples of resumes tailored to showcase expertise in Qualitative and Quantitative Assessment Methods – use them as inspiration to build your own compelling application materials.
Explore more articles
Users Rating of Our Blogs
Share Your Experience
We value your feedback! Please rate our content and share your thoughts (optional).
What Readers Say About Our Blog
This was kind of a unique content I found around the specialized skills. Very helpful questions and good detailed answers.
Very Helpful blog, thank you Interviewgemini team.
