Unlock your full potential by mastering the most common Research and Presentation interview questions. This blog offers a deep dive into the critical topics, ensuring you’re not only prepared to answer but to excel. With these insights, you’ll approach your interview with clarity and confidence.
Questions Asked in Research and Presentation Interview
Q 1. Describe your experience conducting quantitative research.
My experience with quantitative research spans several projects, focusing primarily on the application of statistical methods to understand and analyze numerical data. For instance, in a recent study examining the effectiveness of a new teaching method, I utilized a pre- and post-test design. This involved administering a standardized test to a control group and an experimental group before and after the intervention. I then employed t-tests and ANOVA to compare the mean scores between groups and determine the statistical significance of the intervention’s impact. This involved meticulous data cleaning, ensuring accurate coding and handling of missing data. I also leveraged statistical software packages like R and SPSS for data analysis, visualization, and report generation. The results were presented using tables, graphs, and effect sizes to clearly communicate the findings to both technical and non-technical audiences.
Q 2. Explain your process for qualitative data analysis.
My qualitative data analysis process follows a systematic approach, starting with meticulous transcription of interviews, focus group discussions, or observational notes. I then employ thematic analysis, a widely-used method for identifying recurring patterns, themes, and concepts within the data. This involves coding individual data segments (e.g., sentences or paragraphs) and then grouping similar codes into broader themes. For instance, in a study exploring patient experiences with a new healthcare system, I identified recurring themes related to wait times, communication with staff, and overall satisfaction. I use software like NVivo to manage and organize the large volume of data and to facilitate the coding and thematic analysis process. The final analysis is presented as a narrative, supported by illustrative quotes from the participants to give a voice to their experiences. Throughout the process, careful attention is paid to ensuring the trustworthiness and credibility of the interpretations through techniques like member checking and triangulation.
Q 3. How do you identify and address biases in research?
Addressing biases is crucial for maintaining research integrity. I employ several strategies to mitigate bias throughout the research process. Firstly, I carefully consider the potential sources of bias during the study design phase. This includes acknowledging potential researcher bias, participant bias (e.g., social desirability bias), and sampling bias. To minimize researcher bias, I utilize pre-defined coding schemes and standardized procedures for data collection and analysis. To address participant bias, I ensure anonymity and confidentiality to encourage honest responses. To tackle sampling bias, I strive for diverse and representative samples whenever possible. Furthermore, I utilize reflexivity—critical reflection on my own assumptions and potential biases—throughout the research process. This involves regularly reviewing my own involvement and influence to ensure objectivity. Finally, peer review of research design and findings offers a crucial external check to identify potential biases.
Q 4. What research methodologies are you most familiar with?
My research experience encompasses a range of methodologies. I’m highly proficient in quantitative methods such as experimental designs, surveys, and quasi-experimental designs. I’m also well-versed in qualitative methods, including thematic analysis, grounded theory, and ethnography. I have experience with mixed-methods research, combining quantitative and qualitative approaches to gain a more holistic understanding of a research question. For example, I’ve used surveys to gather quantitative data on user satisfaction with a software application, while simultaneously conducting interviews to gain a deeper understanding of their experiences. Furthermore, I’m familiar with action research, where research and action are intertwined to solve real-world problems. My choice of methodology is always driven by the research question and the nature of the data needed to answer it effectively.
Q 5. Describe a time you had to overcome a research challenge.
During a study examining the impact of social media on adolescent mental health, I encountered a significant challenge related to participant recruitment. Initial attempts to recruit participants through social media platforms yielded low response rates and a non-representative sample. To overcome this, I adapted my recruitment strategy. I collaborated with local schools and youth organizations to access a more diverse and representative group of participants. This involved obtaining ethical approvals from relevant institutions and carefully tailoring communication materials to resonate with the target population. The revised approach significantly improved recruitment rates and ensured the study’s findings were more generalizable. This experience highlighted the importance of flexibility and adaptability in research, demonstrating that successful research requires a willingness to adjust methods when encountering unexpected challenges.
Q 6. How do you ensure the accuracy and validity of your research findings?
Ensuring accuracy and validity is paramount. For quantitative research, I use rigorous statistical techniques, ensuring appropriate sample size, testing assumptions of statistical tests, and reporting effect sizes to indicate the strength of the relationships observed. I also strive for high reliability through well-defined measures and standardized procedures. For qualitative research, I employ strategies to enhance trustworthiness, including prolonged engagement with participants, member checking (sharing interpretations with participants for feedback), triangulation (using multiple data sources), and reflexivity. Clearly documenting all aspects of the research process, from data collection to analysis, is crucial for transparency and reproducibility. This involves maintaining detailed records of methods, data, and analyses which allows for independent verification and assessment of the research’s quality and integrity. All this ensures the research findings are as robust and reliable as possible.
Q 7. How do you synthesize complex research findings for a non-technical audience?
Synthesizing complex research findings for non-technical audiences requires clear and concise communication. I avoid technical jargon and use simple language and analogies to explain complex concepts. For example, instead of saying “the p-value was less than 0.05,” I might say “the results were statistically significant, meaning the findings are unlikely to be due to chance.” Visual aids like charts, graphs, and infographics are essential for conveying information effectively. I also focus on telling a compelling story, emphasizing the key findings and their implications in a way that resonates with the audience. Furthermore, I tailor my communication style to the specific audience, considering their prior knowledge and interests. For example, a presentation for a group of policymakers might focus on the practical implications of the research, while a presentation for the general public might emphasize the broader impact on society.
Q 8. What software or tools do you use for data analysis and visualization?
My data analysis and visualization workflow relies on a suite of tools tailored to different stages of the research process. For data cleaning and manipulation, I heavily utilize Python with libraries like Pandas and NumPy. These provide powerful tools for data wrangling, handling missing values, and transforming datasets into suitable formats for analysis. For statistical analysis, I leverage R, especially for its extensive statistical packages like ggplot2 for visualizations and dplyr for data manipulation. For more complex analyses, particularly those involving machine learning, I utilize Python libraries like Scikit-learn and TensorFlow/Keras. Finally, for creating visually appealing and interactive dashboards, I frequently use Tableau and Power BI, which allow for easy sharing and exploration of findings. The choice of tool depends on the specific research question, the size of the dataset, and the desired level of interactivity in the final output.
For example, in a recent project analyzing customer churn, I used Pandas to clean and preprocess the dataset, Scikit-learn to build a predictive model, and Tableau to create interactive dashboards visualizing the model’s performance and key customer segments.
Q 9. Describe your experience designing and delivering presentations.
Designing and delivering presentations is a core aspect of my research work. My approach emphasizes clarity, conciseness, and visual appeal. I start by carefully defining the key message and tailoring the content to the specific audience and their level of expertise. I then structure the presentation logically, using a clear narrative arc with a strong introduction, well-defined sections, and a compelling conclusion. I am proficient in using presentation software such as PowerPoint and Google Slides to create visually engaging presentations, incorporating charts, graphs, and images to illustrate key findings. My delivery style is engaging and confident, incorporating storytelling techniques to connect with the audience on an emotional level. I regularly seek feedback to refine my presentation skills and ensure maximum impact.
For instance, when presenting research at a scientific conference, my focus is on providing detailed methodology and results, while for a presentation to executives, I prioritize concise summaries and actionable insights.
Q 10. How do you tailor your presentation style to different audiences?
Adapting my presentation style to diverse audiences is crucial. I consider factors like the audience’s prior knowledge, their level of interest in the topic, and their expectations. For technical audiences, I provide detailed explanations of methodologies and results, using specialized jargon where appropriate. For non-technical audiences, I simplify complex information using clear language, analogies, and visual aids. I also adjust my communication style – using a more formal tone for academic audiences and a more conversational tone for business audiences. The length and depth of the presentation are also adapted to the time allocated and the audience’s attention span. For example, a presentation to a board of directors would be significantly shorter and more focused on high-level results than a presentation at a research seminar.
Q 11. How do you handle challenging questions during a presentation?
Handling challenging questions during presentations requires preparation and composure. I begin by anticipating potential questions based on the content and the audience. This allows me to prepare thoughtful answers beforehand. During the Q&A session, I listen carefully to each question, restate it to ensure understanding, and respond thoughtfully and honestly. If I don’t know the answer, I admit it openly and promise to follow up. My goal is to engage in a constructive dialogue, even with challenging questions, demonstrating professionalism and a willingness to learn and explore further. I avoid getting defensive and instead view challenging questions as an opportunity to clarify misunderstandings and deepen audience engagement.
Q 12. How do you incorporate visuals effectively into your presentations?
Visuals are integral to effective presentations. I use them to support and enhance my narrative, not simply to decorate the slides. I prioritize clarity and simplicity, avoiding overly complex charts or cluttered slides. I carefully select visuals relevant to the topic and ensure they are high-quality and easily understandable. Data visualizations, such as charts and graphs, are used to present key findings concisely. Images and diagrams can be used to illustrate complex concepts or provide visual context. The choice of visuals is always tailored to the audience and the specific message being conveyed. For example, using a simple bar chart to show key performance indicators is more effective than a complex scatter plot for a business audience unless there is a need for a detailed statistical analysis.
Q 13. What strategies do you use to engage your audience during a presentation?
Audience engagement is paramount. I employ several strategies to keep the audience actively involved. This includes incorporating interactive elements such as polls, quizzes, or Q&A sessions throughout the presentation, not just at the end. I also use storytelling techniques to make the content more relatable and memorable. I maintain eye contact with the audience, use varied vocal tones, and incorporate natural pauses for emphasis. Body language, such as gestures and movement, helps to maintain a dynamic and engaging presence. Humor, when appropriate, can help to lighten the mood and improve audience receptiveness. Finally, I actively encourage audience participation by inviting questions and comments throughout the presentation, fostering a sense of dialogue and collaboration.
Q 14. Describe your experience creating presentation materials (e.g., slides, handouts).
Creating compelling presentation materials involves a multi-step process. I start by outlining the content, ensuring a logical flow and clear message. I then design the slides using presentation software, focusing on a consistent design and visual style. The use of high-quality images, graphics, and data visualizations is crucial. For complex information, I often prepare supporting documents, such as handouts or detailed reports, to provide the audience with additional information. I always ensure the materials are accessible and easy to understand, using clear fonts, consistent formatting, and appropriate visual aids. I often test the presentation beforehand to ensure everything flows smoothly and is clear to the audience. I always aim for a visually appealing yet functional presentation, balancing aesthetics with clarity and information delivery.
Q 15. How do you manage your time effectively when preparing for a presentation?
Effective time management when preparing a presentation is crucial. My approach is based on a structured plan, breaking down the process into manageable tasks with deadlines. I begin with a detailed outline, allocating specific time slots for each stage: research, script writing, slide design, rehearsal, and contingency planning. For instance, if I have a two-week deadline, I might dedicate the first three days to in-depth research, the next three to script and slide creation, and the remaining time for refinement and practice. Using project management tools like Trello or Asana can further enhance organization and tracking progress.
I also prioritize tasks based on their importance and urgency. The most critical elements – like ensuring the core message is clear and compelling – receive my attention first. I avoid multitasking to maintain focus, working in dedicated blocks of time to minimize distractions. Regular breaks are essential for preventing burnout and maintaining productivity.
Career Expert Tips:
- Ace those interviews! Prepare effectively by reviewing the Top 50 Most Common Interview Questions on ResumeGemini.
- Navigate your job search with confidence! Explore a wide range of Career Tips on ResumeGemini. Learn about common challenges and recommendations to overcome them.
- Craft the perfect resume! Master the Art of Resume Writing with ResumeGemini’s guide. Showcase your unique qualifications and achievements effectively.
- Don’t miss out on holiday savings! Build your dream resume with ResumeGemini’s ATS optimized templates.
Q 16. Explain your process for gathering feedback on your presentations.
Gathering feedback is an integral part of the presentation development process. My approach is multifaceted, employing various methods to gain comprehensive insights. I typically start with a peer review, presenting to colleagues or mentors and soliciting specific feedback on clarity, engagement, and flow. This allows me to receive immediate reactions and address any issues before finalizing the presentation.
Next, I conduct a trial run with a smaller, targeted audience that resembles my intended final audience. This allows me to assess whether the message resonates and identify areas for improvement based on real-time reactions. Finally, I use online surveys or feedback forms to gather broader perspectives after the presentation is delivered. This process helps to identify areas where the presentation could be improved. Analyzing the collected feedback allows for iterative improvements in subsequent presentations.
Q 17. How do you use data visualization to support your research findings?
Data visualization is crucial for conveying research findings effectively. I choose visualization techniques based on the type of data and the message I want to communicate. For example, if I’m showing trends over time, a line graph is ideal. If I’m comparing different categories, I might use a bar chart or a pie chart. For complex relationships between variables, I often utilize scatter plots or heatmaps.
I prioritize clarity and simplicity. Charts and graphs should be easy to understand at a glance, avoiding clutter and unnecessary details. I always ensure that axes are clearly labeled, units are specified, and any relevant statistical information is included. Tools like Tableau, Power BI, or even Excel can be effectively used for creating visually compelling and informative data visualizations. The key is to choose the right tool and ensure the visualization supports the narrative of the research.
Q 18. What is your preferred method for presenting complex data?
Presenting complex data requires a strategic approach to avoid overwhelming the audience. My preferred method is to break down complex information into smaller, more digestible chunks. I might use a combination of visual aids – charts, graphs, and tables – along with a clear and concise narrative to guide the audience through the data. Starting with a high-level overview, followed by a gradual dive into specifics, ensures comprehension.
Analogies and real-world examples can greatly simplify complex concepts. For instance, if explaining a statistical model, I might use a familiar scenario to illustrate its application. Interactive elements, where appropriate, can also enhance audience engagement and understanding, allowing them to explore the data at their own pace. Finally, I always allow time for questions and clarification to address any confusion.
Q 19. How do you ensure your presentations are both informative and engaging?
Balancing informative content with audience engagement requires careful planning and execution. A compelling narrative is key. Instead of simply presenting facts, I weave a story around the data, making it relatable and memorable. I use storytelling techniques to create a connection with the audience, highlighting the importance and relevance of the research. Using humor (where appropriate) and personal anecdotes can further enhance engagement.
Visual aids are indispensable for keeping the audience interested. I incorporate high-quality images, videos, and interactive elements to break up the text-heavy sections and prevent cognitive overload. Varying my tone and pace during the presentation helps to maintain audience attention. Incorporating audience interaction, such as Q&A sessions or polls, allows for a more dynamic and participatory experience.
Q 20. Describe your experience with different presentation formats (e.g., PowerPoint, Keynote).
I have extensive experience with various presentation formats, including PowerPoint, Keynote, and even Google Slides. PowerPoint remains a widely used tool and its familiarity makes it a reliable choice for most presentations. Keynote, with its user-friendly interface and impressive animation capabilities, is excellent for creating visually engaging presentations, particularly for larger audiences or more creative projects. Google Slides offers excellent collaborative features, making it suitable for team-based projects.
My choice of platform depends on the specific context and audience. For instance, a formal academic presentation might benefit from the versatility of PowerPoint, while a more creative, visually driven presentation might be better suited for Keynote. The crucial element is selecting a platform that helps deliver the message effectively and enhances the overall experience for the audience. Ultimately, the content and its delivery remain paramount, irrespective of the software used.
Q 21. How do you cite sources correctly in your research and presentations?
Accurate citation is paramount for maintaining academic integrity. I consistently use a consistent citation style throughout my research and presentations, adhering to guidelines specified by the relevant publication or institution. Common styles include APA, MLA, and Chicago. For example, in APA style, a journal article would be cited within the text as (Author, Year) and fully referenced in a bibliography at the end.
I utilize citation management software such as Zotero or Mendeley to streamline the process, organizing references, generating citations automatically, and ensuring accuracy. This reduces the risk of plagiarism and ensures proper attribution to the original sources. I am meticulous about verifying the accuracy of my citations, and always double-check before submitting any research or delivering a presentation to ensure that all the sources are properly acknowledged.
Q 22. How do you deal with conflicting information during your research?
Conflicting information is a common challenge in research. My approach involves a systematic process of critical evaluation. First, I meticulously examine the source of the information, assessing its credibility, methodology, and potential biases. This involves considering the author’s expertise, the publication venue’s reputation, and any potential conflicts of interest. Second, I look for corroborating evidence from multiple independent sources. If the discrepancy persists, I delve deeper, exploring the underlying reasons for the conflict. This might involve identifying limitations in the methodology of certain studies, considering differing perspectives on the subject, or recognizing that the apparent conflict is actually a nuance requiring a more nuanced understanding. Finally, I clearly document the conflicting information and my rationale for choosing a particular interpretation in my research report. For example, in a study on the effectiveness of a new drug, if two studies showed contrasting results, I would examine the sample sizes, study designs, and statistical analyses used in each before concluding on the most credible evidence.
Q 23. Describe your experience with research ethics.
Research ethics are paramount in my work. I adhere strictly to principles of honesty, integrity, and respect for intellectual property. This includes properly citing all sources to avoid plagiarism, obtaining informed consent from participants in any human subject research, ensuring data confidentiality and anonymity, and accurately representing my findings without exaggeration or fabrication. I’m familiar with relevant guidelines like those from the IRB (Institutional Review Board) and am committed to maintaining the highest ethical standards throughout the research process. In one instance, I had to re-analyze my data because I realized a potential bias in my sampling method that could have compromised the validity of my results. It was challenging but necessary to ensure ethical conduct.
Q 24. What are the key principles of effective communication?
Effective communication hinges on three key principles: clarity, conciseness, and engagement. Clarity means presenting information in a straightforward, easily understandable manner, avoiding jargon and using precise language. Conciseness ensures the message is delivered efficiently, focusing on the most relevant information without unnecessary detail. Engagement means capturing and maintaining the audience’s attention, tailoring the message to their interests and background. This can be achieved through storytelling, visual aids, interactive elements, and adapting the tone and style of the communication. For example, when presenting research findings to a scientific audience, I would utilize technical terminology and detailed data; however, when addressing a general audience, I would simplify the language and focus on the broader implications of the research.
Q 25. How do you adapt your communication style to suit various contexts?
Adapting my communication style is crucial for effective delivery. I consider the audience’s background, expertise level, and expectations when choosing the appropriate tone, language, and format. When presenting to a scientific audience, I use precise terminology and detailed data analysis. When speaking to a lay audience, I simplify the language, focus on the key findings, and use analogies to make complex concepts more accessible. The communication channel also influences my approach – a written report requires a more formal style compared to an oral presentation which benefits from visual aids and interactive elements. For instance, I once had to present complex statistical models to a board of directors – I used clear visuals and focused on the implications for the business, rather than getting lost in the mathematical details.
Q 26. How do you evaluate the success of a research project or presentation?
Evaluating the success of a research project or presentation involves multiple metrics. For research, I assess the quality of the methodology, the robustness of the findings, and their contribution to the field. This includes considering peer review feedback, publication success, and the impact of the research on subsequent work. For presentations, I measure success based on audience engagement, clarity of the message, and achievement of the presentation’s objectives. This involves gathering feedback through surveys, informal discussions, and observing the audience’s response during the presentation. Did the audience understand the key messages? Did they find the presentation engaging and informative? Did the presentation lead to discussions, collaborations, or further actions? A successful presentation isn’t just about delivery, but also about achieving the intended outcome, be it raising awareness, persuading an audience, or securing funding.
Q 27. How do you prioritize competing demands when conducting research and preparing presentations?
Prioritizing competing demands during research and presentation preparation requires a structured approach. I use project management techniques, such as creating detailed timelines and task lists, setting realistic deadlines, and regularly reviewing my progress. This involves breaking down large tasks into smaller, manageable steps. I also employ time management strategies, such as the Pomodoro Technique, to maintain focus and avoid burnout. Furthermore, I prioritize tasks based on urgency and importance, focusing on high-impact activities first. Delegation, where feasible, can free up time for critical tasks. For example, during a particularly busy period, I delegated some literature review tasks to a research assistant, allowing me to focus on data analysis and presentation preparation.
Q 28. Describe a situation where you had to present sensitive or confidential information.
In a previous role, I was tasked with presenting financial projections for a new product launch to the executive team. The projections contained sensitive data about projected revenue and market share, which was confidential and not yet public knowledge. My approach involved ensuring strict adherence to confidentiality protocols. I only shared the information with authorized personnel and used a secure presentation platform. I carefully tailored the presentation to avoid disclosing any sensitive details not relevant to the executive team’s decision-making process. The presentation was successful in securing the necessary approvals and maintaining the confidentiality of the sensitive financial information.
Key Topics to Learn for Research and Presentation Interview
- Research Methodology: Understanding various research approaches (qualitative, quantitative, mixed methods), data collection techniques, and appropriate statistical analysis methods. Practical application involves discussing past research projects and highlighting your methodological choices.
- Data Analysis & Interpretation: Mastering data visualization tools and techniques to effectively communicate complex findings. Practical application includes showcasing your ability to extract meaningful insights from data and present them clearly.
- Presentation Skills: Developing compelling narratives, structuring presentations logically, mastering visual aids, and handling Q&A sessions confidently. Practical application involves practicing delivering presentations and receiving constructive feedback.
- Scientific Communication: Crafting clear, concise, and persuasive written reports and presentations adhering to academic standards. Practical application includes demonstrating the ability to tailor communication style to different audiences (e.g., academic vs. industry).
- Problem-solving in Research: Demonstrating your ability to identify research gaps, formulate research questions, and design effective research strategies to address those questions. Practical application involves discussing past research challenges and the solutions you implemented.
- Literature Review & Synthesis: Critically evaluating existing research, identifying key trends, and synthesizing information to build a strong foundation for your own work. Practical application includes showcasing your ability to analyze and compare different research methodologies and findings.
Next Steps
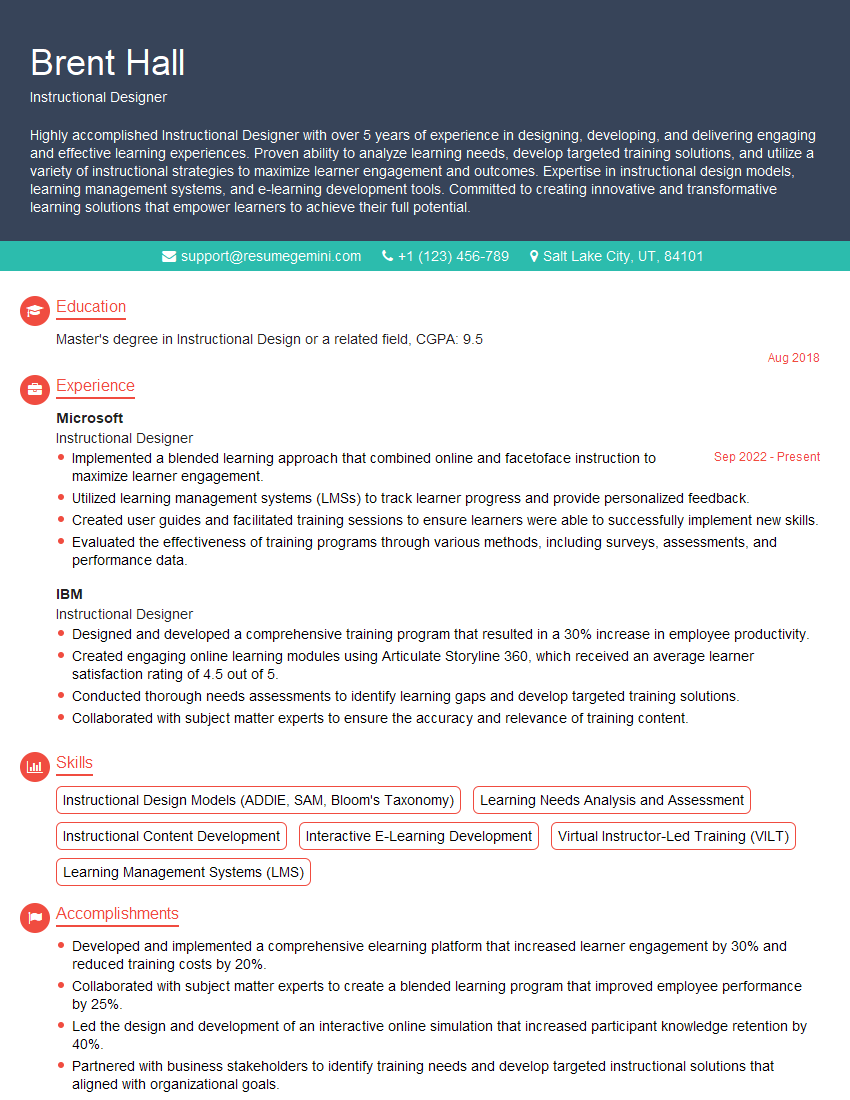
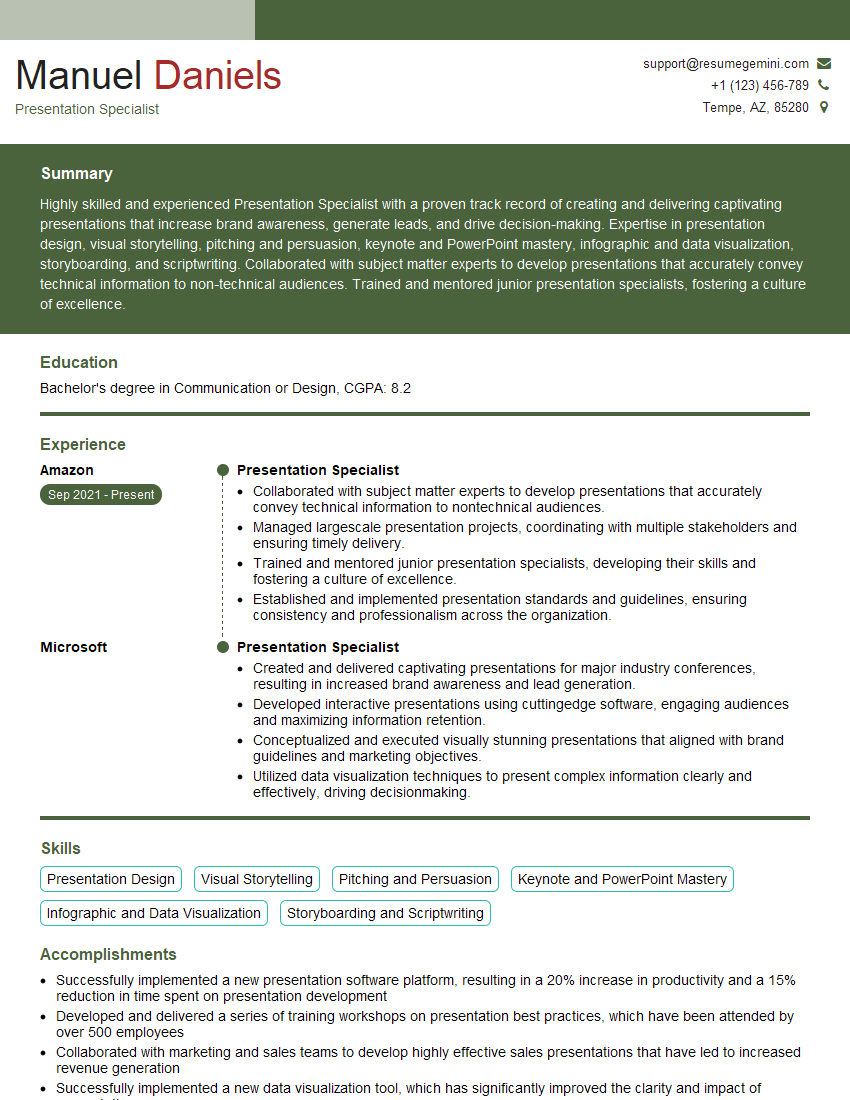
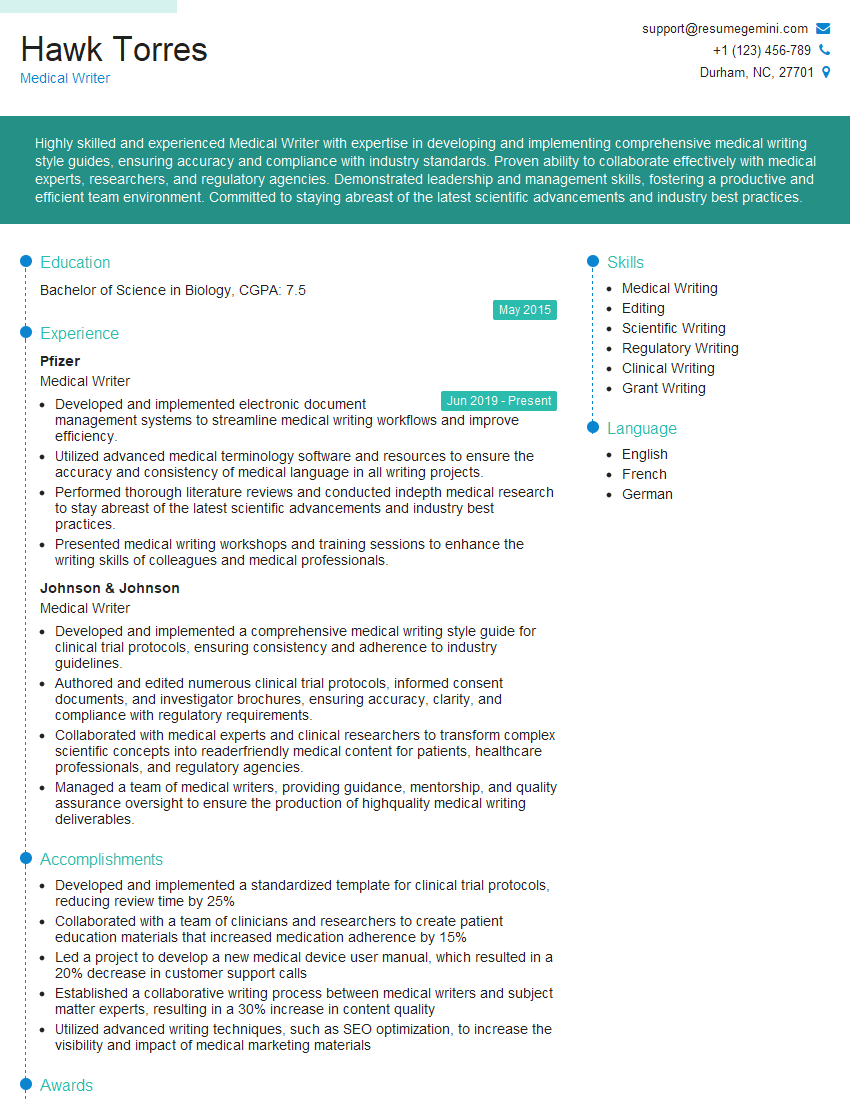
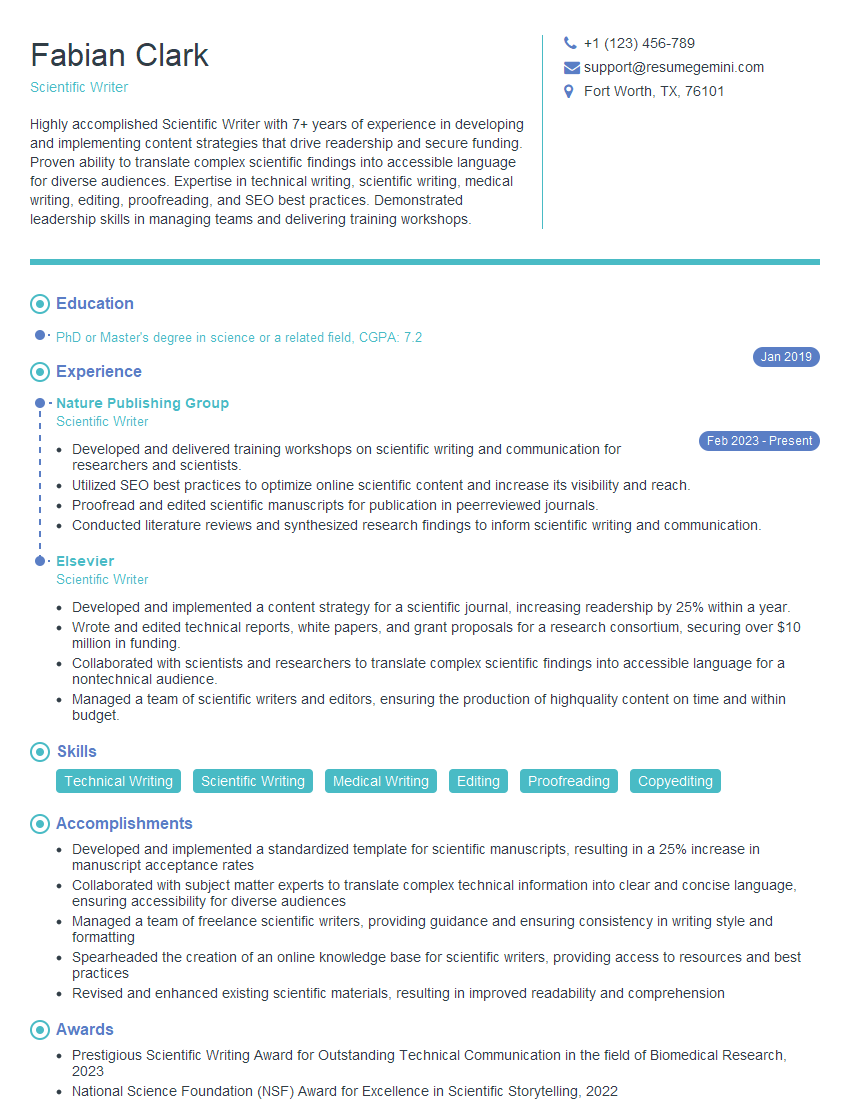
Mastering research and presentation skills is paramount for career advancement in any field demanding analytical thinking and communication prowess. These skills are highly valued by employers and open doors to exciting opportunities for growth and leadership. To significantly improve your job prospects, it’s crucial to create an ATS-friendly resume that highlights your abilities effectively. ResumeGemini is a trusted resource to help you build a professional and impactful resume, ensuring your skills and experience shine through. We provide examples of resumes tailored to Research and Presentation roles to help guide you in crafting your own compelling application. Take advantage of these resources and confidently launch your job search!
Explore more articles
Users Rating of Our Blogs
Share Your Experience
We value your feedback! Please rate our content and share your thoughts (optional).
What Readers Say About Our Blog
This was kind of a unique content I found around the specialized skills. Very helpful questions and good detailed answers.
Very Helpful blog, thank you Interviewgemini team.
