The right preparation can turn an interview into an opportunity to showcase your expertise. This guide to Transient and Abnormal Event Management interview questions is your ultimate resource, providing key insights and tips to help you ace your responses and stand out as a top candidate.
Questions Asked in Transient and Abnormal Event Management Interview
Q 1. Explain the difference between a transient and an abnormal event.
The key difference between transient and abnormal events lies in their duration and impact. A transient event is a temporary disruption in system performance that resolves itself automatically without requiring intervention. Think of it like a hiccup – brief, unexpected, but ultimately self-correcting. An abnormal event, on the other hand, represents a persistent deviation from expected behavior. It requires investigation and remediation as it doesn’t resolve on its own. This is like a persistent cough – it needs attention and might indicate an underlying problem.
Example: A transient event might be a momentary spike in CPU utilization due to a short burst of activity, which quickly returns to normal. An abnormal event would be consistent high CPU utilization, possibly indicating a runaway process or resource leak.
Q 2. Describe your experience with incident management methodologies (e.g., ITIL).
My experience with incident management methodologies, primarily ITIL (Information Technology Infrastructure Library), is extensive. I’ve been involved in all stages of the ITIL lifecycle, from incident identification and logging to problem management and root cause analysis. I’m proficient in using ITIL best practices to prioritize, categorize, and resolve incidents effectively. I have led teams through numerous incident response situations, utilizing ITIL’s framework to ensure efficient communication, documentation, and escalation procedures. In one particular instance, we leveraged ITIL’s problem management processes to resolve recurring network outages caused by a faulty switch, preventing further disruptions and improving system stability.
Q 3. How do you prioritize alerts and incidents in a high-pressure situation?
Prioritizing alerts and incidents under pressure requires a structured approach. I use a combination of factors to determine the urgency: impact (how many users are affected, the criticality of the affected system), urgency (how quickly the issue needs to be resolved to prevent further damage or downtime), and severity (the potential damage caused by the issue). I often employ a prioritization matrix, similar to a risk assessment matrix, to visually represent and communicate these factors to the team. For example, a critical system outage affecting all users would be prioritized over a less significant performance degradation impacting a small subset.
Clear communication is crucial. I ensure the team understands the priorities and their assigned roles. Regular updates and status reports keep everyone informed, maintain transparency and minimize confusion during high-pressure situations.
Q 4. What tools and technologies are you familiar with for monitoring system performance and detecting anomalies?
I’m familiar with a wide range of tools and technologies for system performance monitoring and anomaly detection. This includes:
- Monitoring tools: Nagios, Zabbix, Prometheus, Grafana, Datadog
- Log management tools: Splunk, ELK stack (Elasticsearch, Logstash, Kibana), Graylog
- Anomaly detection platforms: Anodot, Amazon CloudWatch, Azure Monitor
My experience extends to using these tools to set up alerts, visualize performance metrics, and analyze logs to identify patterns and anomalies. For instance, I have used Prometheus and Grafana to create dashboards that visualize key system metrics in real-time, enabling proactive detection of performance bottlenecks. I have also leveraged Splunk to correlate events from diverse sources, leading to quick identification of root causes during complex incidents.
Q 5. Describe your experience with log analysis and event correlation.
My experience with log analysis and event correlation is extensive. I’m skilled at using various log management tools (as mentioned earlier) to extract meaningful insights from vast amounts of log data. I can effectively correlate events across multiple systems to identify patterns and relationships that point to the root cause of problems. A critical part of this is understanding log formats and utilizing regular expressions (regex) to filter and analyze the relevant information.
For example, I once used log correlation to pinpoint the source of intermittent application errors. By analyzing logs from the application server, database, and network devices, I was able to trace the errors to a specific network latency issue impacting communication between the application and database. This led to a quick solution involving network optimization.
Q 6. How do you identify the root cause of a transient event?
Identifying the root cause of a transient event is challenging because, by definition, it resolves quickly. My approach involves a systematic investigation using several techniques:
- Reviewing monitoring data: Examining metrics around the time of the event (CPU usage, memory, network traffic, disk I/O) to identify any correlations or unusual activity.
- Analyzing logs: Scrutinizing logs from the affected systems for errors or warnings that occurred around the same time.
- Reproducing the event (if possible): If the conditions leading to the transient event can be recreated, it allows for more focused debugging.
- Checking system configurations: Examining system settings, such as resource limits or thresholds, to see if they could have contributed to the issue.
Sometimes, despite thorough investigation, the root cause remains elusive. In such cases, it is important to document the event, its impact, and the steps taken during the investigation to aid in future troubleshooting efforts.
Q 7. Explain your approach to troubleshooting network connectivity issues.
My approach to troubleshooting network connectivity issues is methodical and systematic. I follow a layered approach, starting with the most basic checks and progressively moving towards more complex diagnostics.
- Basic checks: Verify cable connections, power cycles, and check for simple configuration errors (e.g., incorrect IP addresses, subnet masks).
- Local host checks: Use ping and traceroute commands to check connectivity to local hosts and routers.
- Network device diagnostics: Use network monitoring tools to check device status, bandwidth utilization, and error rates.
- Remote host checks: Check connectivity to remote servers and services using ping, traceroute, and other network diagnostic tools.
- Protocol analyzers: Employ tools such as Wireshark to analyze network traffic for packet loss, errors, and other anomalies.
I prioritize efficient communication and collaboration with other teams (e.g., network administrators) to ensure a comprehensive investigation. For example, a recent network connectivity issue was effectively resolved by collaborating with the network team to identify a faulty router causing intermittent packet loss. The problem was quickly resolved by replacing the faulty router.
Q 8. How do you handle escalating incidents that require cross-functional collaboration?
Escalating incidents often require a swift and coordinated response across different teams. My approach focuses on clear communication and a well-defined escalation path. First, I ensure a concise and accurate initial incident report, including impact, urgency, and initial troubleshooting steps. Then, I leverage a pre-defined escalation matrix that specifies which team members or managers need to be involved based on the severity and complexity of the issue. For example, a database outage would immediately escalate to the database administrators, network engineers, and application developers, as well as the relevant management team. I utilize communication tools like Slack or Microsoft Teams to create a central communication hub for real-time updates and collaboration. Regular status updates ensure everyone stays informed and avoids information silos. We employ a collaborative problem-solving approach, using tools like online whiteboards to brainstorm solutions and assign responsibilities. Post-incident reviews are crucial; we analyze what worked well and identify areas for improvement in our cross-functional collaboration process.
Q 9. Describe your experience with creating and maintaining runbooks or playbooks for incident response.
Runbooks and playbooks are essential for consistent and effective incident response. I’ve been instrumental in creating and maintaining these for various systems and applications. My approach involves a collaborative effort involving subject matter experts from different teams. We document step-by-step procedures for common incidents, including troubleshooting steps, escalation paths, and communication protocols. For instance, a runbook for a web server outage might include steps for checking server logs, verifying network connectivity, restarting services, and notifying stakeholders. We use a version control system (like Git) to manage and track changes to the runbooks, ensuring everyone has access to the latest version. Regularly, we conduct exercises and drills using the runbooks to validate their effectiveness and identify any gaps or areas requiring updates. This iterative approach ensures our playbooks remain current and relevant, improving our response times and minimizing downtime.
Q 10. How do you ensure the accuracy and completeness of incident reports?
Accuracy and completeness are paramount in incident reports. To ensure this, I utilize a structured reporting template that captures essential details such as the time of the incident, impacted systems, initial symptoms, steps taken, and final resolution. This template acts as a checklist, prompting detailed information gathering. We often use automated tools that capture system logs and metrics, providing objective data to supplement the manual report. Cross-verification of information among team members is another critical aspect; we hold briefings to compare notes and ensure consistent understanding of the incident’s root cause and resolution. Finally, after the incident is resolved, a formal review of the incident report is conducted to validate its accuracy, completeness, and identify any areas of improvement in the reporting process. This rigorous approach minimizes errors and creates a reliable historical record for future analysis and learning.
Q 11. What metrics do you use to measure the effectiveness of your incident response processes?
Measuring the effectiveness of our incident response processes involves tracking several key metrics. These include:
- Mean Time To Detection (MTTD): How long it takes to discover an incident.
- Mean Time To Resolution (MTTR): How long it takes to resolve the incident.
- Mean Time To Recovery (MTTR): How long it takes for services to be restored to their pre-incident state.
- Incident Frequency: The number of incidents occurring over a given period.
- Severity of Incidents: Categorizing incidents by their impact on business operations.
Q 12. Describe your experience with capacity planning and performance tuning to prevent future events.
Proactive capacity planning and performance tuning are crucial to prevent future incidents. I have extensive experience in utilizing various tools and techniques to analyze system performance, identify bottlenecks, and plan for future growth. We use performance monitoring tools to collect data on resource utilization, such as CPU, memory, and disk I/O. This data helps us identify potential issues before they become critical incidents. We employ forecasting models based on historical data and projected growth to estimate future resource requirements. Performance testing, including load testing and stress testing, simulates real-world conditions to identify areas needing improvement. Based on these analyses, we proactively implement changes, such as upgrading hardware, optimizing database queries, or adjusting application configurations to prevent performance degradation and ensure system stability. Regular capacity reviews are essential to keep pace with evolving business needs and prevent future disruptions.
Q 13. How do you utilize automation to improve incident response times?
Automation significantly improves incident response times and efficiency. We employ various automated tools and scripts to streamline various stages of the incident lifecycle. For example, automated monitoring systems alert us to potential issues in real-time, reducing MTTD. Automated scripts can perform routine tasks, such as restarting services or rerouting traffic, significantly reducing MTTR. Orchestration tools allow us to automate complex workflows involving multiple systems and teams. We use Infrastructure as Code (IaC) to automate the provisioning and management of infrastructure, reducing the risk of human error. By automating these routine tasks, we free up valuable time for engineers to focus on more complex issues requiring human expertise. This integrated approach to automation is key to optimizing our incident response processes and improving overall system reliability.
Q 14. What is your experience with Service Level Agreements (SLAs) related to incident resolution?
Service Level Agreements (SLAs) are critical for defining expectations around incident resolution times and service availability. I’ve worked extensively with SLAs, ensuring alignment between business needs and technical capabilities. This involves collaborating with business stakeholders to define realistic and achievable targets for key metrics such as MTTR, availability percentages, and resolution times. We document these agreements clearly and communicate them to all relevant teams. Regular monitoring of SLA performance is essential. We track metrics against the agreed-upon targets and identify any areas of non-compliance. If we experience issues meeting the defined SLAs, we investigate the root causes and implement corrective actions to improve performance. Regular reviews of our SLAs are conducted to ensure they remain relevant and appropriate to our evolving business needs and service offerings.
Q 15. Describe a challenging incident you handled and how you resolved it.
One particularly challenging incident involved a sudden and widespread outage affecting our primary e-commerce platform. Initial alerts pointed to a database issue, but the root cause proved far more elusive. We initially focused on database performance, optimizing queries, and checking replication. However, the outage persisted.
The turning point came when our network team noticed unusual traffic spikes originating from a specific geographic location. Further investigation revealed a distributed denial-of-service (DDoS) attack targeting our load balancer, effectively choking off access to the entire platform. This wasn’t immediately apparent because our monitoring initially masked the impact on the load balancer due to the aggressive nature of the attack.
Our resolution involved several steps: firstly, we engaged our DDoS mitigation provider to deflect the malicious traffic. Secondly, we implemented tighter security measures on our load balancer, including rate limiting and improved IP reputation checks. Thirdly, we reviewed our incident response plan, identifying areas where communication and escalation procedures could be improved to facilitate faster detection of similar attacks. Finally, we conducted a post-incident review to analyze the weaknesses in our system and strengthen preventative measures.
Career Expert Tips:
- Ace those interviews! Prepare effectively by reviewing the Top 50 Most Common Interview Questions on ResumeGemini.
- Navigate your job search with confidence! Explore a wide range of Career Tips on ResumeGemini. Learn about common challenges and recommendations to overcome them.
- Craft the perfect resume! Master the Art of Resume Writing with ResumeGemini’s guide. Showcase your unique qualifications and achievements effectively.
- Don’t miss out on holiday savings! Build your dream resume with ResumeGemini’s ATS optimized templates.
Q 16. How do you communicate effectively with technical and non-technical stakeholders during an incident?
Effective communication during an incident is crucial. My approach centers around tailoring the message to the audience. With technical stakeholders, I use precise terminology, detailed technical reports, and potentially even share relevant code snippets or log excerpts.
For example, discussing memory leaks with a developer requires a deep dive into specific memory allocation patterns, while explaining the same issue to a non-technical executive necessitates a higher-level summary that focuses on impact and resolution timeline – something like, ‘We are experiencing a system slowdown due to a memory leak, and the team is working on a fix. We expect full restoration within the hour.’
Regardless of the audience, I prioritize transparency, frequent updates, and a clear explanation of the next steps. I consistently use clear, concise language and avoid jargon unless it’s necessary and immediately defined. Regular status updates, ideally delivered through multiple channels (e.g., email, chat, conference calls), ensure everyone stays informed.
Q 17. What is your experience with different alerting systems and their configuration?
My experience spans several alerting systems, including PagerDuty, Opsgenie, and Datadog. I’m proficient in configuring these systems to generate alerts based on various thresholds and conditions. This includes setting alert severity levels (critical, warning, informational), defining notification methods (email, SMS, phone calls), and establishing escalation policies based on roles and responsibilities.
For instance, in PagerDuty, I’ve configured alerts for critical system metrics like CPU utilization, disk space, and network latency. I’ve also built custom alert rules using monitoring tools’ APIs, triggering alerts based on specific patterns in log files or application performance metrics. Proper configuration involves balancing sensitivity – preventing alert fatigue – with the need to capture genuine issues promptly. A crucial aspect is regularly reviewing and refining alert rules to minimize false positives and ensure that alerts accurately reflect the system’s health and performance.
Q 18. How familiar are you with different types of monitoring (e.g., synthetic, real user, infrastructure)?
I’m well-versed in various monitoring types, recognizing their strengths and limitations. Synthetic monitoring simulates user interactions to proactively identify issues before impacting real users. Think of it like a robotic user browsing your website and reporting if anything breaks. Real user monitoring (RUM) captures actual user experiences, providing insights into real-world performance. Infrastructure monitoring tracks the health and performance of servers, networks, and databases; it’s the foundation upon which other monitoring types rely.
Using these in conjunction is crucial. For example, synthetic monitoring might detect a slow API response, alerting us before real users experience issues. RUM would then reveal the actual user impact and potential drop-off rate. Simultaneously, infrastructure monitoring might pinpoint the root cause – say, high CPU usage on the server hosting the API – allowing us to address it proactively.
Q 19. How do you handle situations where alerts are false positives?
False positives are a persistent challenge in alert management. My approach is multifaceted. First, I meticulously investigate each false positive to identify the underlying cause. This may involve checking alert thresholds, reviewing the alert’s context, and examining associated log files. Often, it reveals a need for adjustments to the alert configuration or improved data filtering.
Secondly, I leverage runbooks or documented procedures to guide investigations. This ensures consistency and efficiency in handling recurring issues. If a particular alert repeatedly proves false, I may temporarily disable it while refining its criteria. For example, if an alert triggers due to temporary fluctuations in network traffic, I might adjust the threshold or add a time window to filter out short-lived spikes. This approach aims to optimize the balance between preventing alerts for inconsequential events and ensuring timely detection of significant issues.
Q 20. Describe your experience with using dashboards and reporting tools for incident management.
I have extensive experience with various dashboards and reporting tools, including Grafana, Kibana, and Datadog. These tools are essential for visualizing system performance, identifying trends, and generating reports for incident analysis. I utilize dashboards to create visual representations of key performance indicators (KPIs), allowing for quick identification of anomalies.
For instance, a dashboard could display metrics like website traffic, error rates, database response times, and CPU utilization. This enables swift detection of problems. Further, these tools facilitate the creation of comprehensive reports summarizing incidents, their root causes, resolution times, and areas for improvement. These reports are essential for conducting post-incident reviews and identifying opportunities for process enhancements, ultimately improving future incident response.
Q 21. Explain your understanding of different types of system anomalies and their potential impact.
System anomalies can manifest in various forms, each with varying levels of impact. Performance anomalies like slow response times, high error rates, or resource exhaustion (high CPU, memory) can degrade user experience or even lead to outages. Security anomalies, such as unauthorized access attempts or data breaches, pose significant risks to data integrity and confidentiality. Availability anomalies, like unexpected downtime or service interruptions, disrupt business operations and affect revenue.
For instance, a sudden spike in database query latency could indicate a performance bottleneck, potentially causing slowdowns or application crashes (performance anomaly). A suspicious login attempt from an unknown IP address could signal a potential security breach (security anomaly). And a complete server failure would represent a critical availability anomaly. Recognizing these different anomaly types is key to prioritizing incident response and implementing appropriate mitigation strategies. The severity of impact depends on the specific system, its criticality to the business, and the scope and duration of the anomaly.
Q 22. What is your experience with security incident response and threat mitigation?
My experience in security incident response and threat mitigation spans over eight years, encompassing various roles from security analyst to team lead. I’ve managed incidents ranging from minor system outages to large-scale security breaches involving data exfiltration attempts. My approach involves a structured methodology following NIST’s Cybersecurity Framework, focusing on:
- Preparation: Proactive security measures like vulnerability scanning, penetration testing, and security awareness training are crucial. For example, I implemented a robust vulnerability management program that reduced critical vulnerabilities by 70% within six months.
- Detection and Analysis: Utilizing SIEM (Security Information and Event Management) systems and threat intelligence feeds to identify and analyze security events is paramount. I’ve successfully used Splunk to correlate events and identify sophisticated attack patterns, leading to the timely neutralization of a ransomware attack.
- Containment, Eradication, and Recovery: This phase focuses on isolating affected systems, removing malware, restoring data from backups, and strengthening security controls. I’ve led several incident response efforts, including the complete recovery of a critical production database affected by a SQL injection attack.
- Post-Incident Activity: Conducting thorough post-incident reviews to identify root causes, improve security measures, and develop better incident response plans. A recent review resulted in implementing multi-factor authentication across all systems, significantly improving our overall security posture.
Q 23. How do you balance the need for immediate response with thorough root cause analysis?
Balancing immediate response with thorough root cause analysis is a critical skill in transient and abnormal event management. It’s like being a firefighter – you need to put out the immediate fire (immediate response) while simultaneously investigating the cause of the fire to prevent future incidents (root cause analysis). I use a prioritized approach:
- Immediate Actions: First, I focus on mitigating the immediate impact of the event. This might involve isolating affected systems, restoring services, or implementing temporary workarounds. Think of this as the ‘stop the bleeding’ phase.
- Parallel Investigation: While addressing the immediate issue, I initiate a parallel investigation into the root cause. This involves collecting logs, interviewing relevant personnel, and analyzing system configurations.
- Documentation and Communication: Throughout this process, detailed documentation of all actions taken and findings discovered is crucial. Regular communication with stakeholders keeps everyone informed and aligned.
- Prioritization based on Impact: If resources are constrained, I prioritize the investigation and remediation based on the severity and potential impact of the event. For example, a data breach would take precedence over a minor service interruption.
This approach allows for quick resolution of the immediate problem while ensuring a thorough understanding of the underlying cause, preventing similar events in the future.
Q 24. What is your approach to post-incident reviews and improvement plans?
My approach to post-incident reviews and improvement plans is structured and results-oriented. I utilize a framework that emphasizes learning and continuous improvement. This involves:
- Data Gathering: Collecting all relevant data, including logs, incident reports, and interview notes.
- Root Cause Analysis: Identifying the root cause(s) of the incident using techniques like the ‘5 Whys’ or fishbone diagrams. This helps move beyond the symptoms to the core problem.
- Actionable Recommendations: Defining clear, actionable recommendations to prevent similar incidents in the future. This might involve implementing new security controls, updating policies, or improving processes.
- Implementation and Monitoring: Tracking the implementation of recommendations and monitoring their effectiveness over time. This might involve setting key performance indicators (KPIs) to measure the impact of changes.
- Documentation and Communication: Documenting the entire process, including findings, recommendations, and implementation details, and communicating these to relevant stakeholders.
For example, after a recent phishing attack, our post-incident review led to the implementation of enhanced security awareness training, a new phishing simulation program, and tighter access control policies, reducing successful phishing attempts by 85% in the following quarter.
Q 25. How familiar are you with various cloud monitoring and logging services?
I’m highly familiar with various cloud monitoring and logging services, including:
- AWS CloudWatch: Experienced in using CloudWatch for monitoring various AWS services, creating custom dashboards, and setting up alarms for critical events. I’ve used CloudWatch extensively for identifying performance bottlenecks and security breaches in AWS environments.
- Azure Monitor: Proficient in using Azure Monitor to monitor Azure resources, analyze logs, and create alerts. I’ve used Azure Monitor to detect and respond to security threats and performance issues in Azure-based applications.
- Google Cloud Operations Suite (now Google Cloud Monitoring): Experienced in leveraging Google Cloud Monitoring for comprehensive monitoring and logging of Google Cloud Platform (GCP) resources. I’ve used this service to manage the performance and availability of applications running on GCP.
- Datadog & Splunk: Experienced in using these platforms for centralized log management and advanced analytics across multiple cloud environments and on-premises infrastructure. This enables comprehensive threat hunting and incident response capabilities.
My experience spans configuring, integrating, and analyzing data from these services to gain valuable insights into system performance, security events, and user behavior.
Q 26. Describe your experience with using machine learning or AI for anomaly detection.
I have significant experience using machine learning (ML) and artificial intelligence (AI) for anomaly detection. I understand that traditional rule-based systems often struggle to detect novel attacks or subtle anomalies. ML/AI provides a powerful alternative. My experience includes:
- Supervised Learning: Utilizing labeled datasets to train models for detecting known threats. This involves using algorithms like Support Vector Machines (SVMs) or Random Forests to classify events as normal or anomalous.
- Unsupervised Learning: Employing unsupervised learning techniques like clustering or anomaly detection algorithms (like Isolation Forest or One-Class SVM) to identify patterns and deviations from normal behavior in unlabeled data. This is particularly useful for identifying zero-day attacks.
- Deep Learning: Exploring the use of deep learning models, such as Recurrent Neural Networks (RNNs) or Long Short-Term Memory networks (LSTMs), for analyzing time-series data and detecting subtle anomalies that might be missed by simpler methods. This is valuable for detecting slow-moving attacks or gradual performance degradation.
For instance, I implemented an anomaly detection system using Isolation Forest on our network traffic logs, successfully identifying a previously unknown attack vector that was subtly exfiltrating data.
Q 27. What is your experience with incident management software (e.g., ServiceNow, Jira)?
I have extensive experience using various incident management software, including ServiceNow and Jira. My expertise involves:
- Incident Lifecycle Management: I’m proficient in using these tools to manage the entire incident lifecycle, from initial detection to resolution and closure. This includes creating tickets, assigning tasks, tracking progress, and generating reports.
- Workflow Automation: I’ve configured automated workflows and escalation processes to streamline incident response and ensure timely resolution. For example, I automated the notification of relevant teams based on the severity of an incident.
- Reporting and Analytics: I’m skilled in using these tools to generate reports on incident trends, root causes, and resolution times. This information is critical for identifying areas for improvement and measuring the effectiveness of incident response processes.
- Integration with other tools: I’ve integrated these platforms with other security tools like SIEMs and vulnerability scanners to create a holistic view of the security landscape and enhance incident response efficiency.
In a recent project, I migrated our incident management system from a legacy platform to ServiceNow, resulting in a 30% reduction in incident resolution time and improved team collaboration.
Q 28. How do you stay up-to-date with the latest trends and best practices in Transient and Abnormal Event Management?
Staying current in the rapidly evolving field of Transient and Abnormal Event Management is crucial. My approach involves a multi-faceted strategy:
- Industry Conferences and Webinars: Attending relevant conferences and webinars, such as RSA Conference, Black Hat, and SANS Institute events, to learn about the latest threats, technologies, and best practices.
- Professional Certifications: Pursuing relevant certifications, such as CISSP, CISM, or SANS GIAC certifications, to maintain a high level of expertise and credibility.
- Online Resources and Publications: Regularly reading industry publications, blogs, and research papers to stay informed about emerging trends and new techniques. I subscribe to several newsletters and follow key cybersecurity experts on social media.
- Networking and Collaboration: Actively participating in online communities and forums, such as those hosted by SANS, OWASP, and ISC(2), to share knowledge, learn from others, and stay abreast of current challenges.
- Hands-on Experience: Continuously seeking opportunities to apply new technologies and techniques in real-world scenarios to improve my practical skills. I regularly participate in capture-the-flag (CTF) competitions to hone my skills and stay sharp.
This combination of formal and informal learning keeps me informed about the latest developments and allows me to adapt my skills and strategies to meet emerging challenges.
Key Topics to Learn for Transient and Abnormal Event Management Interview
- Event Detection and Classification: Understanding different types of transient and abnormal events, developing strategies for their accurate identification using various monitoring tools and techniques.
- Root Cause Analysis (RCA): Mastering methodologies like the 5 Whys, Fishbone diagrams, and fault tree analysis to effectively pinpoint the underlying causes of events, going beyond surface-level symptoms.
- Incident Response and Mitigation: Developing practical plans for handling events, including escalation procedures, communication strategies, and the implementation of corrective actions to minimize impact.
- Data Analysis and Visualization: Utilizing data analytics to identify trends, patterns, and anomalies; presenting findings clearly through effective data visualization techniques.
- System Monitoring and Alerting: Configuring and interpreting monitoring systems, understanding different alert thresholds, and developing effective strategies to avoid alert fatigue.
- Automation and Orchestration: Exploring how automation tools can streamline event management processes, improving response times and reducing manual intervention.
- Performance Optimization and Tuning: Understanding how to optimize system performance to prevent future occurrences of abnormal events and improve overall system stability.
- Resilience and Recovery Strategies: Designing robust systems capable of withstanding unexpected events; implementing disaster recovery and business continuity plans.
- Security Considerations: Understanding the security implications of transient and abnormal events, and how security best practices can mitigate risks.
- Communication and Collaboration: Effectively communicating event status and updates to stakeholders, collaborating with cross-functional teams during incident response.
Next Steps
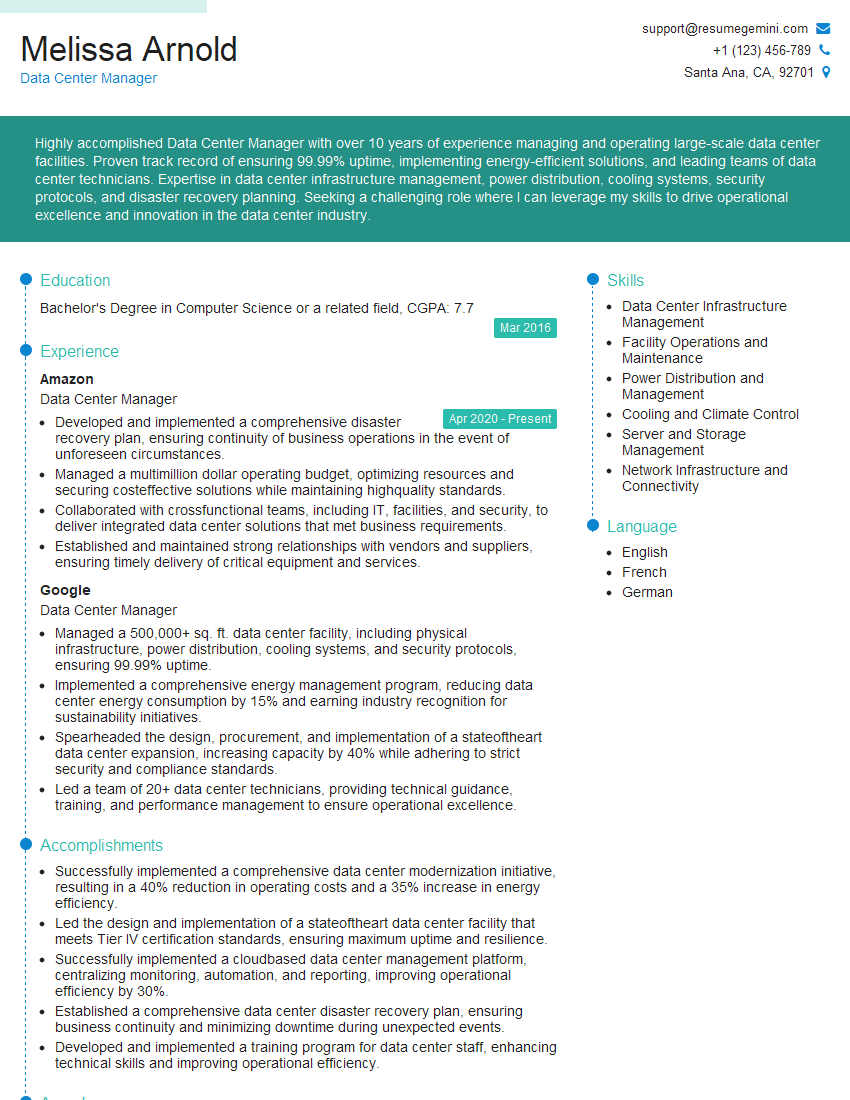
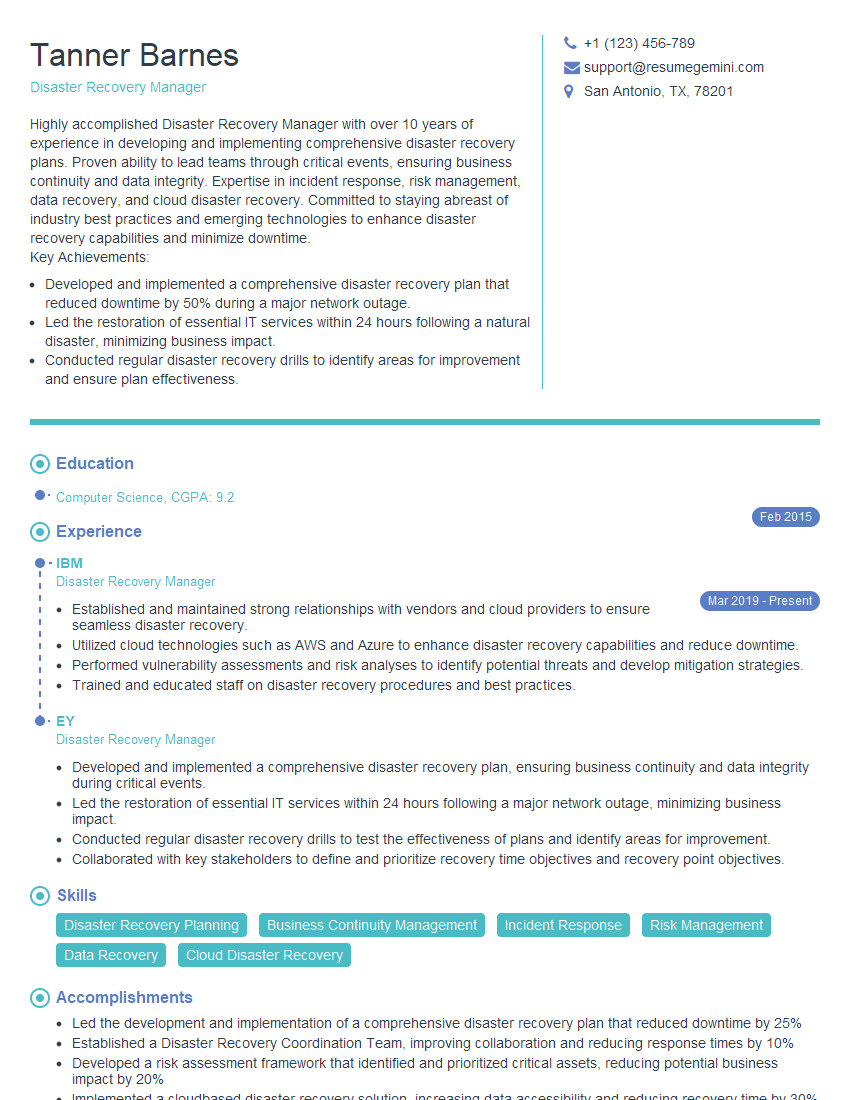
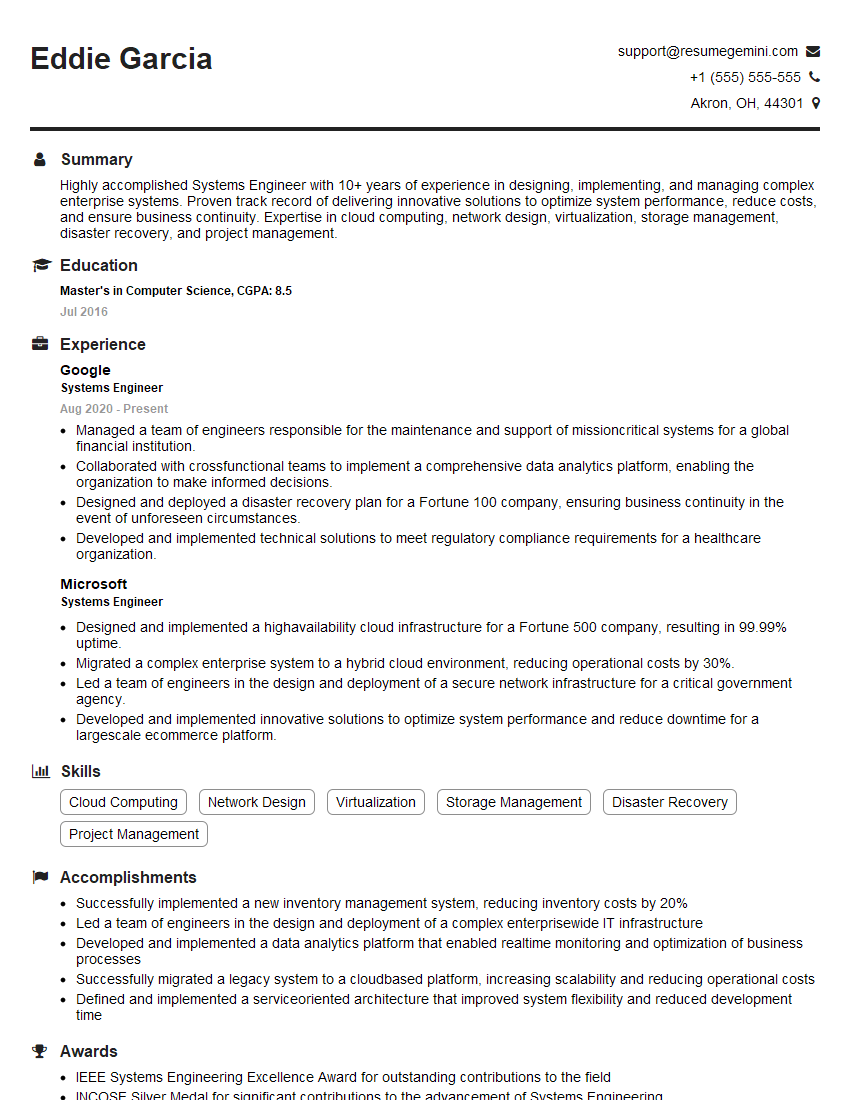
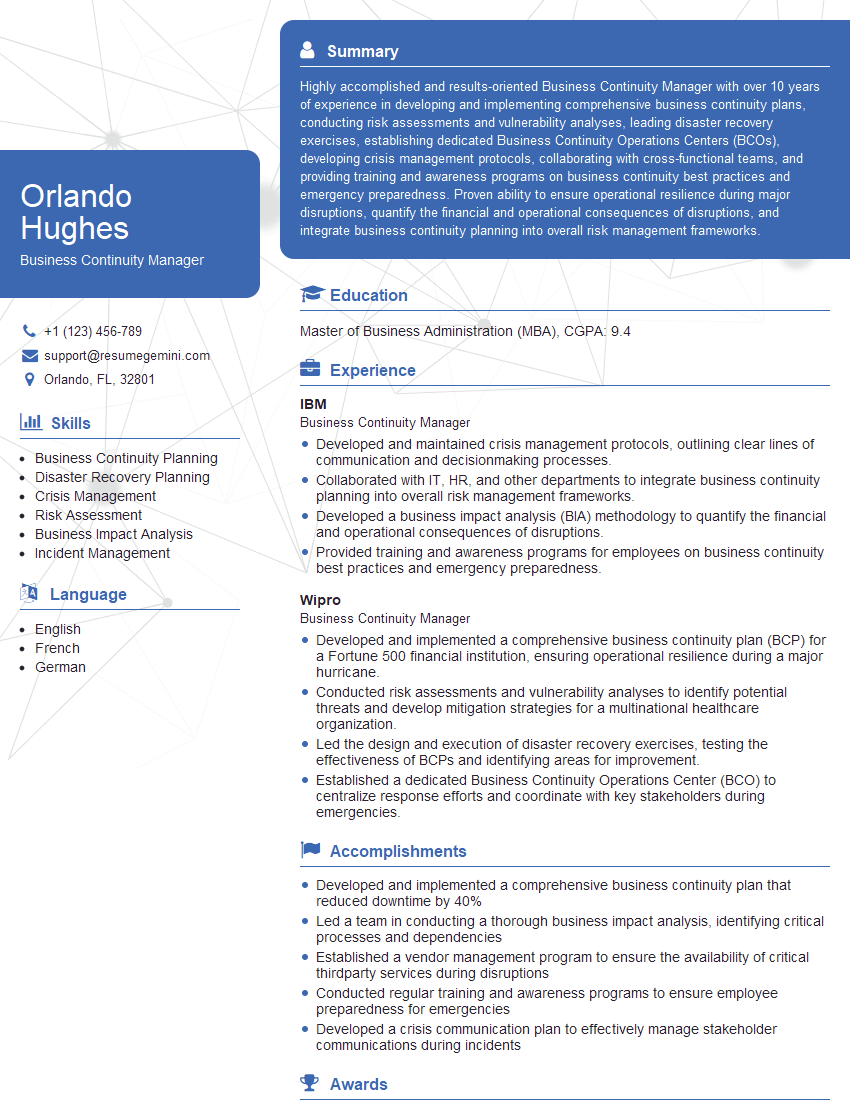
Mastering Transient and Abnormal Event Management is crucial for career advancement in today’s complex IT landscape. Proficiency in this area demonstrates your ability to handle critical situations, solve problems effectively, and maintain system stability – skills highly valued by employers. To significantly boost your job prospects, creating an ATS-friendly resume is essential. ResumeGemini is a trusted resource that can help you build a professional and impactful resume, highlighting your key skills and experience in a way that gets noticed. Examples of resumes tailored to Transient and Abnormal Event Management are available to guide you. Take the next step and build a resume that showcases your expertise!
Explore more articles
Users Rating of Our Blogs
Share Your Experience
We value your feedback! Please rate our content and share your thoughts (optional).
What Readers Say About Our Blog
To the interviewgemini.com Webmaster.
Very helpful and content specific questions to help prepare me for my interview!
Thank you
To the interviewgemini.com Webmaster.
This was kind of a unique content I found around the specialized skills. Very helpful questions and good detailed answers.
Very Helpful blog, thank you Interviewgemini team.
