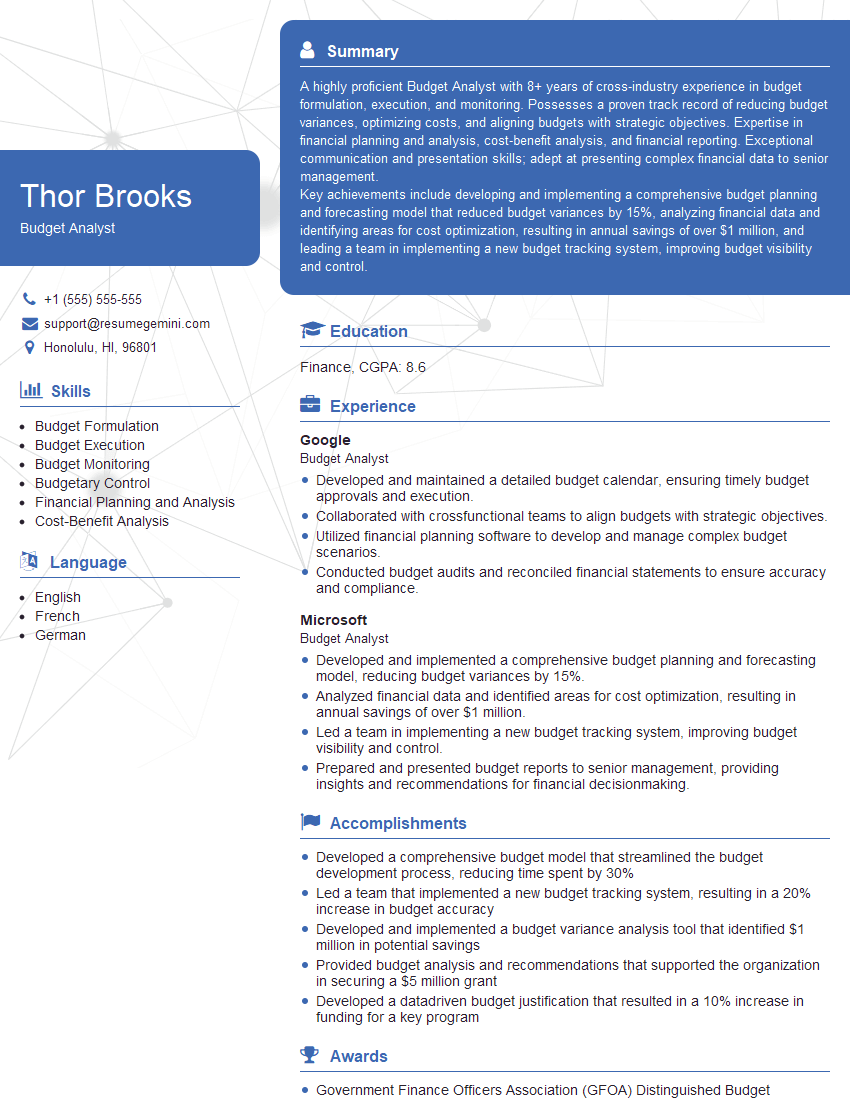
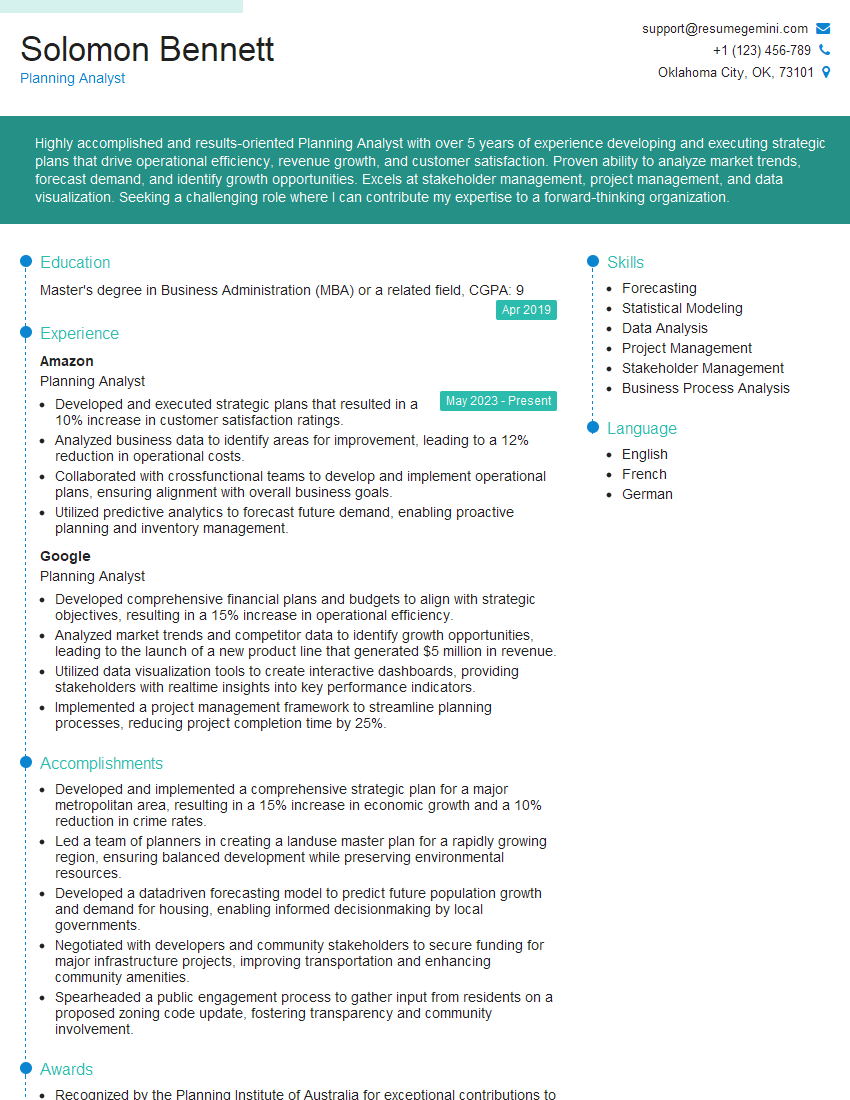
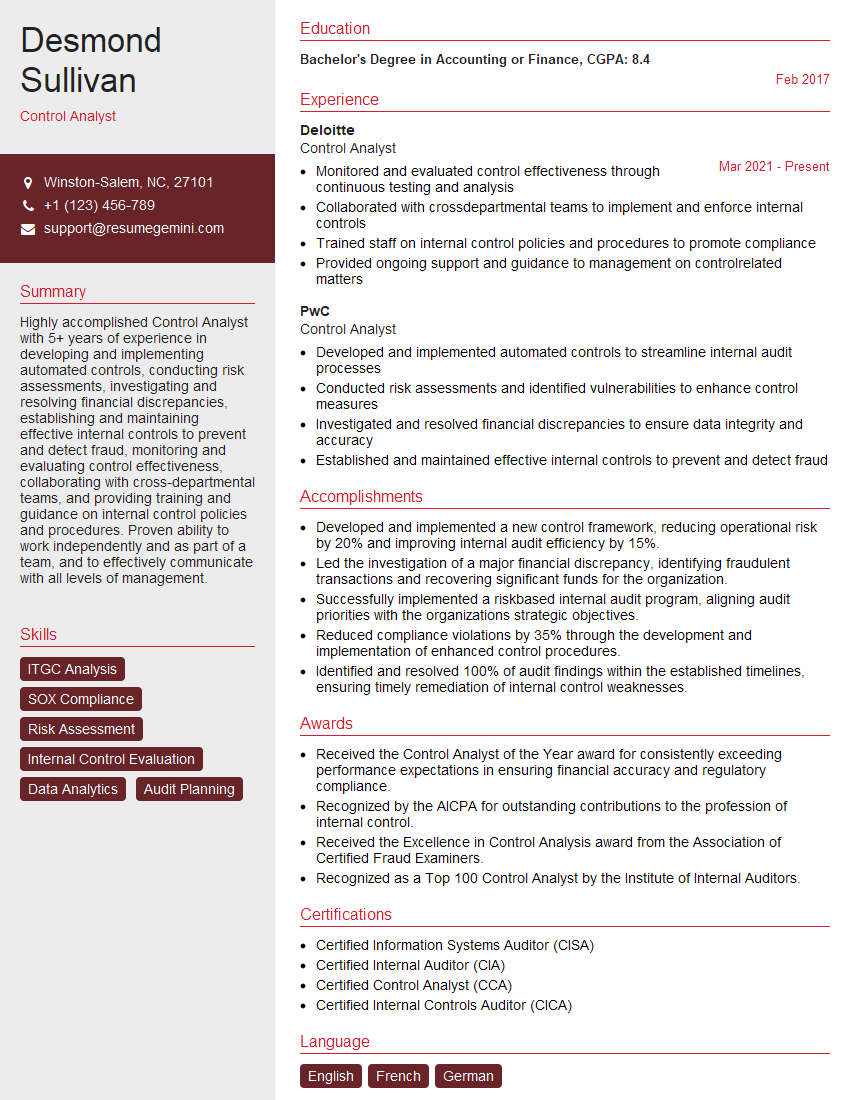
The thought of an interview can be nerve-wracking, but the right preparation can make all the difference. Explore this comprehensive guide to Variance Tracking interview questions and gain the confidence you need to showcase your abilities and secure the role.
Questions Asked in Variance Tracking Interview
Q 1. Explain the concept of variance analysis.
Variance analysis is a crucial management accounting technique used to understand the difference between planned or budgeted figures and actual results. Think of it like comparing a detailed roadmap to your actual journey – variance analysis highlights where you deviated and why. It helps businesses identify areas of strength and weakness, allowing for improved forecasting and strategic decision-making. Essentially, it helps answer the question: ‘Why are we where we are, compared to where we planned to be?’
Q 2. What are the key types of variances?
Key types of variances depend on the context, but some common categories include:
- Sales Variances: The difference between actual and budgeted sales revenue. This can be broken down further into price and volume variances (did we sell less, or at a lower price?).
- Cost Variances: The difference between actual and budgeted costs. These can be further categorized into material, labor, and overhead variances. For example, a material variance could arise from using more expensive raw materials than planned or experiencing material waste.
- Purchase Price Variances: Difference between the actual purchase price of materials and the budgeted purchase price.
- Labor Variances: Difference between actual labor costs and budgeted labor costs, often broken down into rate and efficiency variances.
- Overhead Variances: Differences between actual and budgeted overhead costs.
The specific types of variances analyzed will be determined by the business’s nature and its budgeting process.
Q 3. Describe the process of identifying and investigating variances.
Identifying and investigating variances is a systematic process:
- Calculate the Variance: Determine the difference between the actual and budgeted figures. For example:
Actual Sales - Budgeted Sales = Sales Variance - Analyze the Variance: Determine the magnitude and direction (favorable or unfavorable) of the variance. A favorable variance means better than expected results (e.g., higher sales than budgeted), while an unfavorable variance means worse than expected results (e.g., higher costs than budgeted).
- Investigate the Cause: This is the most critical step. Gather data to understand *why* the variance occurred. This might involve reviewing sales reports, production records, expense reports, market research, or even interviewing employees. For instance, an unfavorable sales variance might be due to increased competitor activity, a change in consumer preferences, or a faulty sales forecasting model.
- Develop Corrective Actions: Based on the investigation, develop and implement strategies to address the root causes of significant variances. This might involve process improvements, cost-cutting measures, or changes in marketing strategy.
- Monitor and Review: Track the effectiveness of the corrective actions. Regular monitoring ensures variances are identified early and addressed promptly.
Q 4. How do you prioritize variances for investigation?
Prioritizing variances for investigation often involves considering:
- Materiality: Focus on variances that are significantly large enough to impact overall profitability or performance. A small variance in a low-impact area might not need immediate attention.
- Trend Analysis: Recurring variances, even if not significantly large in a single period, should be investigated as they indicate potential systemic problems. Consider whether the variance is a one-off or part of a persistent trend.
- Impact on Future Performance: Prioritize variances that are likely to affect future performance and profitability. For example, a consistent unfavorable labor efficiency variance might signal a need to improve training programs.
- Controllability: Prioritize variances that are within the control of management. For example, a variance caused by external economic factors may be less of a concern than a variance caused by internal inefficiencies.
A simple approach could involve ranking variances by a combination of materiality and trend to prioritize the most critical areas for investigation.
Q 5. What are some common causes of sales variances?
Common causes of sales variances include:
- Changes in market conditions: Economic downturns, increased competition, or shifting consumer preferences can significantly impact sales.
- Pricing strategies: Pricing decisions, whether increases or decreases, directly affect sales revenue.
- Marketing and sales efforts: Ineffective marketing campaigns or poor sales performance can lead to lower-than-expected sales.
- Product quality issues: Customer complaints and returns due to product defects negatively impact sales.
- Seasonal factors: Sales fluctuations are common in businesses with seasonal products or services.
- Sales forecasting inaccuracies: Inaccurate sales projections can lead to discrepancies between actual and budgeted sales.
Q 6. What are some common causes of cost variances?
Common causes of cost variances include:
- Changes in material prices: Fluctuations in raw material costs directly affect production costs.
- Labor efficiency issues: Inefficient work processes, employee absenteeism, or lack of training can lead to higher labor costs.
- Production inefficiencies: Waste, defects, or equipment downtime increase production costs.
- Overhead cost changes: Increases in rent, utilities, or other overhead expenses can impact overall costs.
- Unexpected repairs or maintenance: Unexpected equipment breakdowns can cause significant cost overruns.
- Changes in production volume: Higher or lower production volumes than anticipated can affect both fixed and variable costs.
Q 7. How do you present variance analysis findings?
Variance analysis findings should be presented clearly and concisely, using visual aids to enhance understanding. Common presentation methods include:
- Variance reports: Tables summarizing the variances for different accounts, highlighting favorable and unfavorable variances.
- Graphs and charts: Visual representations of variances over time or across different departments can reveal trends and patterns.
- Management dashboards: Key performance indicators (KPIs) including variances, presented on a dashboard for quick monitoring of performance.
- Presentations and meetings: Findings can be communicated through presentations and meetings, allowing for discussion and collaboration on corrective actions.
The presentation should focus on the key findings, their underlying causes, and recommended corrective actions. It is crucial to avoid overwhelming the audience with excessive data. The goal is to provide actionable insights that improve decision-making.
Q 8. What are the key performance indicators (KPIs) you track in variance analysis?
The specific KPIs tracked in variance analysis depend heavily on the business context. However, some common and crucial KPIs include:
- Revenue Variance: The difference between actual revenue and budgeted revenue. This can be broken down further by product, region, or sales channel. For example, we might analyze the variance between planned sales of $1 million and actual sales of $1.2 million, resulting in a $200,000 favorable variance.
- Cost Variance: The difference between actual costs and budgeted costs. This can be categorized as direct costs (materials, labor) and indirect costs (overhead, marketing). For example, if we budgeted $50,000 for marketing and spent $60,000, we have a $10,000 unfavorable variance.
- Profit Variance: The difference between actual profit and budgeted profit. This is a high-level KPI that summarizes the impact of revenue and cost variances. It’s calculated by subtracting total cost variance from revenue variance.
- Production Variance: This measures the difference between actual production output and the planned production target. For a manufacturing company, this could highlight efficiency issues or supply chain problems.
- Sales Variance: This focuses on the difference between actual sales volume and the forecasted sales volume.
Tracking these KPIs allows for a comprehensive understanding of the financial performance and operational efficiency of a business.
Q 9. Explain the difference between favorable and unfavorable variances.
In variance analysis, ‘favorable’ and ‘unfavorable’ are relative terms indicating whether the variance impacts profit positively or negatively.
- Favorable Variance: A favorable variance occurs when actual results exceed budgeted or planned results, leading to increased profits. For example, higher-than-expected sales or lower-than-expected costs would be favorable variances.
- Unfavorable Variance: An unfavorable variance occurs when actual results are below budgeted or planned results, resulting in reduced profits or increased losses. Examples include lower sales than anticipated or higher costs than planned.
It’s crucial to understand that these terms are relative to the specific KPI being analyzed. What might be favorable for one metric could be unfavorable for another. For example, a favorable increase in marketing costs might lead to a favorable increase in sales revenue, ultimately resulting in a positive overall impact.
Q 10. How do you use variance analysis to improve business performance?
Variance analysis is a powerful tool for improving business performance by identifying areas for improvement and optimization.
- Identifying Problem Areas: Large variances highlight areas requiring immediate attention. For example, a significant unfavorable variance in production costs might indicate a problem with raw material sourcing or manufacturing processes.
- Improving Budgeting Accuracy: By analyzing past variances, we can refine future budgets to make them more realistic and accurate, leading to better planning and resource allocation.
- Enhancing Operational Efficiency: Identifying and addressing unfavorable variances can lead to improvements in efficiency and productivity across different departments or processes.
- Data-Driven Decision Making: Variance analysis provides concrete data to support decision-making, replacing gut feelings with fact-based insights.
- Strategic Planning: Long-term trends revealed through consistent variance tracking can inform strategic decisions about product development, market expansion, or investment strategies.
By consistently analyzing variances, businesses can proactively address issues, optimize processes, and ultimately drive better performance.
Q 11. Describe a time you identified a significant variance. What was your approach to solving it?
During my time at [Previous Company Name], we experienced a significant unfavorable variance in our Q4 sales for a flagship product. The initial budget projected sales of 15,000 units, but we only sold 10,000.
My approach involved a systematic investigation using a multi-step process:
- Data Gathering: I collected sales data from different regions, analyzed sales trends, and explored potential factors influencing sales. This involved reviewing market research, competitor analysis, and internal sales reports.
- Root Cause Analysis: My investigation revealed a confluence of issues: a competitor had launched a similar product at a lower price, and we had experienced delays in our marketing campaign. Poor weather in key sales regions also impacted sales volume.
- Solution Development: Based on the analysis, we developed a multi-pronged approach including: price adjustments to better compete, expedited our delayed marketing campaign, and implemented targeted promotional offers in the affected regions.
- Implementation and Monitoring: We implemented the solutions and closely monitored the impact on sales. We tracked key metrics and made adjustments as needed, creating a dynamic approach to addressing the situation.
- Post-Mortem: After the quarter, we performed a thorough post-mortem analysis to understand what we did right, what we could have done better, and how we could improve our forecasting and sales strategies moving forward.
This systematic approach allowed us to not only address the immediate problem but also learn from the experience to improve future performance.
Q 12. How do you handle unexpected variances?
Unexpected variances require a swift and methodical response. My approach involves:
- Immediate Investigation: Quickly gather data to understand the nature and magnitude of the variance. This often involves checking data integrity and cross-referencing information from multiple sources.
- Preliminary Analysis: Identify potential contributing factors. Is it a systemic issue or an isolated event? This might involve speaking with relevant departments to understand potential operational challenges.
- Develop Contingency Plans: Create short-term solutions to mitigate the impact of the variance until a complete understanding is available. This could involve adjusting resource allocation or implementing quick fixes.
- Root Cause Analysis (Thorough): Conduct a comprehensive root cause analysis to identify the underlying reasons for the unexpected variance. This may require more extensive data analysis or meetings with stakeholders.
- Corrective Actions: Develop and implement corrective actions based on the root cause analysis. This might involve changes in processes, systems, or strategies.
- Documentation and Reporting: Document the entire process, including the variance, analysis, corrective actions, and outcomes. Report findings to relevant stakeholders, ensuring transparency and accountability.
Handling unexpected variances effectively requires a proactive, data-driven approach and the ability to adapt quickly to changing circumstances.
Q 13. What software or tools do you use for variance analysis?
Over the course of my career, I’ve utilized various software and tools for variance analysis, adapting to the needs of different organizations. Some of the common tools include:
- Spreadsheet Software (Excel, Google Sheets): These remain essential for basic variance analysis, particularly for smaller datasets or when creating customized reports. I frequently use pivot tables and charts to visualize data and identify trends.
- Business Intelligence (BI) Tools (Tableau, Power BI): These are invaluable for visualizing large datasets and creating interactive dashboards for real-time variance monitoring. They allow for complex data analysis and the creation of custom reports tailored to specific needs.
- Enterprise Resource Planning (ERP) Systems (SAP, Oracle): Many ERP systems have built-in reporting and analytics capabilities that facilitate variance analysis directly from the core business data.
- Specialized Financial Software: Dedicated financial planning and analysis (FP&A) software provides sophisticated tools for budgeting, forecasting, and variance analysis.
The choice of software depends heavily on the organization’s size, complexity, and specific needs. My expertise allows me to effectively use any of these tools to achieve accurate and insightful variance analysis.
Q 14. How do you ensure the accuracy of your variance data?
Ensuring the accuracy of variance data is paramount. My approach is multifaceted:
- Data Validation: Thoroughly validate data from various sources, cross-checking information to identify inconsistencies or errors. This involves regularly reconciling data from different systems and performing data cleansing processes.
- Data Governance: Implement strong data governance processes to ensure data integrity and consistency. This includes establishing clear data definitions, data quality standards, and access control procedures.
- Regular Audits: Conduct regular audits of the variance analysis process to identify any potential biases, errors, or areas for improvement. These audits help to identify system flaws or data entry errors.
- Automation: Automate data collection and processing wherever possible to reduce the risk of manual errors. This improves efficiency and minimizes human error.
- Training and Communication: Provide training to all users involved in data collection, entry, and analysis, ensuring everyone understands the importance of data accuracy and the processes in place to maintain it.
A commitment to data quality is essential for reliable variance analysis and accurate business decision-making. My experience ensures I create a culture where data integrity is a top priority.
Q 15. How do you communicate variance analysis results to non-financial stakeholders?
Communicating variance analysis results to non-financial stakeholders requires translating complex financial data into easily understandable terms. Instead of focusing on raw numbers, prioritize the story behind the variances. Use clear visuals like charts and graphs, and focus on the impact on the business, not just the financial figures. For example, instead of saying ‘labor efficiency variance was $5,000 unfavorable,’ you might say, ‘We spent $5,000 more on labor than planned due to increased production delays. This resulted in X number of units being delivered late to customers.’ Always link variances to concrete business outcomes, highlighting potential opportunities or problems. A simple dashboard showing key performance indicators (KPIs) and their variances, accompanied by a brief explanation of the underlying causes, is a powerful communication tool.
Consider using analogies. For example, you can compare the budget to a recipe and the actual results to the final dish. A large variance might be analogous to using too much or too little of a key ingredient, impacting the final product’s quality or cost. This helps visualize the impact of variances in a relatable way.
Career Expert Tips:
- Ace those interviews! Prepare effectively by reviewing the Top 50 Most Common Interview Questions on ResumeGemini.
- Navigate your job search with confidence! Explore a wide range of Career Tips on ResumeGemini. Learn about common challenges and recommendations to overcome them.
- Craft the perfect resume! Master the Art of Resume Writing with ResumeGemini’s guide. Showcase your unique qualifications and achievements effectively.
- Don’t miss out on holiday savings! Build your dream resume with ResumeGemini’s ATS optimized templates.
Q 16. What are some limitations of variance analysis?
While variance analysis is a valuable tool, it has limitations. One key limitation is that it only highlights differences between planned and actual results; it doesn’t necessarily explain why those differences occurred. A significant variance might be due to unpredictable external factors beyond anyone’s control, such as a sudden market downturn or natural disaster. The analysis might reveal a problem, but not necessarily the solution.
Another limitation is the potential for inaccurate data. If the initial budget is unrealistic or the actual data collection is flawed, the variance analysis will be unreliable. Furthermore, focusing solely on variances can lead to a reactive approach rather than a proactive one. While addressing existing variances is crucial, proactively identifying potential risks and opportunities is equally important. Finally, variance analysis typically focuses on historical data, providing insights into past performance, but not necessarily predictive power for the future.
Q 17. How do you integrate variance analysis into the budgeting process?
Integrating variance analysis into the budgeting process is crucial for effective financial management. It should be a continuous process, not a one-time activity. During the budgeting process, it’s helpful to involve individuals from various departments to build a more realistic and attainable budget. Once the budget is set, regular monitoring and variance analysis become critical. This involves comparing actual results against the budget on a regular basis, perhaps monthly or quarterly.
When significant variances are detected, a thorough investigation should be launched to understand the root causes. This investigation informs corrective actions and adjustments to future budgets. For example, consistently unfavorable material price variances might lead to exploring alternative suppliers or renegotiating contracts. The insights gained from variance analysis should be incorporated into the next budget cycle, leading to improved planning and forecasting. This iterative process helps refine the budgeting process over time, making it more accurate and effective.
Q 18. Explain the difference between planned and actual values.
Planned values represent the budgeted or forecasted amounts for various aspects of a business, such as sales revenue, expenses, or production volume. These values are established during the budgeting process and serve as the benchmark against which actual performance is measured. They are based on expectations and predictions at the time the budget is prepared.
Actual values, on the other hand, represent the real outcomes achieved during a specific period. They reflect the actual sales revenue generated, expenses incurred, and units produced. The difference between planned and actual values is what constitutes the variance, which is then analyzed to identify areas of strength and weakness.
Example: A company plans to sell 10,000 units at $50 each (planned value: $500,000). However, they actually sell 12,000 units at $48 each (actual value: $576,000). There’s a favorable sales volume variance and an unfavorable sales price variance.
Q 19. How do you calculate a sales price variance?
The sales price variance measures the difference between the actual revenue earned and the revenue that would have been earned if the products had been sold at the planned price. It’s calculated as follows:
Sales Price Variance = (Actual Selling Price - Planned Selling Price) * Actual Quantity Sold
Example: A company planned to sell a product for $100 per unit but actually sold it for $95 per unit. They sold 1,000 units. The sales price variance is: ($95 - $100) * 1000 = -$5000. This indicates an unfavorable variance of $5,000 because the actual selling price was lower than the planned price.
Q 20. How do you calculate a material price variance?
The material price variance measures the difference between the actual cost of materials purchased and the cost that would have been incurred if materials had been purchased at the planned price. The formula is:
Material Price Variance = (Actual Price - Planned Price) * Actual Quantity Purchased
Example: A company planned to purchase raw materials at $5 per unit but actually purchased them at $6 per unit. They bought 500 units. The material price variance is: ($6 - $5) * 500 = $500. This shows an unfavorable variance of $500 because the actual price was higher than the planned price.
Q 21. How do you calculate a labor efficiency variance?
The labor efficiency variance measures the difference between the actual labor hours used and the standard labor hours allowed for the actual output, multiplied by the standard labor rate. It highlights whether labor was used efficiently. The formula is:
Labor Efficiency Variance = (Actual Labor Hours - Standard Labor Hours) * Standard Labor Rate
Example: A company planned that producing 1000 units requires 2000 labor hours at a rate of $20 per hour (standard labor hours). However, they actually used 2200 labor hours to produce 1000 units. The labor efficiency variance is: (2200 - 2000) * $20 = $4000. This is an unfavorable variance of $4000, indicating that more labor hours were used than planned for the actual output.
Q 22. How do you use variance analysis to support decision-making?
Variance analysis is a crucial tool for making informed business decisions. It helps identify the difference between planned and actual results, allowing us to understand why those differences exist. This understanding is key to improving future performance and making data-driven choices. For example, if our sales are below budget, variance analysis helps pinpoint whether the problem is due to lower-than-expected sales volume, pricing issues, or changes in market demand. We can then address the specific root cause, rather than reacting blindly.
I use variance analysis to support decision-making in several ways:
- Identifying Problem Areas: By comparing planned versus actual figures (e.g., budget vs. actual spending), variance analysis highlights areas significantly deviating from expectations. This focuses our attention on the most critical issues.
- Prioritizing Resources: Understanding the magnitude and nature of variances allows for the efficient allocation of resources. For instance, if a significant cost overrun is identified in a particular project, management can re-allocate funds or resources to mitigate further losses.
- Improving Forecasting Accuracy: By analyzing the reasons behind past variances, we can refine our forecasting models. This ensures future projections are more realistic and reduce the likelihood of significant deviations.
- Performance Evaluation: Variance analysis provides objective data for evaluating the performance of individuals, teams, and departments. It helps identify areas of strength and weakness, guiding performance improvement initiatives.
In essence, variance analysis provides a structured approach to interpreting data, transforming raw numbers into actionable insights that directly impact decision-making.
Q 23. How do you incorporate variance analysis into forecasting?
Incorporating variance analysis into forecasting is vital for enhancing predictive accuracy. It’s not simply about producing a forecast; it’s about understanding the potential sources of error and adjusting future predictions accordingly. Think of it like navigating with a map – the initial map (forecast) might be accurate, but accounting for deviations (variances) keeps you on the right track.
Here’s how I integrate variance analysis into forecasting:
- Historical Data Analysis: I begin by thoroughly analyzing historical data, identifying recurring patterns and potential sources of variance. For example, if sales consistently dip during certain months, I incorporate this historical trend into my future forecasts.
- Developing a Baseline Forecast: I create an initial forecast using appropriate forecasting techniques (e.g., time series analysis, regression analysis). This acts as a benchmark for comparison.
- Identifying and Quantifying Variances: I then compare the baseline forecast with actual results from previous periods. This helps quantify the magnitude and direction of any deviations.
- Refining the Forecasting Model: Based on the identified variances, I adjust my forecasting model. This may involve incorporating new variables, modifying existing parameters, or choosing a more appropriate forecasting method. For example, if unexpected external factors significantly impacted past results, I’d incorporate those factors into future forecasts.
- Scenario Planning: I often develop multiple scenarios based on different assumptions about future variances. This allows for a more comprehensive understanding of potential outcomes and provides flexibility for decision-making.
By continuously monitoring variances and iteratively refining the forecasting model, we create more robust and reliable forecasts, minimizing the impact of unexpected events.
Q 24. What is your experience with different variance analysis methods?
My experience encompasses several variance analysis methods, each suited to different situations and data types. Choosing the right method is crucial for accurate and meaningful results.
- Simple Variance Analysis: This basic method compares the difference between the budgeted and actual values. It’s straightforward but lacks detailed insight into the causes of variance.
- Percentage Variance Analysis: This method expresses the variance as a percentage of the budgeted value. This provides a relative measure of the significance of the variance.
- Cost Variance Analysis: This method focuses specifically on cost variances, analyzing factors contributing to overspending or underspending, like material costs, labor costs, and overhead.
- Sales Variance Analysis: This analyzes differences between planned and actual sales revenue, investigating factors such as price variance, sales volume variance, and sales mix variance.
- Analysis of Variance (ANOVA): ANOVA is a statistical method used to analyze the variance between groups. I’ve used ANOVA in situations where we needed to understand whether observed differences between groups are statistically significant or just random fluctuations.
The choice of method depends heavily on the specific context. For example, cost variance analysis is most helpful when analyzing project budgets, while sales variance analysis is better suited for sales performance evaluation. I am comfortable using and interpreting the results from each method to provide insightful conclusions.
Q 25. Describe your experience working with large datasets for variance analysis.
Working with large datasets for variance analysis requires efficient data management and analytical tools. Simply using spreadsheets becomes impractical beyond a certain dataset size. I have extensive experience using various database systems and programming languages to handle such large datasets.
My approach involves:
- Data Cleaning and Preprocessing: This is a crucial first step. Large datasets are often messy and contain errors or inconsistencies. I use scripting languages like Python with libraries such as Pandas to clean, transform, and prepare the data for analysis.
- Database Management Systems (DBMS): I leverage DBMS like SQL Server or MySQL to store and manage large datasets efficiently. This allows for faster querying and data retrieval compared to spreadsheet software.
- Data Visualization Tools: Tools such as Tableau or Power BI are crucial for visualizing trends and patterns within large datasets. Effectively visualizing variances helps in communication and interpretation.
- Statistical Software Packages: Software like R or SAS provides powerful statistical methods for analyzing large datasets and performing advanced variance analysis techniques.
For instance, in a recent project, I analyzed sales data spanning several years from multiple regions. Using a combination of Python, SQL, and Tableau, I was able to identify key regional performance indicators, pinpoint significant variances, and present the findings in an easily digestible manner for senior management. Efficient data handling is paramount for accurate and timely variance analysis in these situations.
Q 26. How do you handle conflicting data sources during variance analysis?
Conflicting data sources are a common challenge in variance analysis. It requires a careful and systematic approach to identify the source of the conflict and determine the most reliable data. My approach involves:
- Data Source Validation: I begin by validating the credibility and accuracy of each data source. This involves reviewing data collection methods, data quality checks, and identifying any potential biases.
- Data Reconciliation: If discrepancies are found, I attempt to reconcile the conflicting data by carefully examining the differences and investigating the root cause. This might involve contacting different departments or teams to understand the data collection procedures.
- Data Prioritization: Sometimes, one data source is demonstrably more reliable than another (e.g., data directly from the accounting system vs. estimates from a departmental report). I prioritize the most reliable data source and clearly document the rationale for the decision.
- Data Triangulation: When possible, I try to use multiple independent data sources to verify the accuracy of the data. This helps reduce the risk of relying on a single potentially unreliable source.
- Sensitivity Analysis: If reconciling the data is impossible, I perform a sensitivity analysis to assess how different data sources impact the overall variance analysis results. This allows for a range of possible outcomes, reflecting the uncertainty associated with conflicting data.
Documenting the data reconciliation process is crucial for transparency and auditability. In situations with significant data conflicts, I would escalate the issue to the appropriate stakeholders, clearly outlining the problem and the proposed solutions.
Q 27. How do you ensure the timely completion of variance analysis reports?
Timely completion of variance analysis reports is critical for effective decision-making. Procrastination can lead to outdated information and missed opportunities. I ensure timely completion through careful planning and efficient execution:
- Clear Reporting Schedule: I establish a clear reporting schedule in alignment with business needs and deadlines. This provides a framework for managing the process.
- Automated Processes: I leverage automated data extraction, transformation, and loading (ETL) processes to minimize manual effort and reduce the risk of human error. This allows for faster data processing.
- Efficient Data Analysis Techniques: I select appropriate and efficient data analysis techniques to streamline the process. Using appropriate statistical methods and software greatly accelerates the analysis phase.
- Prioritization of Tasks: I prioritize the analysis of the most critical variances first, focusing on the most impactful areas of the business.
- Collaboration and Communication: Effective communication and collaboration with stakeholders are key. This ensures alignment on reporting requirements and deadlines.
By proactively managing the reporting process, leveraging automation, and prioritizing tasks, I consistently deliver timely and accurate variance analysis reports, enabling data-driven decisions to be made promptly.
Key Topics to Learn for Variance Tracking Interview
- Understanding Variance: Defining and categorizing variances (e.g., favorable vs. unfavorable, planning vs. actual). Explore the different types of variances encountered in various industries.
- Variance Analysis Techniques: Mastering methods for investigating and interpreting variances, including root cause analysis and trend identification. Consider both quantitative and qualitative approaches.
- Data Collection and Analysis: Understanding data sources, methods for data cleaning and preparation, and proficiency in using relevant software (e.g., Excel, data visualization tools) for accurate variance analysis.
- Reporting and Presentation: Effectively communicating variance findings to stakeholders through clear, concise reports and visualizations. Practice presenting complex data in a readily understandable manner.
- Practical Applications: Relate variance tracking to real-world scenarios such as budgeting, forecasting, performance evaluation, and process improvement. Consider examples from different sectors (e.g., finance, manufacturing, project management).
- Problem-Solving and Decision-Making: Demonstrate your ability to use variance information to identify problems, propose solutions, and support data-driven decision-making. Focus on your analytical and critical thinking skills.
- Advanced Concepts (for Senior Roles): Explore topics like statistical process control (SPC), forecasting models, and variance reduction strategies. These are relevant for more experienced roles requiring advanced analytical skills.
Next Steps
Mastering variance tracking is crucial for career advancement in finance, accounting, project management, and many other fields. It demonstrates your ability to analyze data, identify trends, and contribute to informed decision-making – skills highly valued by employers. To enhance your job prospects, focus on creating a compelling, ATS-friendly resume that showcases your skills and experience effectively. ResumeGemini is a trusted resource for building professional resumes, and we provide examples of resumes tailored to Variance Tracking to help you get started. Invest time in crafting a strong resume to highlight your expertise and secure your desired position.
Explore more articles
Users Rating of Our Blogs
Share Your Experience
We value your feedback! Please rate our content and share your thoughts (optional).
What Readers Say About Our Blog
This was kind of a unique content I found around the specialized skills. Very helpful questions and good detailed answers.
Very Helpful blog, thank you Interviewgemini team.
