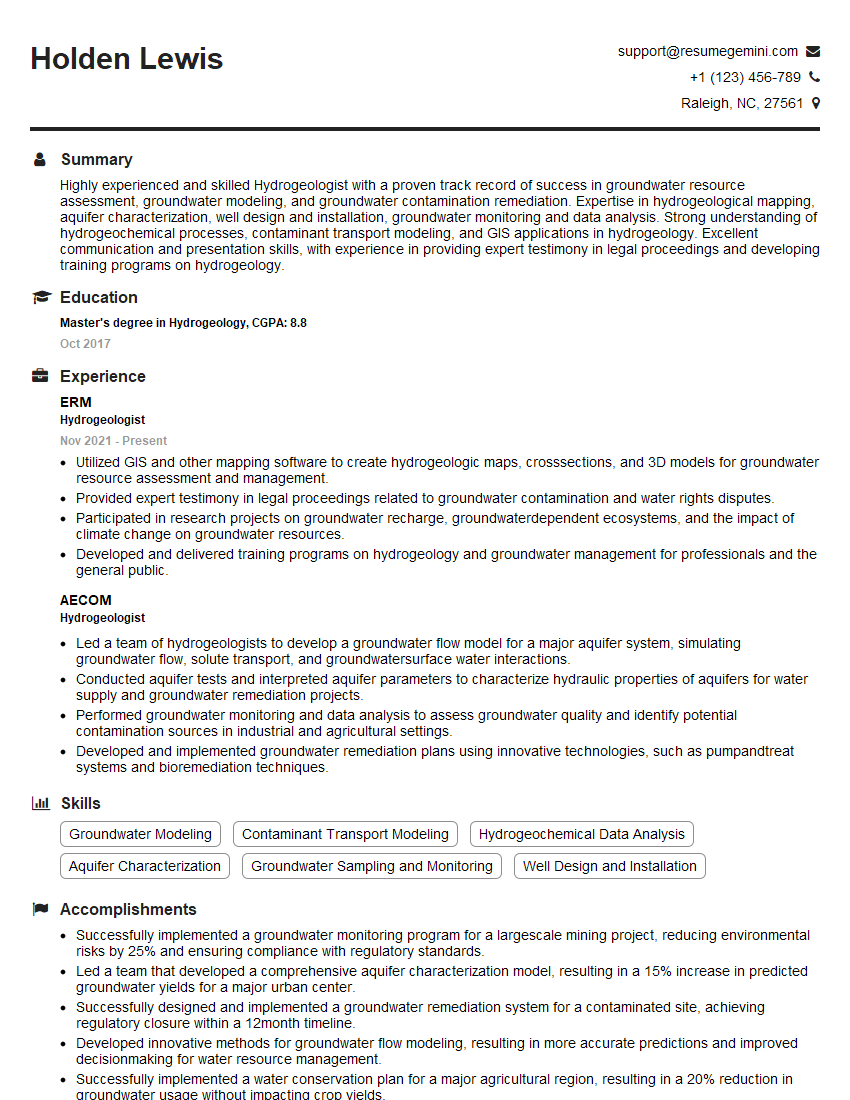
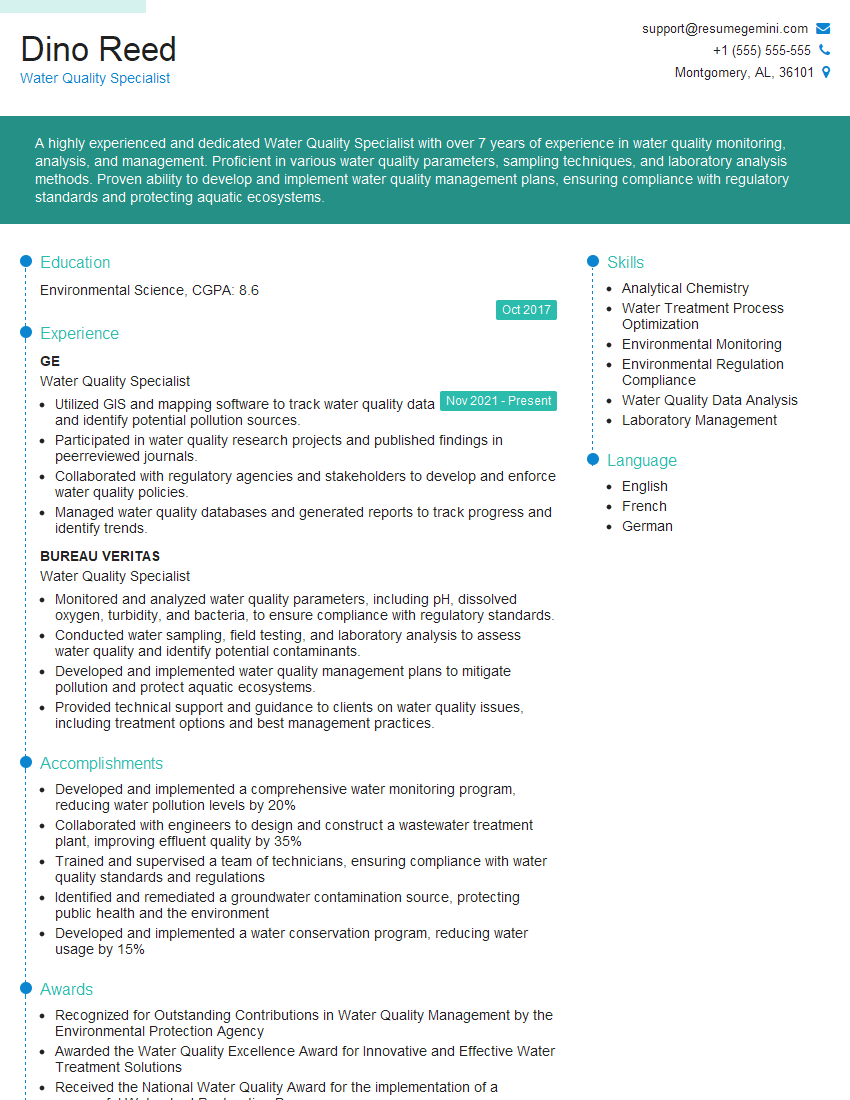
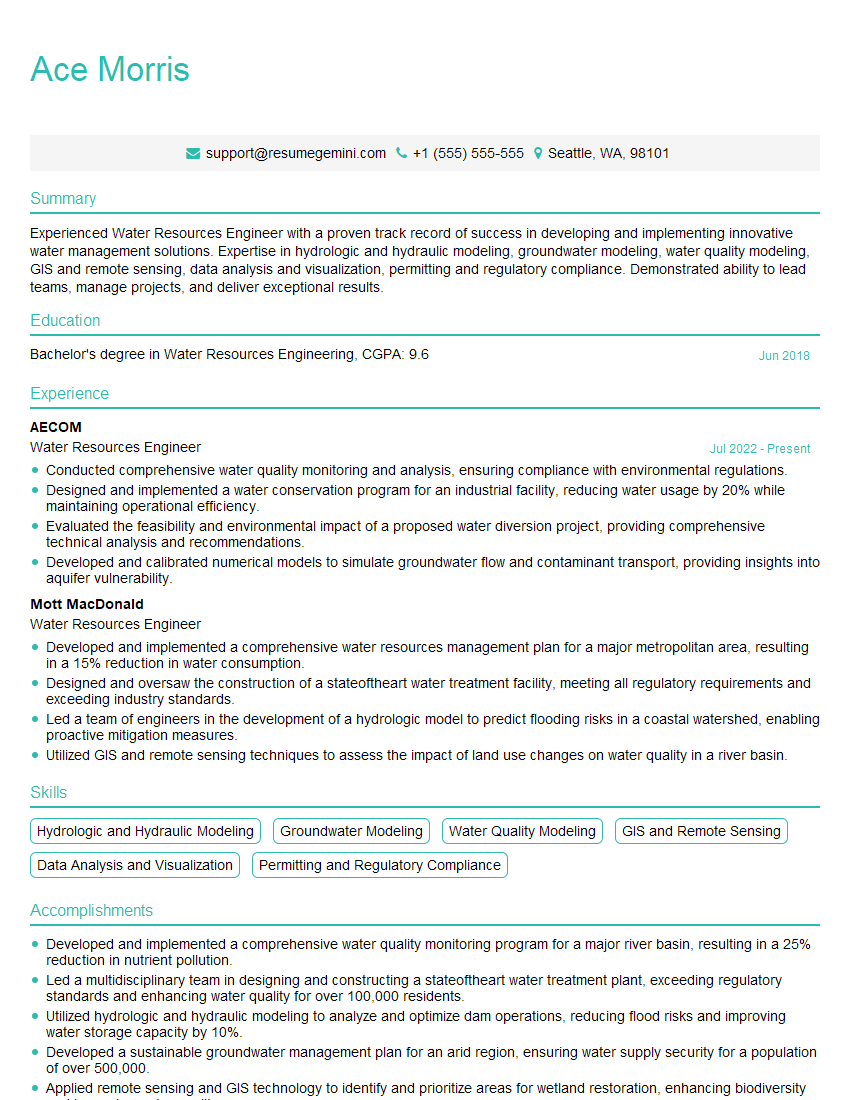
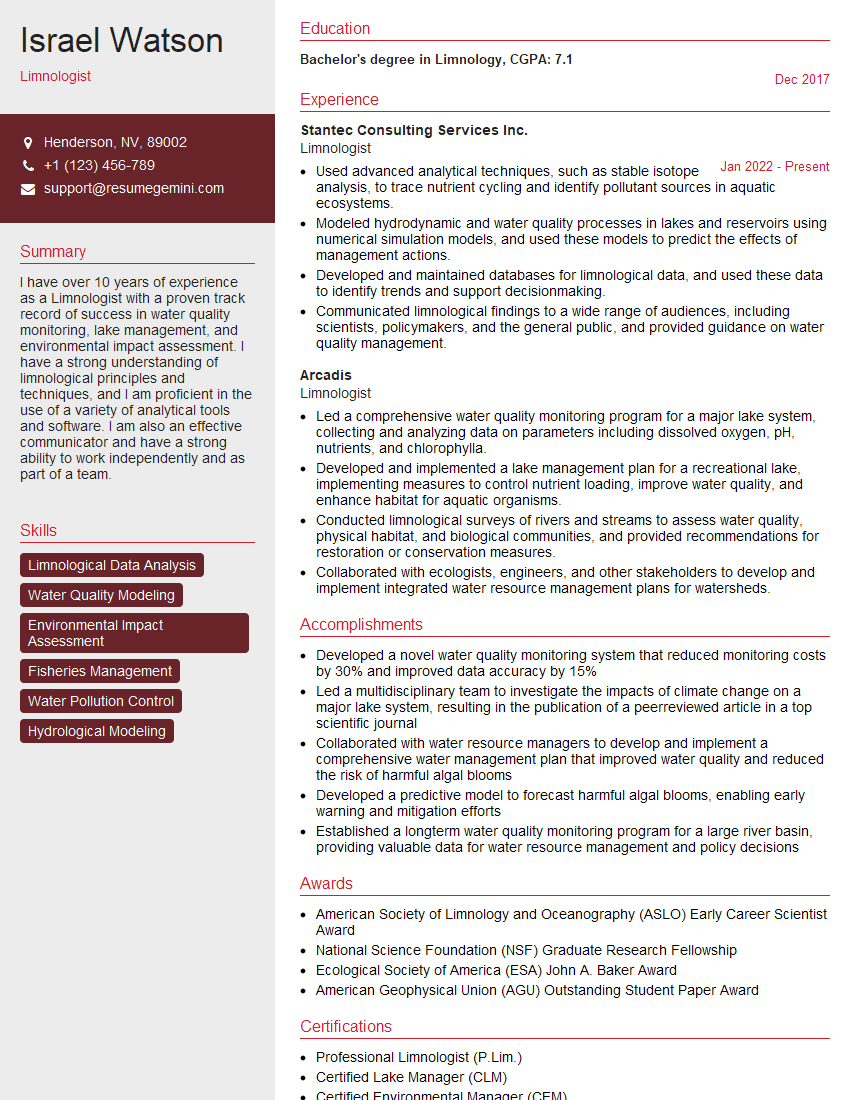
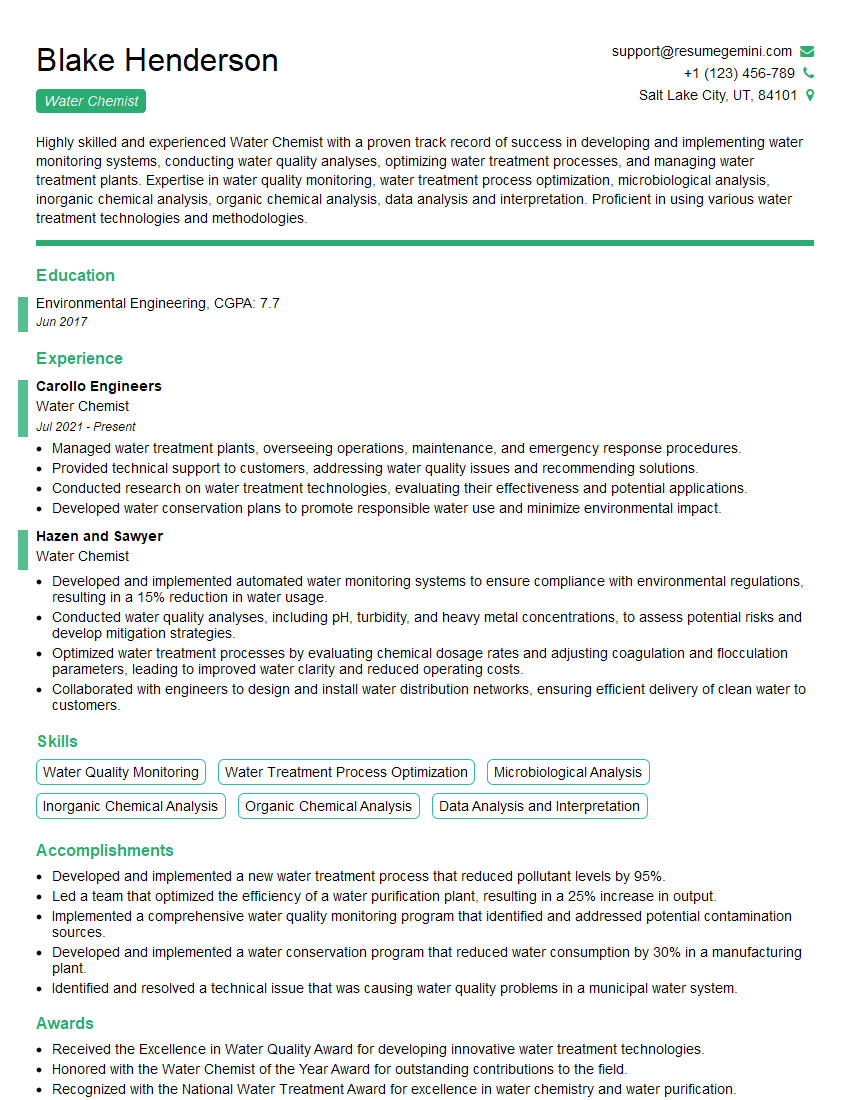
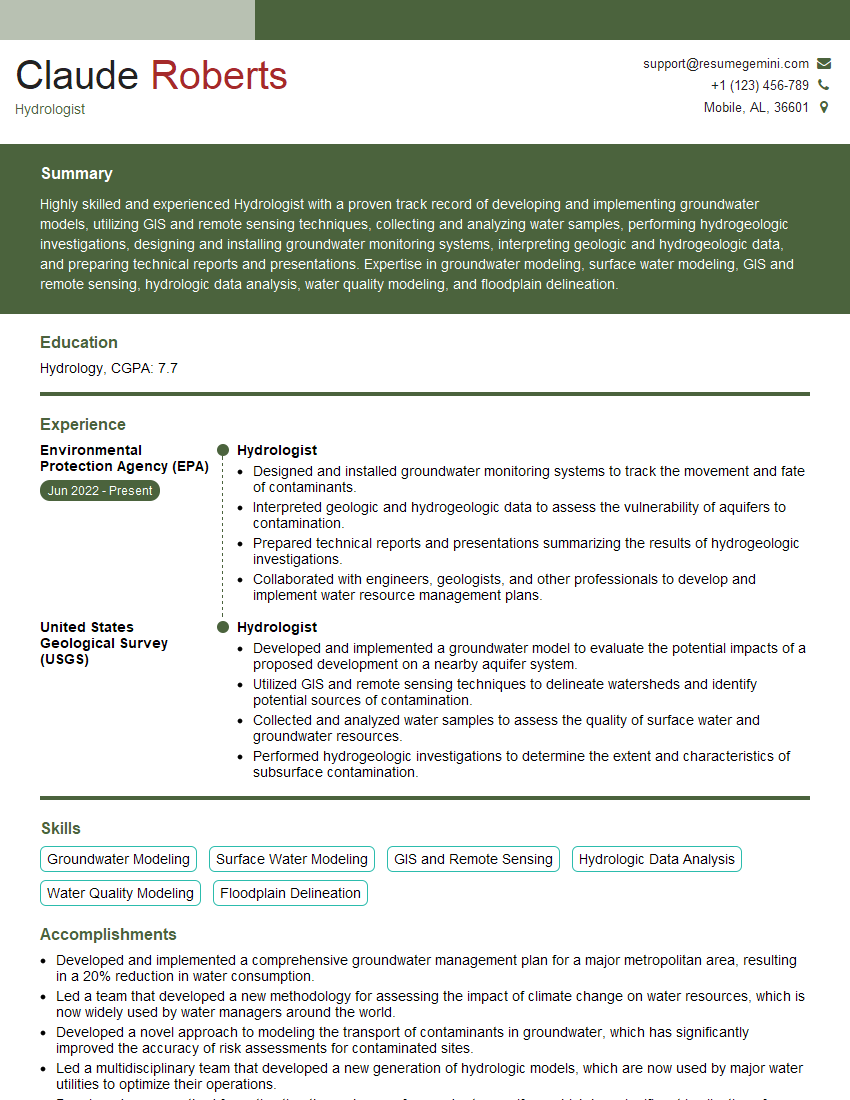
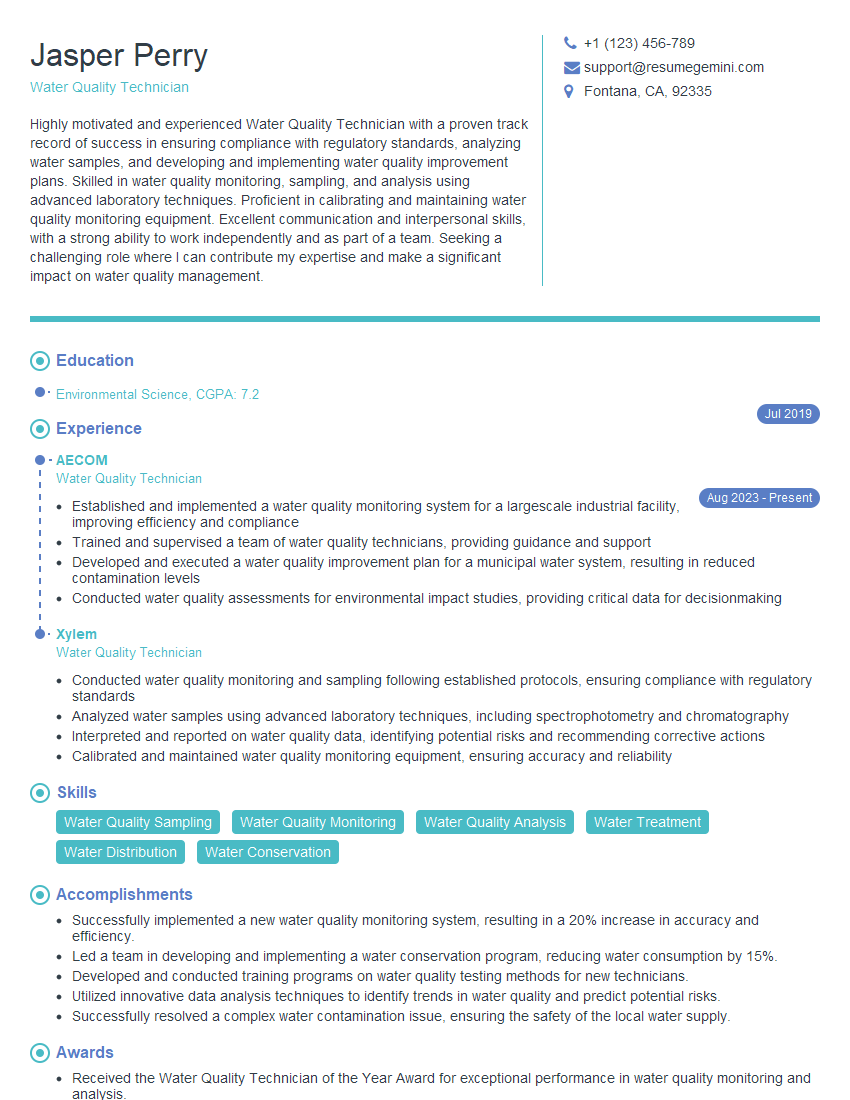
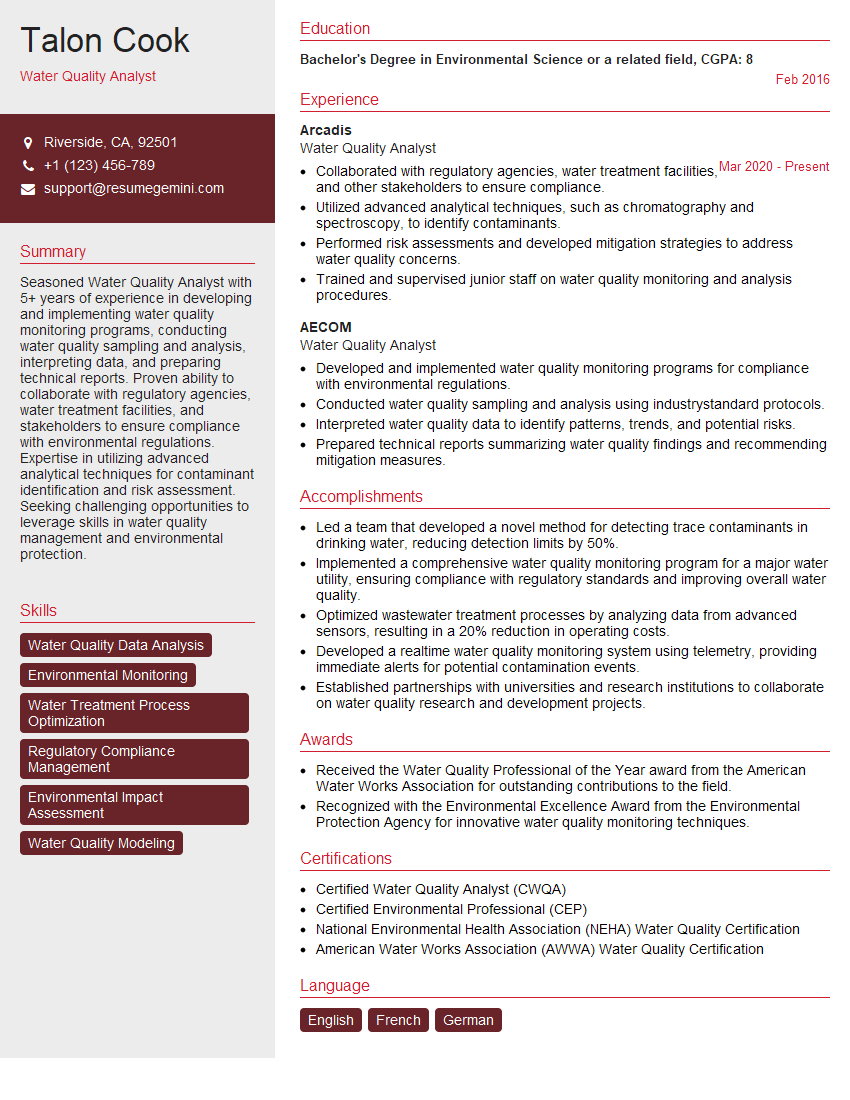
Are you ready to stand out in your next interview? Understanding and preparing for Water Quality Assessment and Monitoring interview questions is a game-changer. In this blog, we’ve compiled key questions and expert advice to help you showcase your skills with confidence and precision. Let’s get started on your journey to acing the interview.
Questions Asked in Water Quality Assessment and Monitoring Interview
Q 1. Explain the difference between point and non-point source pollution.
Point source pollution and non-point source pollution are two major categories of water pollution, differing significantly in their origin and ease of identification. Point source pollution originates from a single, identifiable source. Think of it like a faucet with a leak – you can pinpoint exactly where the contamination is coming from. Examples include industrial wastewater discharges, sewage treatment plant effluents, and leaking underground storage tanks. These sources are relatively easy to monitor and regulate.
Non-point source pollution, on the other hand, is diffuse and comes from multiple sources spread over a large area. Imagine a gentle rain washing pollutants from a vast farm field into a nearby stream – you can’t pinpoint one single point of origin. Common examples include agricultural runoff (fertilizers, pesticides), urban stormwater runoff (oil, litter, pet waste), and atmospheric deposition (acid rain). Identifying and controlling these sources is far more challenging and typically involves implementing broader strategies like land-use management practices.
Q 2. Describe common water quality parameters and their significance.
Numerous parameters are assessed to determine water quality. These can be broadly categorized into physical, chemical, and biological indicators. Let’s look at some key examples:
- Physical: Temperature, turbidity (cloudiness), color, odor, and dissolved oxygen (DO). DO is crucial for aquatic life; low levels indicate pollution.
- Chemical: pH (acidity/alkalinity), nutrients (nitrates, phosphates – excess leads to eutrophication), heavy metals (lead, mercury, arsenic – toxic even in small concentrations), salinity, and organic pollutants (e.g., pesticides, PCBs). These parameters reflect the presence of specific pollutants and their potential toxicity.
- Biological: Presence and abundance of indicator organisms (e.g., fecal coliforms, which suggest sewage contamination), diversity of aquatic life (a healthy ecosystem boasts high biodiversity), and algal growth (excessive growth points to nutrient pollution).
The significance of these parameters lies in their ability to reveal the overall health of the aquatic ecosystem and whether it’s safe for human use (drinking, recreation) and aquatic life.
Q 3. What are the key indicators of eutrophication in a water body?
Eutrophication, the enrichment of a water body with nutrients, primarily nitrates and phosphates, leads to excessive algal growth (algal blooms). This process severely impacts water quality and aquatic ecosystems. Key indicators include:
- Increased nutrient concentrations: High levels of nitrates and phosphates in the water column are a primary indicator.
- Algal blooms: Visible blooms of algae, often forming dense mats on the water surface, are a clear sign. These blooms can deplete oxygen levels and release toxins.
- Decreased dissolved oxygen: As algae decompose, bacteria consume significant amounts of dissolved oxygen, creating hypoxic (low oxygen) or anoxic (no oxygen) conditions, harming aquatic life.
- Changes in water clarity: Turbidity increases due to algal blooms, reducing light penetration and impacting submerged aquatic plants.
- Fish kills: Oxygen depletion can lead to mass fish mortality.
- Changes in species composition: Eutrophication favors certain species while harming others, leading to a shift in the community structure.
Observing any combination of these indicators strongly suggests eutrophication is occurring.
Q 4. How do you collect and preserve water samples for various analyses?
Proper sample collection and preservation are paramount for accurate water quality analysis. The procedures vary depending on the parameters being measured. Here’s a general overview:
- Collection: Use clean, pre-rinsed bottles made of appropriate material (e.g., glass for trace metals, plastic for other parameters). Avoid contamination. Submerge the bottle below the water surface to avoid surface contamination. Collect samples at various depths to obtain a representative sample. Record the location, date, time, and depth of each sample.
- Preservation: Some parameters require immediate analysis (e.g., DO), while others can be preserved for later analysis. Common preservation methods include refrigeration (4°C), addition of preservatives (e.g., acid for metals, mercuric chloride for bacteria – but alternatives are often preferred due to toxicity concerns), and filtration (to remove particulate matter).
Specific preservation techniques depend on the intended analyses and should follow established protocols and guidelines to prevent sample degradation and ensure accurate results. For example, samples for biological analysis often need different handling than those for chemical analysis. Using appropriate preservatives prevents changes in the sample composition.
Q 5. Explain the process of conducting a water quality assessment.
A water quality assessment involves a systematic process to evaluate the overall health of a water body. The process typically involves:
- Defining objectives and scope: Clearly state the purpose of the assessment and the specific parameters to be analyzed. What questions need to be answered? What are the intended uses of the water body?
- Data collection: Gather relevant data, including physical characteristics (location, land use), historical records, and water quality data. This often involves field sampling and laboratory analysis.
- Data analysis: Evaluate the collected data, compare it to water quality standards and guidelines, and identify any potential pollution sources or problems.
- Assessment and interpretation: Assess the overall health of the water body based on the analysis, considering the intended use and relevant regulations.
- Reporting and recommendations: Summarize the findings and provide recommendations for management and remediation, if needed.
The assessment may be a one-time event or part of a long-term monitoring program to track changes over time. Interpreting the results often involves comparing data to established water quality criteria to determine if the water body meets the standards for its designated use.
Q 6. Describe different water quality monitoring methods.
Various methods exist for water quality monitoring, ranging from simple field tests to sophisticated laboratory analyses. These methods can be broadly classified as:
- In-situ measurements: Direct measurements in the field using portable instruments (e.g., DO meters, pH meters, turbidity meters). These provide real-time data but may be less precise than laboratory analyses.
- Laboratory analysis: Samples are collected and transported to a laboratory for detailed chemical and biological analyses. This method provides more precise and accurate data, but it’s more time-consuming and expensive.
- Remote sensing: Satellites and aerial imagery can be used to monitor large areas, assessing factors like water clarity, chlorophyll concentration (an indicator of algal growth), and water temperature. This technique is valuable for large-scale monitoring but requires specialized equipment and expertise.
- Biological assessments: Analyzing the aquatic community structure (types and abundances of species) to assess the health of the ecosystem. This method provides a holistic view but requires taxonomic expertise.
The choice of method depends on the objectives, resources available, and the required level of detail. Often, a combination of methods is employed for a comprehensive assessment.
Q 7. What are the limitations of using biological indicators for water quality assessment?
Biological indicators, while valuable for assessing water quality, have several limitations:
- Species identification requires expertise: Accurate identification of aquatic organisms often requires specialized training and knowledge of taxonomy. Misidentification can lead to inaccurate assessments.
- Response time: Biological communities respond to pollution more slowly than chemical parameters. Changes in species composition may not be immediately apparent.
- Influence of other factors: Biological communities are influenced by numerous environmental factors (e.g., temperature, flow regime, substrate type) besides pollution. Interpreting changes can be challenging if these other factors are not considered.
- Complexity of ecological interactions: Understanding the complex relationships within the ecosystem is crucial for interpreting biological data. A change in one species may trigger a cascade of effects.
- Regional variations: Biological communities vary significantly across geographic regions, so it’s necessary to have regional-specific knowledge to interpret the data correctly.
Despite these limitations, biological indicators provide valuable information on the overall health and integrity of the aquatic ecosystem, complementing chemical and physical data.
Q 8. How do you interpret water quality data and identify trends?
Interpreting water quality data involves more than just looking at numbers; it’s about understanding the story they tell. We use statistical methods like trend analysis, correlation analysis, and time series analysis to identify patterns and changes in water quality parameters over time. For example, a consistently increasing concentration of nitrates might indicate agricultural runoff, while a sudden spike in E. coli could signal a fecal contamination event.
Step-by-step process:
- Data Collection & Cleaning: Ensure data is accurate, complete, and consistent. This involves handling missing values and outliers.
- Descriptive Statistics: Calculate means, medians, standard deviations, and ranges to get a general overview of the data.
- Trend Analysis: Use graphical methods (e.g., time series plots) and statistical tests (e.g., Mann-Kendall test) to detect upward or downward trends in parameters.
- Correlation Analysis: Investigate relationships between different water quality parameters. For instance, a strong positive correlation between phosphate and algae growth could point to eutrophication.
- Spatial Analysis: Mapping data helps visualize spatial patterns and pinpoint pollution sources. A cluster of high turbidity readings could indicate a specific area needing attention.
- Interpretation & Reporting: Combine all analysis results to provide a comprehensive interpretation of the water quality trends and their potential causes, including recommendations for mitigation measures.
Imagine a scenario where we’re monitoring a lake. By tracking dissolved oxygen levels over several years and comparing them with rainfall data, we might observe a negative correlation – lower dissolved oxygen during periods of heavy rainfall, potentially indicating increased runoff bringing pollutants into the lake.
Q 9. What are the regulatory standards for water quality in your region?
Regulatory standards for water quality vary significantly depending on the specific region and the intended use of the water (drinking water, recreation, irrigation, etc.). In many jurisdictions, these standards are set by national or state/provincial environmental agencies and are based on guidelines from organizations like the World Health Organization (WHO) or the Environmental Protection Agency (EPA).
For example, the EPA in the United States sets maximum contaminant levels (MCLs) for various pollutants in drinking water, ensuring it’s safe for human consumption. These MCLs cover parameters like bacteria, nitrates, pesticides, and heavy metals. Similarly, water quality standards for recreational waters often focus on parameters like E. coli levels, ensuring the water is safe for swimming and other activities. Violation of these standards can result in penalties and enforcement actions.
It’s crucial to consult the specific regulatory framework applicable to your region to understand the exact standards and compliance requirements.
Q 10. Explain the impact of human activities on water quality.
Human activities have profound and multifaceted impacts on water quality. Pollution from various sources degrades water quality, threatening both aquatic ecosystems and human health. Key impacts include:
- Agricultural Runoff: Fertilizers and pesticides used in agriculture contaminate waterways, causing eutrophication (excessive nutrient enrichment) and harming aquatic life.
- Industrial Discharges: Industries release various pollutants, including heavy metals, chemicals, and heated water, which can severely damage aquatic ecosystems and render water unsuitable for human use.
- Sewage and Wastewater: Untreated or inadequately treated sewage introduces pathogens, nutrients, and organic matter, leading to waterborne diseases and eutrophication.
- Urban Runoff: Stormwater runoff from urban areas carries pollutants like oil, grease, heavy metals, and litter, degrading water quality.
- Mining Activities: Mining operations can lead to acid mine drainage, releasing heavy metals and other toxic substances into water bodies.
- Deforestation and Land Use Changes: Removing vegetation increases soil erosion, leading to increased sediment and nutrient runoff into waterways.
For instance, the overuse of fertilizers in farming can lead to high nitrate levels in groundwater, making it unsafe for drinking. Similarly, industrial discharge of heavy metals can cause bioaccumulation in aquatic organisms, posing a risk to the food chain and human health.
Q 11. Describe various water treatment technologies and their effectiveness.
Many water treatment technologies exist, each with its strengths and limitations, depending on the type and concentration of pollutants. The selection of appropriate technologies depends on the specific water quality issues and the desired level of treatment.
- Coagulation and Flocculation: Removes suspended solids by adding chemicals that cause particles to clump together and settle out.
- Sedimentation: Allows suspended solids to settle out of the water by gravity.
- Filtration: Removes suspended solids and some dissolved impurities using various filter media (sand, gravel, activated carbon).
- Disinfection: Kills or inactivates harmful microorganisms (bacteria, viruses, protozoa) using chlorine, UV radiation, or ozone.
- Reverse Osmosis: Removes dissolved salts, minerals, and other impurities using a semi-permeable membrane.
- Activated Carbon Adsorption: Removes organic compounds, taste, and odor using activated carbon.
- Aerated Lagoons: Biological treatment systems using microorganisms to break down organic matter.
The effectiveness of each technology is assessed by monitoring the reduction in pollutant concentrations before and after treatment. For example, a well-designed filtration system can effectively remove suspended solids, while disinfection significantly reduces the number of harmful microorganisms. However, no single technology is a perfect solution, and often a combination of methods is necessary to achieve the desired water quality.
Q 12. How do you assess the risk of waterborne diseases?
Assessing the risk of waterborne diseases involves identifying potential sources of contamination, evaluating the likelihood of exposure, and determining the potential severity of the health impacts. This is a multi-step process that combines microbiological analysis with epidemiological data and risk assessment models.
Steps involved:
- Microbiological Monitoring: Regularly testing water samples for the presence of indicator organisms (e.g., E. coli, fecal coliforms) and pathogens (e.g., Salmonella, Giardia).
- Water Quality Assessment: Analyzing various water quality parameters (pH, turbidity, dissolved oxygen) to identify potential sources of contamination.
- Exposure Assessment: Evaluating the potential for human exposure to contaminated water through drinking, recreational activities, or contact with contaminated surfaces.
- Dose-Response Assessment: Determining the relationship between exposure levels and the likelihood of illness.
- Risk Characterization: Combining the above information to estimate the overall risk of waterborne disease.
For example, a high level of E. coli in a swimming area would indicate a high risk of gastrointestinal illness. The risk assessment would then consider factors such as the number of people using the area, the duration of exposure, and the age and health of those exposed.
Q 13. What is the role of GIS in water quality monitoring and management?
Geographic Information Systems (GIS) are invaluable tools for water quality monitoring and management. GIS allows us to spatially analyze water quality data, visualize trends, and manage data effectively. This is particularly useful in large-scale monitoring projects or when dealing with complex spatial patterns.
- Data Management and Visualization: GIS provides a platform to store, manage, and visualize water quality data from various sources (sampling locations, laboratory results, weather data).
- Spatial Analysis: GIS enables the identification of spatial patterns and relationships between water quality parameters and environmental factors. For example, we can overlay water quality data with land use maps to identify pollution sources.
- Modeling and Prediction: GIS can be integrated with hydrological and water quality models to predict the fate and transport of pollutants in the environment.
- Decision Support: GIS supports decision-making by providing a visual representation of water quality information, facilitating targeted interventions and resource allocation.
For example, using GIS, we can map the distribution of high nitrate concentrations in groundwater, identify areas at risk, and develop strategies for reducing nitrate contamination. GIS facilitates better communication and collaboration among stakeholders, allowing for more efficient and targeted water quality management.
Q 14. Explain the concept of water quality modeling.
Water quality modeling involves using mathematical equations and computer programs to simulate the behavior of pollutants in aquatic environments. These models help us understand the transport, transformation, and fate of pollutants, predict future water quality conditions, and evaluate the effectiveness of different management strategies.
Types of Models:
- Empirical Models: Relate water quality parameters to easily measured variables using statistical relationships. They are relatively simple but may lack mechanistic detail.
- Process-Based Models: Simulate the underlying physical, chemical, and biological processes affecting water quality (e.g., nutrient cycling, sediment transport). They are more complex but provide a more mechanistic understanding.
Applications:
- Predicting future water quality: Models can predict how water quality might change under different scenarios (e.g., climate change, land use changes).
- Evaluating the effectiveness of management strategies: Models can be used to assess the potential impact of different pollution control measures (e.g., wastewater treatment upgrades, riparian buffer strips).
- Identifying pollution sources: Models can help pinpoint sources of contamination by simulating pollutant transport and transformation.
For example, a process-based model might simulate the movement of nutrients in a river, considering factors like flow rate, nutrient inputs, and biological processes. This model can then be used to predict the impact of reducing fertilizer use on downstream water quality.
Q 15. How do you address data gaps in water quality assessments?
Addressing data gaps in water quality assessments requires a multi-pronged approach. It’s crucial to understand the reason for the gap – was it due to equipment malfunction, inaccessibility of the sampling location, or simply missed sampling events?
First, we investigate the cause. If it’s a systematic issue, we adjust our sampling strategy. For instance, if a remote sensor consistently fails, we might switch to a more robust model or implement redundancy with additional sensors. If the gap is due to logistical challenges, we might explore alternative sampling methods or collaborate with other agencies who may have complementary data.
Secondly, we employ spatial and temporal interpolation techniques. For example, if we have missing data for a specific parameter at a particular location, we can use kriging or inverse distance weighting to estimate the missing values based on data from surrounding locations. The choice of method depends on the spatial correlation of the data. For temporal gaps, we could use time series analysis models to predict values based on historical trends, accounting for seasonality and other relevant factors.
Finally, we acknowledge the uncertainty associated with interpolated data. We always clearly document the methods used to fill the gaps and quantify the uncertainty associated with the estimates. Transparency is key, and readers must understand the limitations of the analysis due to incomplete data. For example, I once worked on a project where we had missing nutrient data during a major rainfall event. We used a combination of interpolation and statistical modeling to estimate the missing data, but clearly stated the higher uncertainty associated with those estimates in the final report.
Career Expert Tips:
- Ace those interviews! Prepare effectively by reviewing the Top 50 Most Common Interview Questions on ResumeGemini.
- Navigate your job search with confidence! Explore a wide range of Career Tips on ResumeGemini. Learn about common challenges and recommendations to overcome them.
- Craft the perfect resume! Master the Art of Resume Writing with ResumeGemini’s guide. Showcase your unique qualifications and achievements effectively.
- Don’t miss out on holiday savings! Build your dream resume with ResumeGemini’s ATS optimized templates.
Q 16. What are the ethical considerations in water quality assessment?
Ethical considerations in water quality assessment are paramount. The results directly impact public health, environmental protection, and resource management decisions. Therefore, objectivity, transparency, and integrity are crucial.
- Data Integrity: We must ensure data are collected, analyzed, and reported accurately and honestly. Manipulating data or selectively reporting results to favor a particular outcome is unethical and potentially illegal.
- Transparency: Our methods and limitations must be clearly communicated. This includes disclosing any potential conflicts of interest and ensuring data are accessible to stakeholders. For example, if I receive funding from a specific industry, it is essential to disclose this potential conflict and ensure my analysis remains unbiased.
- Confidentiality: We must respect the confidentiality of data, especially sensitive information about individuals or businesses. Data must be securely stored and accessed only by authorized personnel. For example, data related to a private company’s discharge permits must be protected from unauthorized disclosure.
- Social Justice: We must consider the environmental justice implications of our assessments. This means recognizing that marginalized communities often disproportionately bear the burden of poor water quality and ensuring equitable access to clean water resources.
In my experience, adherence to a strong ethical code is essential to building trust with stakeholders and ensuring that our work contributes to positive environmental outcomes.
Q 17. Describe your experience with different laboratory techniques used in water quality analysis.
My experience encompasses a wide range of laboratory techniques for water quality analysis. These include:
- Spectrophotometry: Used to determine the concentration of various substances based on their absorbance or transmission of light at specific wavelengths. For example, determining nutrient concentrations (nitrate, phosphate) using colorimetric methods.
- Titration: Used to quantify the concentration of specific ions in water, such as alkalinity, acidity, or chloride.
- Ion Chromatography (IC): A powerful technique used to separate and quantify various ions (e.g., anions, cations) in a water sample. This is particularly useful for detecting pollutants like heavy metals or other dissolved inorganic substances.
- Inductively Coupled Plasma Mass Spectrometry (ICP-MS): A highly sensitive technique employed to detect and quantify trace metals in water samples, which is vital for assessing heavy metal contamination.
- Gas Chromatography-Mass Spectrometry (GC-MS): Used to analyze volatile organic compounds (VOCs) in water, such as solvents and pesticides.
- Microbiological Analysis: This includes methods such as plate counting, membrane filtration, and most probable number (MPN) estimations to determine the presence and concentration of bacteria, viruses, and other microorganisms. This is crucial for assessing water potability.
I am proficient in the operation and maintenance of these instruments and understand the quality control measures necessary to ensure accurate and reliable results.
Q 18. How do you ensure the accuracy and precision of water quality data?
Ensuring the accuracy and precision of water quality data is a critical aspect of our work, achieved through rigorous quality control (QC) and quality assurance (QA) measures at every stage of the process.
- Calibration and Standardization: Regular calibration of instruments using certified reference materials is vital for accurate measurements. We use appropriate standards for each analyte being measured.
- Blank Samples and Spiked Samples: Blank samples are used to check for contamination in the laboratory or field, while spiked samples (samples with known concentrations of analytes) help assess the accuracy of our methods. This provides insight into the reliability and accuracy of the measured values.
- Duplicate Samples: Analyzing duplicate samples allows for an assessment of the precision of the measurements. High variability between duplicates indicates issues with the method or instrument.
- Chain of Custody: A strict chain of custody is maintained to ensure the integrity of samples from collection to analysis. Detailed records track every step of the sampling and analysis process.
- Data Validation: Before analysis, raw data undergo rigorous validation to identify and correct any outliers or anomalies. Statistical tools are used to identify suspect data points.
- Method Validation: Regular validation of laboratory methods, including recovery studies and accuracy checks, helps to ensure that results are reliable and consistent.
These measures, implemented systematically, minimize errors and enhance the confidence in our water quality data.
Q 19. Explain your experience with data analysis software used in water quality management.
I am proficient in several data analysis software packages commonly used in water quality management. My experience includes:
- R: A powerful statistical programming language used for data analysis, visualization, and modeling. I use R for statistical analysis of water quality data, time series analysis, spatial interpolation, and creating custom plots and reports.
- Python with relevant libraries (Pandas, NumPy, SciPy): Python provides a robust platform for data manipulation, statistical analysis, and machine learning applications. I have used Python for automating data processing tasks, developing predictive models, and visualizing data in interactive dashboards.
- ArcGIS: A geographic information system (GIS) software package I use for spatial analysis, mapping water quality data, creating thematic maps and exploring the spatial relationships between water quality parameters and environmental factors.
- Spreadsheet Software (Excel, Google Sheets): For routine data management, calculations, and preliminary data exploration.
Proficiency in these tools is essential for effectively managing, analyzing, and interpreting large datasets in water quality assessments and reporting.
Q 20. Describe your familiarity with relevant water quality regulations and standards.
My familiarity with water quality regulations and standards is extensive. I’m well-versed in national and international guidelines, including:
- The Clean Water Act (CWA) in the United States: I understand the CWA’s stipulations concerning water quality standards, effluent limitations, and the National Pollutant Discharge Elimination System (NPDES) permits.
- The Safe Drinking Water Act (SDWA) in the United States: I’m familiar with the regulations and standards governing drinking water quality and the monitoring requirements for public water systems.
- World Health Organization (WHO) Guidelines for Drinking Water Quality: I utilize WHO guidelines to assess drinking water quality in international contexts.
- European Union Water Framework Directive (WFD): I am aware of the ecological aspects of water quality management and standards as defined by the WFD.
- Specific state and local regulations: I have worked on projects requiring knowledge of diverse regional regulations, allowing me to adapt my approach to specific geographical and legal contexts.
Staying updated on these regulations and their potential changes is critical to ensuring that our assessments comply with all applicable laws and requirements.
Q 21. How do you communicate complex water quality information to non-technical audiences?
Communicating complex water quality information to non-technical audiences requires careful consideration of the audience and the message. I use several strategies:
- Simple Language: Avoid jargon and technical terms; instead, use clear, concise language that is easily understood by everyone.
- Visual Aids: Employ charts, graphs, and maps to visually represent data and make complex information more accessible. A well-designed infographic can convey a significant amount of information very effectively.
- Analogies and Metaphors: Use everyday examples and analogies to illustrate complex concepts. For example, comparing bacteria levels in water to the number of people in a crowded room.
- Storytelling: Frame data within a compelling narrative to engage the audience emotionally and make the information more memorable.
- Interactive Presentations: Use interactive elements in presentations to encourage participation and enhance understanding. For example, using polls or quizzes to check for comprehension.
- Targeted Messaging: Tailor the message to the specific audience’s interests and concerns. What is relevant to a community group may be very different from what a government official needs.
By employing these communication techniques, we ensure that our findings are not only accurate but also understood and acted upon by all stakeholders.
Q 22. What are some emerging challenges and trends in water quality management?
Water quality management faces a constantly evolving landscape of challenges. We’re seeing a convergence of factors that demand innovative solutions.
- Climate Change Impacts: More frequent and intense droughts and floods significantly affect water availability and quality. Increased rainfall can lead to higher runoff carrying pollutants into water bodies, while droughts can concentrate pollutants and reduce dilution.
- Emerging Contaminants: Pharmaceuticals, personal care products, and microplastics are increasingly detected in water sources, posing unknown long-term health and ecological risks. Traditional treatment methods often struggle to remove these.
- Population Growth and Urbanization: Expanding urban areas increase the burden on water resources and wastewater treatment systems, leading to higher pollutant loads and potential overflows.
- Aging Infrastructure: Many wastewater treatment plants and water distribution systems are aging and require significant upgrades to maintain efficiency and prevent leaks that contaminate water supplies.
- Data Management and Analytics: The sheer volume of data generated from monitoring networks requires advanced analytics to identify trends, predict problems, and inform management decisions. Better integration and standardization of data are critical.
Addressing these challenges requires a multi-faceted approach combining advanced technologies, improved regulatory frameworks, community engagement, and sustainable water management practices.
Q 23. Describe your experience with water quality remediation projects.
I’ve been involved in numerous water quality remediation projects, ranging from small-scale site cleanups to large-scale watershed restoration initiatives. For instance, I led a project to remediate a contaminated groundwater aquifer affected by industrial discharge. Our approach involved a multi-stage process:
- Site Characterization: We conducted extensive sampling and analysis to identify the extent and nature of the contamination, including the specific pollutants and their concentrations.
- Remediation Strategy Development: Based on the characterization data, we developed a customized remediation plan, considering factors like cost-effectiveness, environmental impact, and regulatory requirements. In this case, we opted for a combination of pump-and-treat technology and bioremediation.
- Implementation and Monitoring: The chosen remediation methods were implemented, and continuous monitoring was conducted to assess the effectiveness of the cleanup effort and make necessary adjustments. We used a variety of techniques, including groundwater monitoring wells and analysis of water samples to track pollutant concentrations.
- Post-Remediation Assessment: After achieving the remediation goals, a thorough assessment was conducted to ensure the long-term stability of the site and prevent future contamination.
Another project involved restoring a degraded wetland ecosystem by removing accumulated sediment and planting native vegetation. This required a collaborative effort with various stakeholders, including government agencies, local communities, and environmental groups.
Q 24. Explain your experience working with stakeholders in water quality projects.
Effective stakeholder engagement is crucial for successful water quality projects. I believe in a participatory approach that values the input and concerns of all involved parties.
- Building Trust and Rapport: Open communication and transparency are essential. I make it a point to actively listen to concerns, answer questions honestly, and provide regular updates on project progress.
- Collaborative Planning: Involving stakeholders in the planning process ensures that the project addresses their needs and priorities. This often involves workshops, public forums, and one-on-one meetings.
- Conflict Resolution: Disagreements are inevitable. I employ collaborative conflict resolution techniques, such as mediation and negotiation, to find mutually acceptable solutions.
- Capacity Building: Empowering stakeholders with the knowledge and skills needed to participate effectively in water quality management is key to long-term success. This may involve providing training or educational resources.
For example, in a project involving agricultural runoff reduction, I worked closely with farmers to implement best management practices. This involved demonstrating the economic and environmental benefits of these practices and offering technical assistance and financial incentives. The result was a significant reduction in nutrient pollution entering the local water body, and increased farmer buy-in.
Q 25. How do you prioritize different water quality issues in a watershed?
Prioritizing water quality issues within a watershed requires a systematic approach that considers multiple factors. I typically use a framework that incorporates:
- Risk Assessment: Identifying potential sources of pollution, their severity, and the vulnerability of water resources. This often involves analyzing data on land use, pollutant concentrations, and ecological sensitivity.
- Stakeholder Input: Understanding the concerns and priorities of communities and other stakeholders is vital. This may involve surveys, public forums, or interviews.
- Cost-Benefit Analysis: Evaluating the costs and benefits of different management options. This considers the economic, environmental, and social impacts.
- Feasibility Assessment: Determining the technical and practical feasibility of implementing different management actions. This involves considering factors like infrastructure availability, regulatory constraints, and community acceptance.
A common tool used is a matrix that ranks various issues based on their severity, likelihood, and potential impact. For example, a high-priority issue might be addressing a sewage discharge contaminating a drinking water source, while a lower priority might be managing agricultural runoff from a less sensitive area. The prioritization process is iterative and may change based on new information or evolving circumstances.
Q 26. Explain your understanding of the different types of water quality indices.
Water quality indices (WQIs) are numerical tools designed to summarize the overall quality of a water body based on multiple parameters. Different indices exist, each with its own strengths and limitations.
- Simple Arithmetic Indices: These indices assign weights to individual parameters and sum them to get an overall score. A simple example is a weighted average of different water quality parameters (e.g., dissolved oxygen, pH, nutrients). While easy to calculate, they don’t account for interactions between parameters.
- Normalized Indices: These indices normalize the individual parameters to a common scale (typically 0-1) before combining them, improving comparability across different datasets. Examples include the National Sanitation Foundation (NSF) water quality index and the Canadian Water Quality Index (CWQI).
- Biological Indices: These indices focus on the health of aquatic communities as an indicator of water quality. They use the presence, abundance, or diversity of certain species (like benthic macroinvertebrates) to assess the overall ecological integrity of the water body. Examples include the Biological Monitoring Working Party (BMWP) score and the Average Score per Taxon (ASPT).
- Combined Indices: Some indices combine physical, chemical, and biological parameters to provide a more holistic assessment of water quality. These aim to represent the complexity of aquatic ecosystems.
The choice of appropriate WQI depends on the specific objectives, available data, and intended use. It’s crucial to understand the limitations of any index and interpret the results carefully within their context.
Q 27. Describe a situation where you had to troubleshoot a problem related to water quality monitoring.
During a long-term monitoring project of a river system, we encountered unexpectedly high levels of nitrates in a specific section. Initial data seemed unreliable, so we initiated a troubleshooting process:
- Data Verification: We checked the analytical procedures, calibration records of the instruments, and the chain of custody for the samples to rule out errors in sample collection, processing, or analysis.
- Field Investigation: A site visit revealed a newly constructed agricultural drainage ditch discharging directly into the river at that location. This was undocumented.
- Sampling Strategy Adjustment: We adjusted our sampling strategy to include additional sites upstream and downstream of the new drainage point, and increased sampling frequency to better define the plume.
- Data Analysis: We used statistical methods to identify potential outliers and assess the spatial and temporal patterns of nitrate concentrations. This helped confirm the source of contamination.
This highlighted the importance of regular equipment checks, field investigations to verify data sources, and having a flexible sampling plan capable of adapting to unexpected findings.
Q 28. How would you handle conflicting data from different water quality monitoring methods?
Conflicting data from different monitoring methods is a common challenge. It necessitates a thorough investigation to identify the root cause of the discrepancies.
- Data Quality Assessment: Carefully review the methodology and quality assurance/quality control (QA/QC) measures for each method. Identify any potential biases or limitations. For instance, different sampling techniques might capture different aspects of the water column.
- Method Comparison Analysis: Use statistical analysis to compare the data from different methods. Identify systematic differences and assess their significance. This could involve linear regression or other statistical comparisons.
- Source Identification: Investigate potential sources of error, such as instrument malfunction, improper sampling techniques, or contamination during sample handling. If possible, perform inter-calibration exercises between different equipment and laboratories.
- Consensus Building: If discrepancies remain, a weighted average or a consensus-based approach might be used, giving more weight to methods with better QA/QC and reliability. This would involve discussion with experts to interpret the findings.
- Further Investigation: If the discrepancies are significant and cannot be resolved, further investigation may be necessary. This might include deploying additional monitoring methods or conducting targeted studies.
Ultimately, the goal is to arrive at a reliable and consistent picture of water quality, even with inherent uncertainties.
Key Topics to Learn for Water Quality Assessment and Monitoring Interview
- Water Quality Parameters: Understanding key physical, chemical, and biological indicators (e.g., pH, turbidity, dissolved oxygen, nutrient levels, bacterial counts) and their significance in assessing water quality.
- Sampling and Analysis Techniques: Mastering proper sampling procedures, laboratory analytical methods (e.g., spectrophotometry, chromatography), and data quality control to ensure accurate and reliable results. Practical application: Describing your experience with specific sampling equipment and techniques.
- Water Quality Standards and Regulations: Familiarity with relevant national and international standards and regulations (e.g., EPA guidelines) governing water quality and effluent discharge.
- Data Interpretation and Reporting: Developing skills in interpreting water quality data, identifying trends, and preparing comprehensive reports for various stakeholders. Practical application: Explain how you’ve used statistical analysis to interpret water quality data.
- Water Quality Modeling: Understanding the principles of water quality modeling and its application in predicting and managing water quality in various environments.
- Water Treatment Technologies: Knowledge of different water treatment processes (e.g., coagulation, filtration, disinfection) and their effectiveness in improving water quality. Practical application: Discuss your understanding of the pros and cons of different treatment methods.
- Problem-Solving and Critical Thinking: Demonstrate your ability to analyze complex water quality issues, identify potential sources of pollution, and propose effective solutions. Practical application: Describe a situation where you identified and solved a water quality problem.
- Environmental Legislation and Policy: Understanding the legal framework surrounding water quality management and its implications for assessment and monitoring activities.
Next Steps
Mastering Water Quality Assessment and Monitoring opens doors to a rewarding career with significant impact on public health and environmental protection. Your expertise in this field is highly sought after, offering diverse opportunities for growth and advancement. To maximize your job prospects, crafting a compelling and ATS-friendly resume is crucial. ResumeGemini is a trusted resource that can help you build a professional and effective resume, highlighting your skills and experience in the best possible light. Examples of resumes tailored to Water Quality Assessment and Monitoring are available to guide you. Take the next step towards your dream career—build a standout resume with ResumeGemini today.
Explore more articles
Users Rating of Our Blogs
Share Your Experience
We value your feedback! Please rate our content and share your thoughts (optional).
What Readers Say About Our Blog
This was kind of a unique content I found around the specialized skills. Very helpful questions and good detailed answers.
Very Helpful blog, thank you Interviewgemini team.
