Feeling uncertain about what to expect in your upcoming interview? We’ve got you covered! This blog highlights the most important Water Quality Testing and Analysis interview questions and provides actionable advice to help you stand out as the ideal candidate. Let’s pave the way for your success.
Questions Asked in Water Quality Testing and Analysis Interview
Q 1. Describe the different types of water quality parameters.
Water quality parameters are the various physical, chemical, and biological characteristics used to assess the overall health and suitability of water for a specific purpose. These parameters can be broadly categorized:
- Physical Parameters: These describe the water’s physical attributes. Examples include temperature (affecting dissolved oxygen levels), turbidity (cloudiness indicating sediment or pollutants), color (indicating the presence of organic matter or dissolved substances), odor (a sensory indicator of potential contamination), and pH (acidity or alkalinity, vital for aquatic life).
- Chemical Parameters: These involve the presence and concentration of various chemical substances. Examples are dissolved oxygen (DO, essential for aquatic life), biochemical oxygen demand (BOD, measuring organic pollution), chemical oxygen demand (COD, total oxygen-demanding substances), nutrients like nitrates and phosphates (causing eutrophication), heavy metals (toxic pollutants like lead, mercury, and arsenic), and salinity (salt content).
- Biological Parameters: These assess the presence and abundance of living organisms in the water. This includes indicator bacteria (like E. coli, indicating fecal contamination), phytoplankton (microscopic algae, influencing water clarity and oxygen levels), zooplankton (microscopic animals, part of the food web), and macroinvertebrates (larger organisms like insects and worms, reflecting water quality).
Understanding these parameters helps us determine if the water is safe for drinking, irrigation, recreation, or supporting aquatic ecosystems. For instance, high levels of E. coli clearly indicate fecal contamination and make the water unsafe for drinking.
Q 2. Explain the process of collecting a representative water sample.
Collecting a representative water sample is crucial for accurate water quality assessment. Improper sampling can lead to skewed results and misinterpretations. The process involves several key steps:
- Planning: Determine the sampling objective (e.g., drinking water quality, pollution monitoring), the location(s), the number of samples needed, and the required parameters.
- Sample Site Selection: Choose representative locations that reflect the overall water body’s condition. Avoid areas with obvious disturbances (like discharge points) unless those are the specific focus.
- Equipment: Use clean, pre-rinsed sample bottles made of inert material (e.g., glass or high-density polyethylene) appropriate for the specific parameters. For example, some metals may leach from certain plastics.
- Collection Procedure: For surface water, collect samples at mid-depth and avoid disturbing the sediment. For groundwater, use a dedicated sampling pump or bailer to avoid contamination. Ensure proper labeling with date, time, location, and sampler’s initials.
- Preservation: Some parameters require immediate analysis, while others need preservation to prevent changes before testing. For example, samples for DO analysis should be fixed immediately. Others may need refrigeration or addition of preservatives.
- Chain of Custody: Maintain a complete record of sample handling from collection to analysis, ensuring the integrity of the sample and data.
Imagine sampling a river: You wouldn’t just take one sample near a factory outflow. Instead, you’d collect samples upstream, downstream, and at multiple points across the river’s width to get a comprehensive picture.
Q 3. What are the limitations of common water quality testing methods?
Common water quality testing methods have limitations that need to be considered when interpreting results. Some key limitations include:
- Method-Specific Interference: Some methods are sensitive to the presence of other substances in the water. For example, high turbidity can interfere with spectrophotometric measurements.
- Detection Limits: All methods have a lower detection limit; concentrations below this cannot be accurately measured. This is crucial when assessing trace contaminants.
- Matrix Effects: The water’s composition (e.g., salinity, organic matter) can affect the accuracy of certain tests. For example, high salinity can interfere with some ion chromatography analysis.
- Sample Representativeness: As mentioned earlier, poor sampling techniques can significantly impact the results’ validity, leading to inaccurate conclusions.
- Cost and Time: Sophisticated methods often require specialized equipment and skilled personnel, increasing the cost and time involved.
For example, a simple colorimetric test for chlorine might be less accurate than a more sophisticated electrochemical method in a complex water matrix. Understanding these limitations is crucial for interpreting results properly and selecting the most suitable testing method.
Q 4. How do you ensure the accuracy and precision of water quality data?
Ensuring accuracy and precision in water quality data requires a multi-faceted approach:
- Calibration and Standardization: Regular calibration of instruments using certified standards is essential. This ensures that measurements are traceable to internationally recognized standards. For example, a spectrophotometer used for measuring nutrient levels needs regular calibration.
- Quality Control (QC) and Quality Assurance (QA): Implement a robust QC/QA program that includes the use of blanks, duplicates, spiked samples, and proficiency testing to monitor the accuracy and precision of the entire analytical process.
- Proper Sample Handling: Adhering to strict sample collection, preservation, and storage procedures minimizes errors arising from sample degradation or contamination.
- Data Validation: Thoroughly review the data for inconsistencies, outliers, and potential errors before reporting. Statistical methods can help identify anomalies.
- Method Validation: For new or infrequently used methods, rigorous validation is crucial to ensure their accuracy and reliability before application.
- Personnel Training: Well-trained personnel are crucial for performing tests correctly and interpreting results accurately. Regular training and competency assessments are necessary.
Think of it like baking a cake: you need precise measurements, the right ingredients, and proper baking techniques to achieve the desired result. Similarly, precise procedures, validated methods and quality control are essential for obtaining reliable water quality data.
Q 5. Describe your experience with different water quality instrumentation.
My experience encompasses a wide range of water quality instrumentation, including:
- Spectrophotometers: Used for determining the concentration of various substances based on their light absorption characteristics. I’ve extensively used these for measuring nutrients (nitrates, phosphates), and organic matter.
- Ion Chromatography (IC): This is a powerful technique for separating and quantifying ions (like chloride, sulfate, and various metals) in water samples. I’ve used IC for analyzing trace metals and anions in various water bodies.
- Dissolved Oxygen (DO) Meters: These measure the amount of dissolved oxygen in water, a critical indicator of water quality. I’ve used both optical and electrochemical DO meters in field and laboratory settings.
- Turbidity Meters: Used for measuring the cloudiness of water, indicating sediment load or other suspended particles. I’m familiar with both Nephelometric and Transmissometer methods.
- pH Meters: Essential for measuring the acidity or alkalinity of water samples. I’ve worked with various types, from portable meters to those integrated into automated systems.
- Automated Analyzers: These sophisticated systems can perform multiple tests simultaneously, significantly increasing throughput and efficiency. I have experience operating and maintaining various automated water chemistry analyzers.
Each instrument has its own strengths and weaknesses, and the choice depends on the specific parameters being measured and the resources available.
Q 6. How do you interpret water quality data and reports?
Interpreting water quality data and reports involves a systematic approach:
- Data Review: Begin by thoroughly reviewing the raw data for any inconsistencies, outliers, or errors. Check for proper units and significant figures.
- Comparison to Standards: Compare the measured values to relevant water quality standards and guidelines (e.g., drinking water standards, environmental regulations). This establishes whether the water quality meets the required criteria for its intended use.
- Trend Analysis: Analyze data trends over time to detect patterns and identify potential problems. This often involves graphing the data and looking for increases or decreases in specific parameters.
- Spatial Analysis: If data from multiple locations are available, analyze spatial patterns to identify potential pollution sources or areas of concern. Geographic Information Systems (GIS) are commonly used for this purpose.
- Statistical Analysis: Statistical methods (e.g., correlation analysis, regression analysis) can be used to identify relationships between different parameters and to assess the significance of observed changes.
- Report Writing: The final step involves preparing a comprehensive report summarizing the findings, including tables, graphs, and a clear interpretation of the results. The report should include any limitations of the methods used.
For example, a consistent increase in nitrate levels over several years might indicate agricultural runoff as a pollution source. This interpretation requires not just understanding the data but also contextual knowledge of the area being studied.
Q 7. Explain the significance of various water quality indices (e.g., BOD, COD, DO).
Several water quality indices are crucial for assessing water quality, each providing different perspectives:
- Biochemical Oxygen Demand (BOD): This measures the amount of dissolved oxygen consumed by microorganisms during the decomposition of organic matter in water. High BOD indicates significant organic pollution, often from sewage or industrial waste. A high BOD depletes oxygen, harming aquatic life.
- Chemical Oxygen Demand (COD): This measures the total amount of oxygen required to oxidize all organic and inorganic substances in water using a strong oxidizing agent. COD provides a more comprehensive measure of oxygen-demanding substances than BOD, including those not readily biodegradable.
- Dissolved Oxygen (DO): This is the amount of oxygen dissolved in water. DO is essential for aquatic life; low DO levels can lead to fish kills and other ecological damage. DO levels are affected by several factors, including temperature, BOD, and algal growth.
These three are interconnected. High BOD and COD values lead to decreased DO levels, illustrating the impact of organic pollution on aquatic ecosystems. Understanding these indices helps determine the health and suitability of the water body for various uses. For example, low DO levels would make a river unsuitable for fish farming.
Q 8. How do you handle outliers and inconsistencies in water quality data?
Handling outliers and inconsistencies in water quality data is crucial for ensuring the reliability of our analyses and the accuracy of our conclusions. It’s like finding a rogue data point in a perfectly straight line – it immediately raises questions. My approach involves a multi-step process.
Data Visualization: I begin by visually inspecting the data using scatter plots, box plots, and histograms. This allows me to quickly identify potential outliers that deviate significantly from the overall trend.
Statistical Analysis: I then employ statistical methods like the Grubbs’ test or the modified Z-score to formally assess whether a data point is statistically significant enough to be considered an outlier. This provides an objective measure to support my judgment.
Investigation of Potential Causes: Once an outlier is identified, I investigate the potential causes. This might involve reviewing field notes, checking for instrument malfunctions, or even revisiting the sampling location. For example, a high turbidity reading might be due to a recent storm event, or a unexpectedly low pH might be due to a faulty sensor.
Data Treatment: Based on my investigation, I decide on an appropriate course of action. This could range from removing the outlier if a clear error is found, to transforming the data (e.g., using a logarithmic transformation), or retaining the outlier and documenting its potential impact on the analysis. Removing data should always be carefully justified, though.
For inconsistencies, I look for patterns in the data that may indicate systematic errors, such as instrument drift or variations in sampling procedures. Addressing these inconsistencies often requires improving data collection protocols and applying quality control measures to minimize future issues.
Q 9. What are the common sources of water contamination?
Water contamination sources are incredibly diverse, ranging from natural processes to human activities. Think of it like a river – many things can pollute it along its course.
Point Sources: These are easily identifiable sources like industrial discharges, sewage treatment plants, and leaking underground storage tanks. These are like individual drops of pollution entering the water.
Non-point Sources: These are more diffuse and harder to pinpoint, such as agricultural runoff (fertilizers, pesticides), urban stormwater (oil, litter), and atmospheric deposition (acid rain). These are like rain spreading pollution across the landscape.
Natural Sources: Naturally occurring contaminants like heavy metals in the soil, minerals leaching from rocks, and naturally occurring bacteria can also impact water quality. These are background levels that can be exacerbated by other factors.
The specific contaminants present will depend on the source. For example, industrial discharges might contain heavy metals and organic chemicals, while agricultural runoff might lead to elevated nutrient levels (nitrogen and phosphorus) causing eutrophication.
Q 10. Describe your experience with water quality modeling and simulation.
I have extensive experience with water quality modeling and simulation, primarily using software packages like MIKE 11 and QUAL2K. These tools allow us to simulate the movement and fate of pollutants in aquatic systems.
For example, I used MIKE 11 to model the impact of a proposed new wastewater treatment plant on a nearby river. The model predicted the changes in dissolved oxygen, nutrient levels, and pollutant concentrations downstream, allowing us to optimize the plant design and ensure minimal environmental impact. This involved creating a digital twin of the river system including parameters like flow rate, topography, and pollutant inputs from various sources. We calibrated the model using historical water quality data and validated it against independent observations to ensure accuracy.
In another project, I utilized QUAL2K to evaluate the effectiveness of different water quality management strategies in a lake. We tested various scenarios, like different nutrient reduction targets and different water management practices, to assess which approaches would lead to the greatest improvements in water quality. The model helped us make data-driven decisions and prioritize efforts towards remediation.
Q 11. What are the regulatory requirements for water quality in your region?
The regulatory requirements for water quality vary significantly depending on the location and intended use of the water. However, in my region (I’ll assume a general North American context for this example), key regulations include the Safe Drinking Water Act (SDWA) for drinking water and the Clean Water Act (CWA) for surface waters.
The SDWA sets maximum contaminant levels (MCLs) for various pollutants in drinking water to protect public health. The CWA establishes water quality standards for surface waters, such as rivers and lakes, aiming to maintain water quality suitable for fishing, swimming, and other uses. These standards often involve Total Maximum Daily Loads (TMDLs) to control nutrient and other pollutant inputs into these water bodies. Specific regulations also exist for wastewater discharge permits and monitoring requirements.
My region also has specific regulations related to groundwater protection and the management of stormwater runoff. These regulations vary by state/province and sometimes even on a local level.
Q 12. How do you ensure compliance with water quality regulations?
Ensuring compliance with water quality regulations is a continuous process that involves careful planning, meticulous data collection and analysis, and proactive management. It’s like maintaining a finely tuned machine – continuous monitoring and maintenance is key.
Regular Monitoring: We conduct regular water quality monitoring based on a predefined schedule and using standardized methods. This provides baseline data against which to evaluate compliance.
Data Analysis and Reporting: The collected data undergoes rigorous analysis to determine whether the water quality parameters meet the regulatory limits. Detailed reports are prepared to document findings and demonstrate compliance.
Corrective Actions: If non-compliance is identified, we implement corrective actions to address the issues and bring the water quality back within the regulatory limits. This could involve upgrading treatment facilities, implementing best management practices, or initiating remediation efforts.
Record Keeping: Maintaining accurate and detailed records of all water quality data, analyses, and compliance actions is vital for audits and demonstrating adherence to regulations.
Proactive collaboration with regulatory agencies is crucial, ensuring transparency and timely reporting of any potential issues. This approach reduces risks of penalties and ensures the protection of public health and the environment.
Q 13. Explain your experience with various water treatment technologies.
My experience encompasses a wide range of water treatment technologies, each designed to target specific contaminants. It’s like having a toolkit for different water quality issues.
Conventional Treatment: This involves coagulation, flocculation, sedimentation, filtration, and disinfection, targeting suspended solids, turbidity, and bacteria. This is the most common method for drinking water treatment.
Advanced Oxidation Processes (AOPs): Technologies such as ozone treatment and UV disinfection effectively remove persistent organic pollutants, pathogens, and taste/odor compounds.
Membrane Technologies: Microfiltration, ultrafiltration, nanofiltration, and reverse osmosis are effective for removing a wide range of contaminants, including dissolved solids, salts, and pathogens.
Biological Treatment: This involves using microorganisms to break down organic pollutants in wastewater. This is effective for removing nutrients (nitrogen and phosphorus) and other biodegradable substances.
The choice of technology depends on the specific contaminants present, the desired level of treatment, and economic constraints. For instance, a small community might use conventional treatment, while a large industrial facility might employ a combination of technologies to meet stringent discharge standards.
Q 14. Describe your experience with microbiological water quality analysis.
Microbiological water quality analysis is essential for assessing the presence of harmful pathogens and indicators of fecal contamination. It’s like taking a microscopic look at what might be hidden in the water.
My experience includes performing various microbiological tests, such as:
Total Coliform and E. coli Counts: These are indicator organisms that suggest the presence of fecal contamination. Elevated levels signal potential risks for waterborne diseases.
Heterotrophic Plate Count (HPC): This measures the total number of bacteria in the water, indicating overall microbial activity.
Specific Pathogen Detection: Techniques such as PCR (Polymerase Chain Reaction) and ELISA (Enzyme-Linked Immunosorbent Assay) can be used to detect the presence of specific pathogens, such as Giardia, Cryptosporidium, and Salmonella.
I’m proficient in using standard methods like membrane filtration, multiple tube fermentation, and culture techniques to isolate and identify different microorganisms. Proper sample collection and handling are critical to ensure accurate results. Data interpretation involves understanding the significance of different bacterial counts in relation to water quality standards and public health risks.
Q 15. How do you identify and quantify specific pollutants in water samples?
Identifying and quantifying specific pollutants in water samples involves a multi-step process that depends on the suspected contaminants. We begin by selecting appropriate analytical methods based on the sample matrix and the target pollutants. This selection considers factors such as the expected concentration of the pollutant and the potential presence of interfering substances.
For example, if we suspect the presence of heavy metals like lead or mercury, we might employ techniques like Inductively Coupled Plasma Mass Spectrometry (ICP-MS) or Atomic Absorption Spectroscopy (AAS). These techniques offer high sensitivity and specificity. For organic pollutants like pesticides or pharmaceuticals, methods such as Gas Chromatography-Mass Spectrometry (GC-MS) or High-Performance Liquid Chromatography (HPLC) are often used. These techniques separate and identify the various components within the water sample.
Quantification involves calibrating the instrument using standards of known concentrations of the target pollutants. By comparing the signal produced by the sample to the signal produced by the standards, we can determine the concentration of the pollutant in the original sample. Quality control measures, such as using blanks and spikes, are essential to ensure the accuracy and reliability of the results. Finally, the data is meticulously documented and analyzed, adhering to strict quality assurance procedures.
For instance, in a recent project analyzing a water sample from an industrial site, we suspected the presence of various heavy metals. Using ICP-MS, we successfully identified and quantified lead, cadmium, and chromium at concentrations exceeding safety standards. This detailed analysis allowed us to advise on remediation strategies for the site.
Career Expert Tips:
- Ace those interviews! Prepare effectively by reviewing the Top 50 Most Common Interview Questions on ResumeGemini.
- Navigate your job search with confidence! Explore a wide range of Career Tips on ResumeGemini. Learn about common challenges and recommendations to overcome them.
- Craft the perfect resume! Master the Art of Resume Writing with ResumeGemini’s guide. Showcase your unique qualifications and achievements effectively.
- Don’t miss out on holiday savings! Build your dream resume with ResumeGemini’s ATS optimized templates.
Q 16. What are the health risks associated with poor water quality?
Poor water quality poses significant health risks, impacting human health in various ways. Contamination can lead to a wide range of illnesses, depending on the type and concentration of the pollutants. For example, contaminated water can harbor pathogenic bacteria like E. coli and Salmonella, causing gastrointestinal diseases such as diarrhea, vomiting, and typhoid fever.
Exposure to heavy metals like lead and mercury can result in neurological damage, especially in children. Chronic exposure to arsenic can lead to skin lesions, cardiovascular diseases, and cancers. Pesticides and other organic pollutants can cause a range of adverse health effects, including hormonal disruption and reproductive problems. Additionally, the presence of excessive nitrates can cause methemoglobinemia, particularly dangerous for infants.
The severity of the health risks depends on the concentration of the pollutants, the duration of exposure, and individual susceptibility. Regular monitoring and treatment of water sources are crucial to mitigating these risks. Think of it like this: water is essential for life, and contaminated water is like adding poison to a vital resource – the consequences can be severe.
Q 17. Explain the concept of water quality standards and their importance.
Water quality standards are legally mandated limits on the concentration of various pollutants in water sources. These standards are set by governmental agencies or regulatory bodies based on scientific evidence and risk assessments to protect human health and the environment. They provide a benchmark against which water quality data can be compared. Different standards exist for drinking water, recreational water, and industrial discharge.
The importance of water quality standards is paramount. They ensure that water is safe for consumption, protecting the population from waterborne diseases. They safeguard aquatic ecosystems by preventing pollution and maintaining the biodiversity of water bodies. Furthermore, they provide a framework for managing and regulating water pollution, guiding industries and municipalities in their water treatment and discharge practices.
For instance, the Environmental Protection Agency (EPA) in the US sets drinking water standards that limit the amount of contaminants, such as lead and arsenic, allowed in public water supplies. Exceeding these standards can lead to significant penalties and public health crises. These regulations provide a safeguard for public health and act as a regulatory framework for water management.
Q 18. Describe your experience using different laboratory equipment and software.
Throughout my career, I’ve gained extensive experience using a wide array of laboratory equipment and software relevant to water quality analysis. This includes sophisticated instruments such as ICP-MS, GC-MS, HPLC, and spectrophotometers. I am proficient in operating and maintaining these instruments, ensuring their accuracy and precision. I am also skilled in using various software packages for data acquisition, processing, and analysis.
Specifically, I’m proficient in using software like LIMS (Laboratory Information Management System) for sample tracking, data management, and quality control. I am experienced with statistical software packages such as R and SPSS for data analysis and interpretation. This proficiency enables me to generate comprehensive reports and effectively communicate results to stakeholders.
For example, in one project, I used a LIMS system to manage over 500 water samples collected from different sites. The system helped track the samples, record analytical results, and generate reports that met regulatory requirements. My experience with data analysis software allowed me to conduct statistical analysis, identify trends, and generate visually appealing graphs for our final report.
Q 19. How do you maintain quality control in a water quality laboratory?
Maintaining quality control in a water quality laboratory is crucial to ensure the accuracy and reliability of the results. A robust quality control program incorporates several key elements. We utilize certified reference materials (CRMs) to calibrate instruments and validate analytical methods. These CRMs have known concentrations of pollutants and serve as a check on the accuracy of our measurements. Blank samples, which contain no analytes, are processed alongside the samples to detect potential contamination.
Duplicate samples are analyzed to assess the precision of the methods. Spiked samples, where a known amount of a pollutant is added to a sample, are used to check the recovery efficiency of the analytical methods. Regular instrument calibration and maintenance are essential, ensuring their continued accuracy. Personnel are trained in proper laboratory techniques, emphasizing best practices to minimize errors and maintain data integrity. Internal audits and proficiency testing further ensure that the laboratory adheres to quality standards. Finally, all data is meticulously documented and reviewed to track quality over time.
Imagine baking a cake – using precise measurements and following the recipe ensures consistent results. Similarly, maintaining quality control in our laboratory guarantees the precision and accuracy of our results, crucial for informing decisions about water safety and environmental protection.
Q 20. How do you troubleshoot issues with water quality instrumentation?
Troubleshooting water quality instrumentation involves a systematic approach. It begins with careful observation of the instrument’s behavior, noting any error messages or unusual readings. We then consult the instrument’s manual, troubleshooting guides, or manufacturer’s support resources to identify the potential cause of the problem. Simple issues, like clogged tubing or depleted reagents, can often be resolved through routine maintenance or replacement of parts.
If the problem persists, a more in-depth investigation may be needed. This could involve checking electrical connections, verifying gas flows, or inspecting the instrument’s optical components. It’s crucial to understand the instrument’s operational principles to effectively identify and solve the problem. Sometimes, it may require contacting the manufacturer for technical assistance or calibration. Documentation of troubleshooting steps and solutions is crucial for future reference and quality assurance.
For example, if an ICP-MS instrument is producing unusually high background noise, we might check the cleanliness of the torch, ensure proper gas flows, and verify that the instrument has been properly calibrated. This systematic approach helps us isolate the issue and restore the instrument to proper functionality.
Q 21. Explain your experience with data analysis techniques used in water quality assessments.
Data analysis is a core component of water quality assessments. I have extensive experience utilizing various statistical techniques to interpret and present water quality data. This includes descriptive statistics (mean, median, standard deviation) to summarize data, correlation and regression analysis to examine relationships between different parameters, and hypothesis testing to determine if differences between groups are statistically significant.
I also utilize more advanced techniques, such as multivariate analysis (principal component analysis, cluster analysis) to identify patterns and relationships in large datasets. Spatial analysis techniques are applied when dealing with geographically referenced data, creating maps and visualizing pollution patterns. Time-series analysis is used to track trends in water quality over time, allowing for predictive modeling and forecasting.
Furthermore, I’m adept at using various software packages, like R and SPSS, to perform these analyses. The results are meticulously documented and presented in clear and concise reports, often including graphs and charts to enhance understanding. For instance, in one project, time-series analysis of nutrient data helped us identify seasonal fluctuations and predict potential algal blooms, allowing for proactive management strategies.
Q 22. Describe a situation where you had to solve a complex water quality problem.
One particularly challenging case involved a sudden spike in nitrate levels in a rural community’s drinking water well. Initial investigations pointed to agricultural runoff as the likely culprit, but pinpointing the specific source among numerous farms proved difficult. The problem was complex because the aquifer was heterogeneous, meaning the water flow patterns were unpredictable. Simply looking at proximity to the well wasn’t enough. We needed to understand the groundwater hydrology.
My approach involved a multi-pronged strategy. First, we conducted a detailed hydrogeological survey, employing sophisticated modeling techniques to simulate groundwater flow paths. This allowed us to identify potential contamination pathways from different farms. Second, we took multiple water samples at varying depths and locations around the well, analyzing not just nitrate levels but also other indicators like stable isotopes (which provide information on the water’s origin) and specific microbial markers. Finally, we engaged with the local farmers, explaining the scientific findings in a clear and non-confrontational manner. This collaboration helped us understand their agricultural practices and identify potential points of contamination. Through this collaborative approach, we successfully pinpointed two farms with improper fertilizer management practices as the primary contributors. Implementing best management practices with those farms effectively resolved the nitrate contamination issue.
Q 23. How do you manage and interpret large datasets of water quality information?
Managing and interpreting large water quality datasets requires a combination of technical skills and strategic thinking. I typically use statistical software like R or Python along with specialized Geographic Information Systems (GIS) software.
The process begins with data cleaning and quality control, which involves identifying and correcting errors or outliers. This may involve checking for improbable values, comparing readings against known historical data, and applying appropriate statistical tests. Then, I leverage exploratory data analysis techniques to understand the distribution and relationships within the data. This might involve creating histograms, scatter plots, and box plots to visualize trends and patterns. Advanced statistical methods such as time series analysis or spatial interpolation are then applied depending on the research question. For instance, time-series analysis helps in understanding seasonal patterns and identifying trends, whereas spatial interpolation is crucial to estimate water quality parameters at unsampled locations.
Finally, the interpretation stage involves combining the statistical results with contextual information, such as rainfall data, land use information, and nearby industrial activities, to develop meaningful conclusions and recommendations.
Q 24. What are the ethical considerations in water quality testing and analysis?
Ethical considerations in water quality testing and analysis are paramount. Transparency and accuracy are key. It is crucial to ensure that data collection and analysis methods are scientifically sound and that results are reported accurately and objectively, avoiding any bias or manipulation.
Another key ethical consideration is data integrity and security. Maintaining the confidentiality of data, ensuring proper data storage and access control, and adhering to all relevant data privacy regulations are crucial aspects of ethical practice. Further, we must consider the societal implications of our findings. For example, if a water source is found to be contaminated, we have an ethical obligation to ensure that the information is communicated effectively and promptly to the affected community so they can take appropriate protective measures. Also, we must be mindful of potential conflicts of interest, ensuring that our work is not influenced by external pressures from stakeholders who might benefit from biased results. Finally, it’s important to continuously update our knowledge on best practices and evolving regulations to uphold the highest ethical standards.
Q 25. Describe your understanding of the different types of water bodies and their unique characteristics.
Different water bodies have unique characteristics that influence their water quality.
- Surface waters (rivers, lakes, streams) are dynamic systems affected by rainfall, runoff, and human activities. They are usually oxygenated, but oxygen levels can fluctuate based on factors such as temperature, algal blooms, and pollution. Nutrient levels are another crucial aspect, directly influencing the aquatic ecosystem’s health.
- Groundwater systems are more stable and often exhibit slower changes in water quality. They can be susceptible to pollution from subsurface sources, such as leaking septic systems or industrial spills. Groundwater is generally less susceptible to short-term fluctuations in temperature or oxygen levels, but contaminants can persist for a much longer time compared to surface water.
- Estuaries are transitional zones between freshwater and saltwater, characterized by salinity gradients and mixing of different water masses. Their unique chemistry makes them highly productive ecosystems, but also vulnerable to pollution from both land-based and marine sources.
- Coastal waters are influenced by ocean currents, tides, and wave action. They are subject to various forms of pollution, including runoff from land, sewage discharge, and ocean-based activities.
Understanding these unique characteristics is critical for selecting appropriate sampling and analysis methods, interpreting results, and developing effective management strategies.
Q 26. How do you communicate complex water quality information to non-technical audiences?
Communicating complex water quality information to non-technical audiences requires clear, concise, and engaging communication strategies. I avoid technical jargon as much as possible, preferring simple analogies and visual aids. For example, instead of saying “high turbidity levels,” I might say “the water is cloudy, like muddy tea.”
I often use infographics, charts, and maps to present data visually and create easily understandable summaries of key findings. When presenting results, I focus on the implications for the public rather than dwelling on technical details. For instance, instead of saying “the level of E. coli exceeds the EPA limit,” I might explain that “the bacteria levels in the water are unsafe for swimming or drinking, and it poses a risk to public health.” Active listening is also key; I always leave room for questions and tailor my explanations to address their concerns.
Q 27. Explain your familiarity with various sampling and analytical methods for different water matrices (e.g., surface water, groundwater).
My familiarity with various sampling and analytical methods extends across different water matrices.
For surface water, I routinely use methods like grab sampling for immediate analysis and composite sampling for time-weighted averages. Parameters analyzed range from basic physical properties (temperature, pH, turbidity) to chemical constituents (nutrients, metals, pesticides) and biological indicators (bacteria, algae). Analytical techniques include spectrophotometry, chromatography, and microbiology assays.
Groundwater sampling requires specialized techniques to prevent contamination, often involving purging wells and using dedicated sampling equipment. Analysis might focus on similar parameters as surface water, but with a greater emphasis on persistent contaminants that might indicate long-term pollution.
For wastewater, sampling strategies often involve flow-proportional sampling to account for variations in flow rates. Analysis typically includes tests for organic pollutants, nutrients, and pathogens, using techniques like gas chromatography-mass spectrometry (GC-MS) and enzyme-linked immunosorbent assays (ELISAs).
The choice of sampling and analytical methods always depends on the specific objectives of the study, the characteristics of the water body, and the potential contaminants of concern. Proper quality control procedures are crucial to ensure the accuracy and reliability of the results.
Key Topics to Learn for Water Quality Testing and Analysis Interview
- Water Chemistry Fundamentals: Understanding pH, alkalinity, hardness, dissolved oxygen, and their impact on aquatic life and human health. Be prepared to discuss relevant chemical reactions and equilibrium principles.
- Microbiological Analysis: Familiarize yourself with common waterborne pathogens (e.g., E. coli, coliforms), testing methods (e.g., membrane filtration, MPN), and interpreting results. Understand the significance of microbial indicators.
- Spectrophotometry and Chromatography: Master the principles and applications of these techniques in water quality analysis. Be ready to discuss instrument operation, calibration, and data interpretation.
- Instrumental Analysis Techniques: Gain proficiency in using instruments like ion chromatographs, inductively coupled plasma mass spectrometers (ICP-MS), and other relevant analytical equipment. Understand their limitations and appropriate applications.
- Data Analysis and Interpretation: Practice interpreting complex datasets, identifying trends, and drawing meaningful conclusions. Develop your skills in statistical analysis relevant to water quality data.
- Quality Control and Assurance (QA/QC): Understand the importance of QA/QC in ensuring the accuracy and reliability of water quality test results. Be prepared to discuss standard operating procedures (SOPs) and quality control charts.
- Regulatory Compliance: Familiarize yourself with relevant water quality regulations and standards (e.g., EPA guidelines). Understand how testing procedures ensure compliance.
- Problem-Solving and Troubleshooting: Practice diagnosing and resolving issues related to instrumentation, data analysis, and sample preparation. Be prepared to discuss your approach to troubleshooting in a laboratory setting.
- Health and Safety in the Laboratory: Demonstrate awareness of laboratory safety procedures, including handling hazardous materials and proper waste disposal.
Next Steps
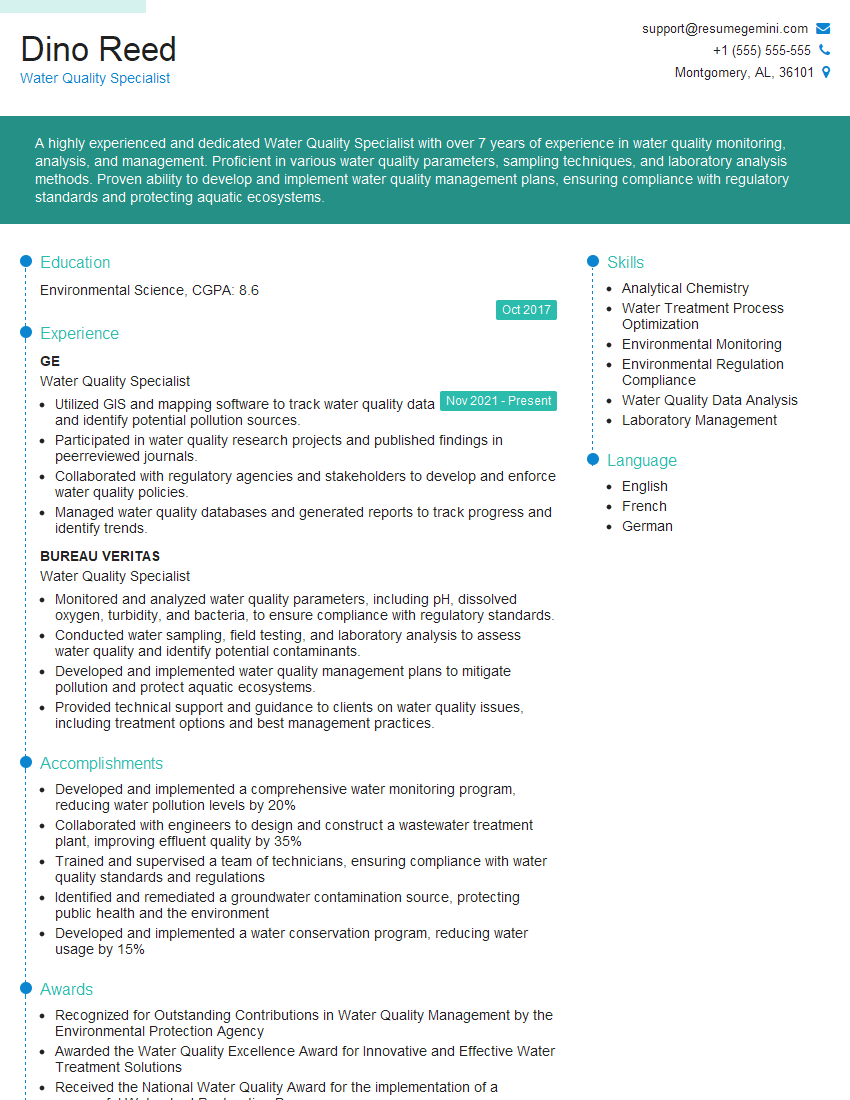
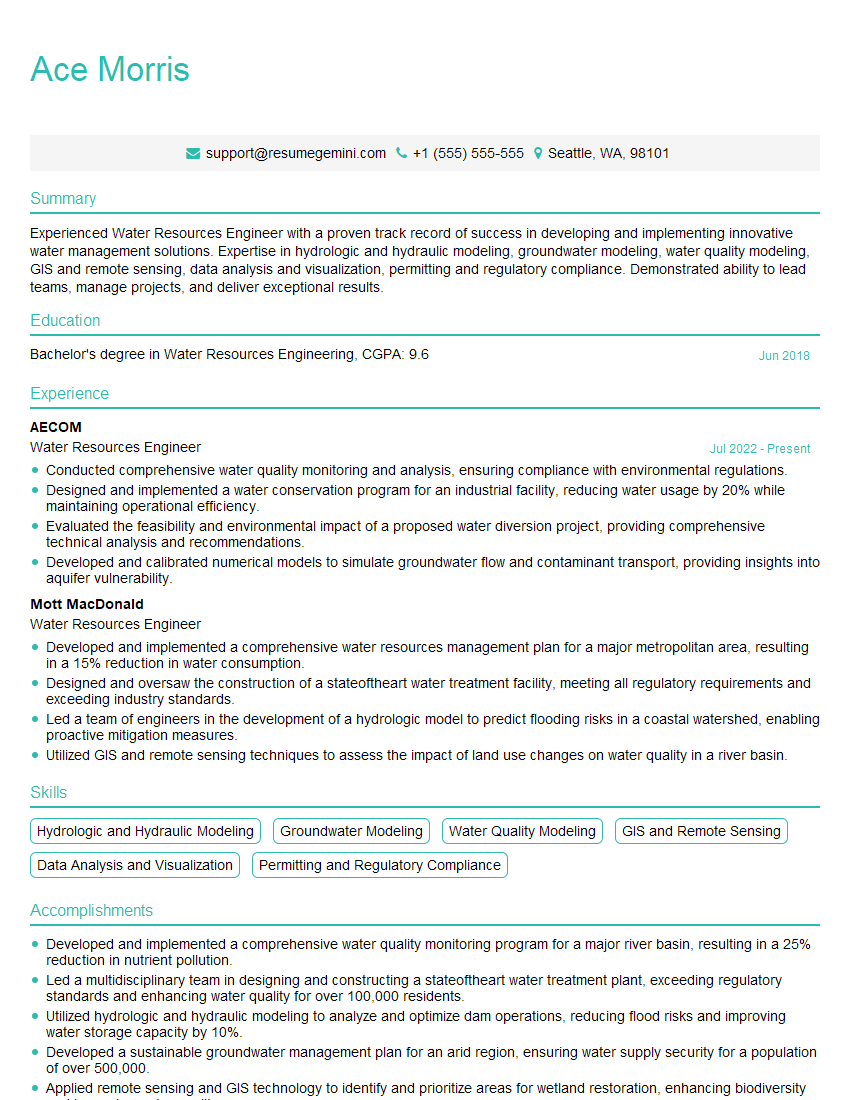
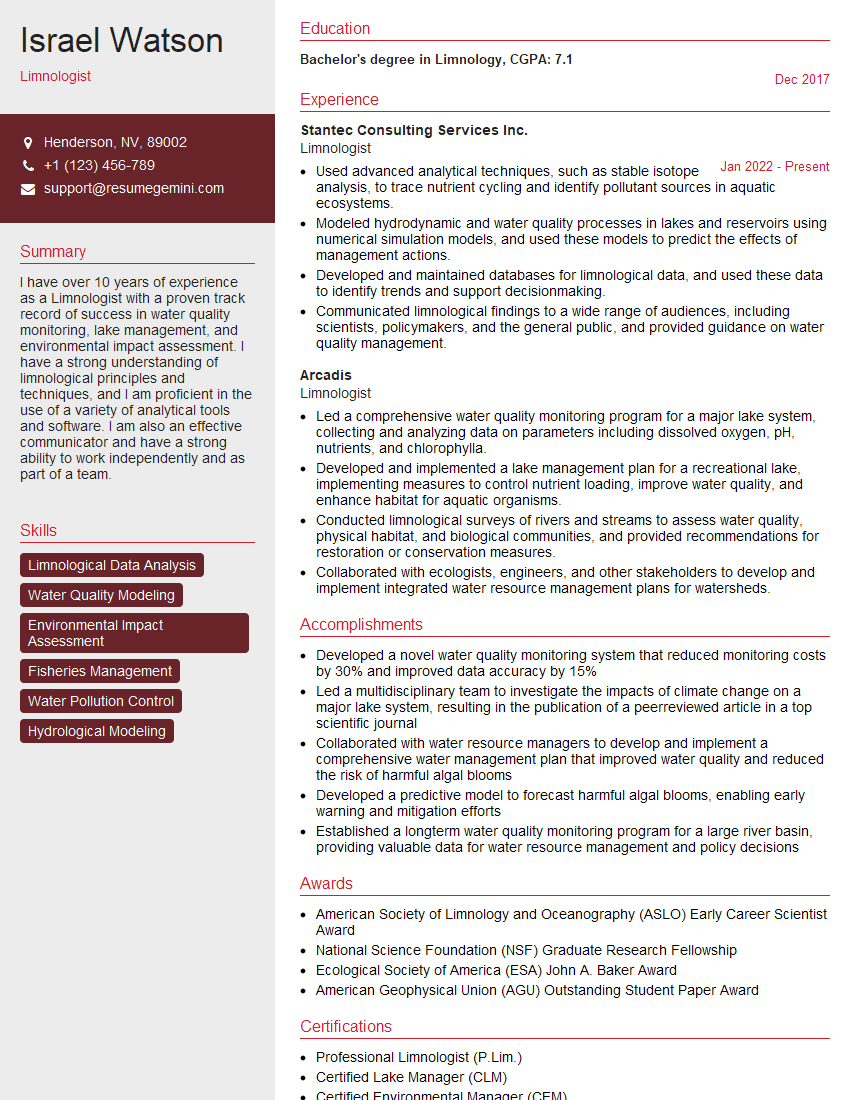
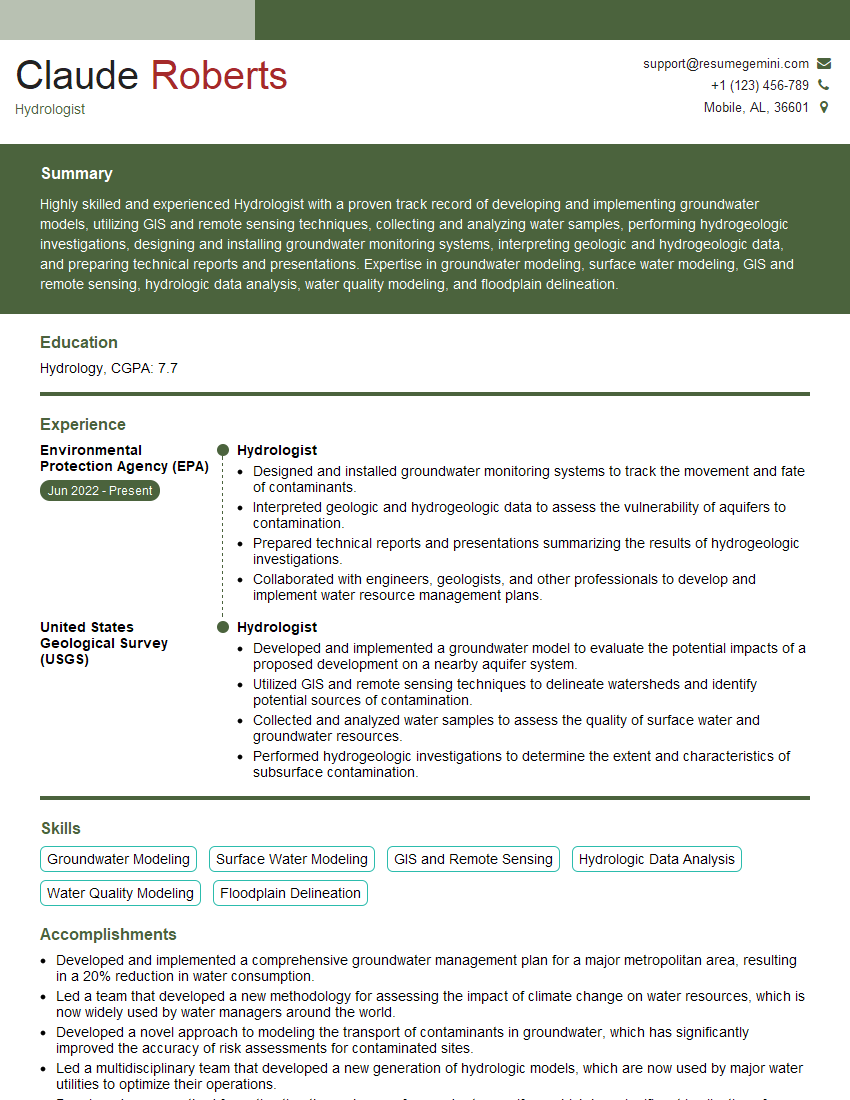
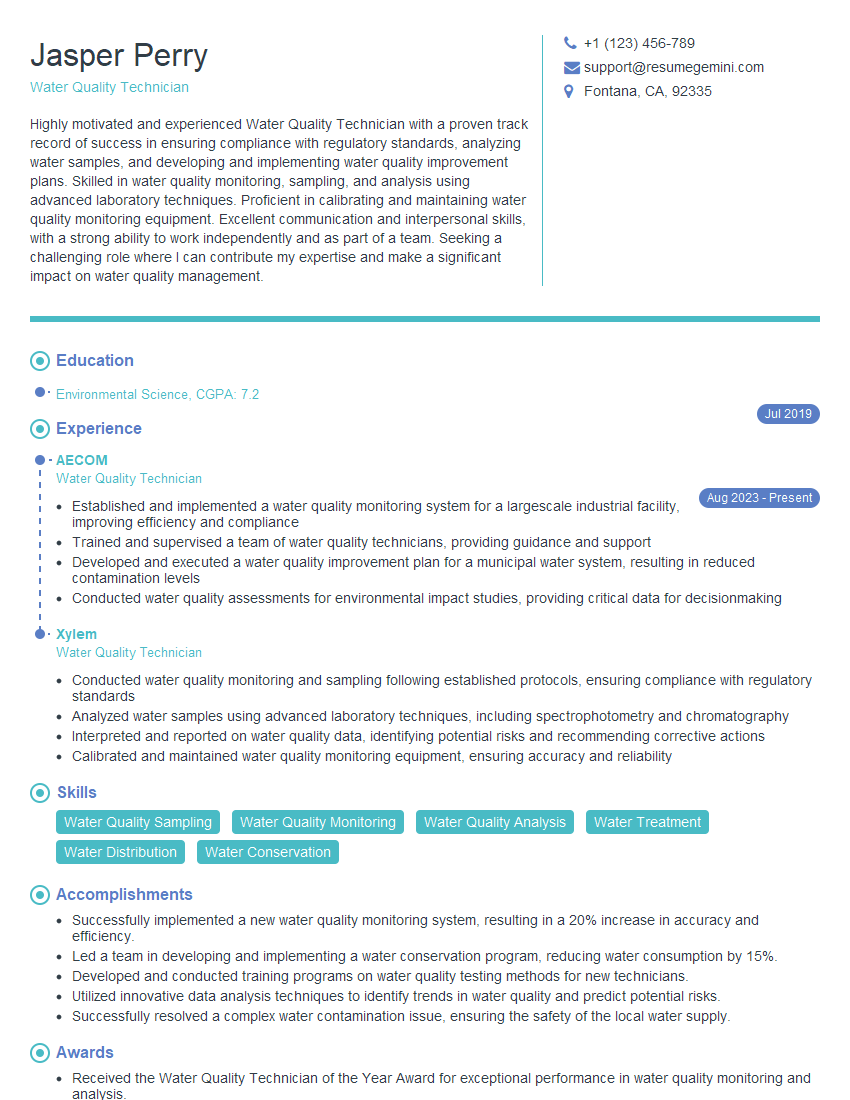
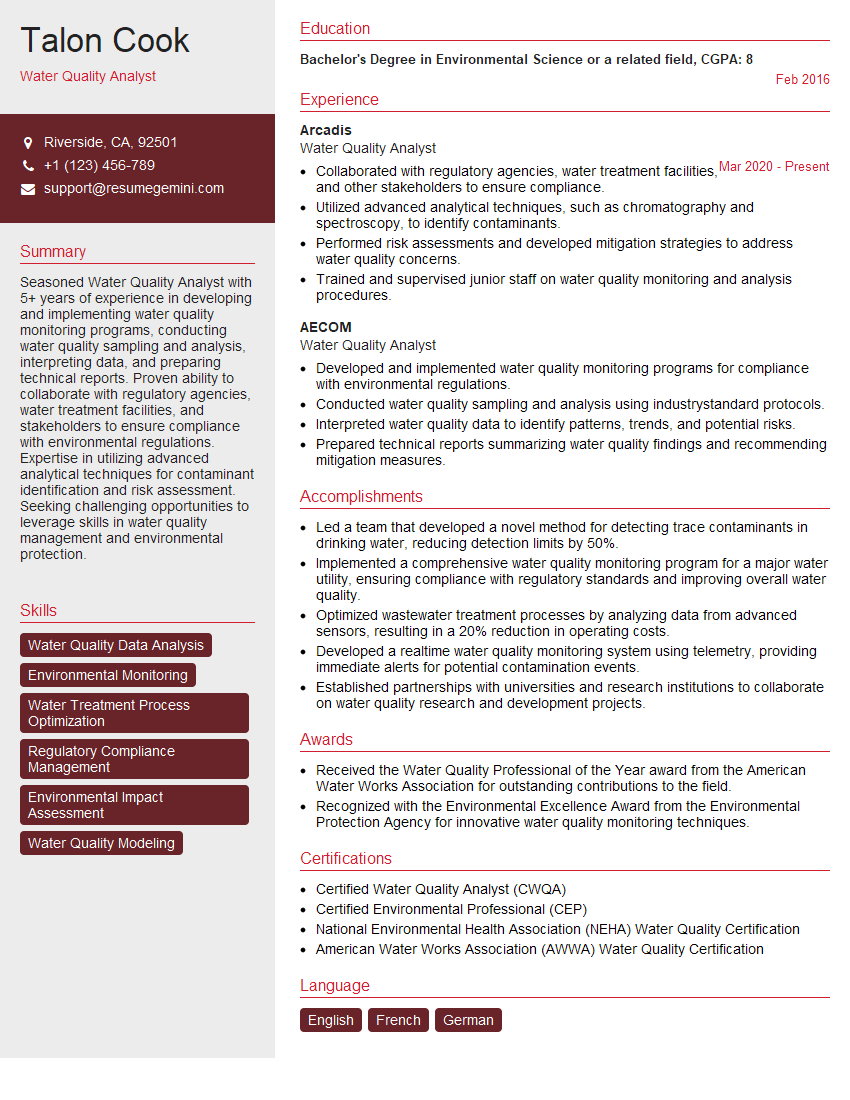
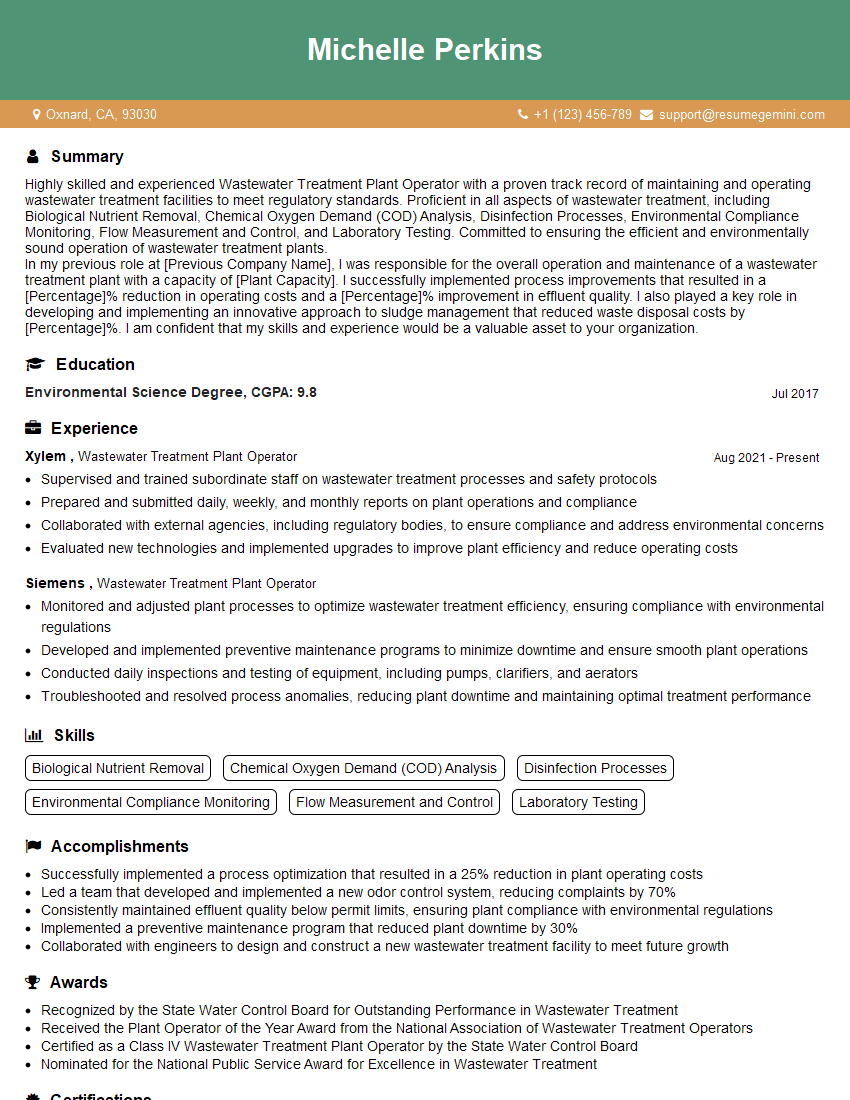
Mastering Water Quality Testing and Analysis opens doors to exciting career opportunities in environmental protection, public health, and research. To maximize your job prospects, it’s crucial to present your skills and experience effectively. An ATS-friendly resume is essential for getting your application noticed by recruiters and hiring managers. ResumeGemini is a trusted resource that can help you craft a professional and impactful resume tailored to the specific requirements of Water Quality Testing and Analysis positions. Examples of resumes optimized for this field are available to guide you. Invest time in building a strong resume – it’s your first impression and a key step towards securing your dream job.
Explore more articles
Users Rating of Our Blogs
Share Your Experience
We value your feedback! Please rate our content and share your thoughts (optional).
What Readers Say About Our Blog
Hi, I have something for you and recorded a quick Loom video to show the kind of value I can bring to you.
Even if we don’t work together, I’m confident you’ll take away something valuable and learn a few new ideas.
Here’s the link: https://bit.ly/loom-video-daniel
Would love your thoughts after watching!
– Daniel
This was kind of a unique content I found around the specialized skills. Very helpful questions and good detailed answers.
Very Helpful blog, thank you Interviewgemini team.
