Every successful interview starts with knowing what to expect. In this blog, we’ll take you through the top Weather Monitoring and Adaptation interview questions, breaking them down with expert tips to help you deliver impactful answers. Step into your next interview fully prepared and ready to succeed.
Questions Asked in Weather Monitoring and Adaptation Interview
Q 1. Explain the difference between weather and climate.
Weather and climate are often confused, but they represent different timescales and perspectives. Weather describes the short-term state of the atmosphere at a particular time and place. Think of it as the daily mood of the atmosphere – sunny, rainy, windy, etc. Climate, on the other hand, is the long-term average weather pattern of a region over many years, typically 30 years or more. It’s like the atmosphere’s personality – generally hot and dry, cold and snowy, or temperate and rainy. A single heatwave is weather; consistently increasing average temperatures over several decades is climate change.
For example, a sudden thunderstorm is a weather event. However, the average number of thunderstorms a region experiences per year over a 30-year period contributes to its climate.
Q 2. Describe the various types of weather data used in forecasting.
Weather forecasting relies on a multitude of data sources. Surface observations from weather stations provide crucial real-time information about temperature, humidity, wind speed and direction, precipitation, and atmospheric pressure. Upper-air data from weather balloons (radiosondes) and aircraft measure these parameters at different altitudes, providing a vertical profile of the atmosphere. Satellite imagery offers a broad perspective, capturing cloud cover, temperature variations, and even precipitation patterns across vast areas. Radar systems detect precipitation and its movement, providing crucial information for short-term forecasting of storms. Finally, ocean buoys and ships provide data on sea surface temperature and ocean currents, which significantly impact weather patterns, especially near coastal regions.
Q 3. How do you interpret weather maps and charts?
Interpreting weather maps and charts involves understanding the symbols and conventions used to represent atmospheric variables. Isobars (lines of equal pressure) reveal high- and low-pressure systems, which are vital in predicting wind and weather patterns. Isotherms (lines of equal temperature) illustrate temperature gradients, and fronts (boundaries between air masses of different temperatures and humidity) are crucial for predicting precipitation and temperature changes. Cloud cover is depicted using various symbols, indicating different cloud types and their potential for precipitation. Wind barbs show wind direction and speed. By analyzing the interplay of these elements, meteorologists can construct a coherent picture of the current and future weather conditions.
For instance, a tightly packed group of isobars indicates a strong pressure gradient, which often translates to strong winds. A cold front approaching a region, typically shown as a blue line with triangles, usually indicates an increase in the likelihood of precipitation and a temperature drop.
Q 4. What are the limitations of current weather forecasting models?
Current weather forecasting models, while impressively accurate, have limitations. The atmosphere is a chaotic system, meaning small initial uncertainties can lead to significant differences in the forecast over time – the ‘butterfly effect.’ The resolution of models is finite; they can’t capture all the minute details of atmospheric processes, such as small-scale convective storms. Representing complex interactions like the impact of topography, vegetation, and aerosols remains a challenge. Furthermore, data availability and quality can limit the accuracy of forecasts, especially in data-sparse regions. Finally, accurately predicting extreme weather events like hurricanes or severe thunderstorms remains a significant challenge because of the chaotic nature of the atmosphere and the complexity of the processes involved.
Q 5. Explain the concept of climate change and its impact on weather patterns.
Climate change refers to long-term shifts in temperatures and weather patterns. These shifts may be natural, but since the 1800s, human activities – primarily the burning of fossil fuels – have been the main driver. This releases greenhouse gases into the atmosphere, trapping heat and causing a warming effect. This warming trend has profound impacts on weather patterns. It leads to more frequent and intense heatwaves, changes in precipitation patterns (some areas experiencing more intense droughts while others face increased flooding), more powerful storms, and rising sea levels. The warming also affects the jet stream, potentially leading to more persistent and extreme weather events.
For example, the increased frequency and intensity of hurricanes are linked to warmer ocean temperatures, providing the energy for these storms to develop and intensify.
Q 6. Discuss the different types of climate models used in predicting future climate scenarios.
Climate models are complex computer programs that simulate the Earth’s climate system. Global Climate Models (GCMs) are the most comprehensive, representing the entire planet and various interacting components like the atmosphere, oceans, land surface, and ice. Regional Climate Models (RCMs) focus on smaller geographical areas and can offer higher resolution, providing more detail at the regional level. Earth System Models (ESMs) are the most advanced, incorporating even more components like the carbon cycle and the biosphere to provide a more holistic understanding of climate change. Each type uses different approaches to represent the complexities of the Earth’s climate system, but all rely on fundamental physical laws and observational data to project future climate scenarios based on various greenhouse gas emission scenarios.
Q 7. How do you assess the accuracy of a weather forecast?
Assessing the accuracy of a weather forecast involves comparing the predicted values with the observed values. Metrics like the mean absolute error (MAE) and root mean square error (RMSE) quantify the difference between the prediction and observation. Skill scores compare the forecast to a baseline forecast (e.g., climatology) to determine if the forecast adds value. Verification methods involve statistical analysis of forecast accuracy across different time scales and weather variables. However, a single metric doesn’t tell the whole story; a qualitative assessment that considers the context of the forecast (e.g., extreme weather events versus typical weather) is also crucial. Forecasts are also regularly evaluated through post-analysis and comparison with other forecasting models, contributing to ongoing improvement and refinement of the methodologies used.
Q 8. Describe your experience with different weather instruments and their applications.
My experience with weather instruments spans a wide range, from traditional tools to sophisticated modern technology. I’m proficient in using and maintaining instruments like:
- Thermometers and Hygrometers: These fundamental tools measure temperature and humidity, crucial for understanding atmospheric conditions and predicting dew point and potential for precipitation. For instance, I’ve used these extensively in microclimate studies, analyzing temperature variations across small geographical areas.
- Barometers: Measuring atmospheric pressure is key to forecasting short-term weather changes. Changes in barometric pressure often precede storms. I’ve relied on these in both field and lab settings, calibrating and comparing readings to ensure accuracy.
- Anemometers and Wind Vanes: These measure wind speed and direction, essential for understanding air mass movement and predicting storm tracks. In one project, I used anemometer data alongside satellite imagery to model wind patterns during a hurricane.
- Rain Gauges: These simple yet vital instruments quantify rainfall amounts, providing crucial data for hydrological models and flood prediction. I’ve used various types, including tipping bucket rain gauges for automated data collection.
- Automated Weather Stations: Modern weather stations combine multiple sensors into a single unit, providing comprehensive data sets. My expertise includes data acquisition, quality control, and the analysis of data from these automated systems. For example, I’ve worked with stations equipped with sensors for solar radiation, soil moisture, and evapotranspiration.
Understanding the strengths and limitations of each instrument is crucial for accurate data interpretation and reliable forecasting. Proper calibration and maintenance are equally vital to ensure data quality.
Q 9. Explain the process of data assimilation in weather forecasting.
Data assimilation is the process of combining observations from various sources with numerical weather prediction (NWP) models to produce a more accurate representation of the current atmospheric state. Think of it like solving a puzzle: you have a model (your initial guess at the solution), and then you add pieces of the puzzle (observations) to refine the solution. This process involves:
- Observations: This includes data from surface stations, weather balloons (radiosondes), satellites, radar, aircraft, and buoys. Each has its strengths and weaknesses regarding spatial and temporal coverage.
- Forecast Model: Numerical weather prediction models use complex equations to simulate atmospheric processes. These models provide a first guess at the atmospheric state.
- Analysis Scheme: This is the heart of data assimilation. It uses sophisticated algorithms (like Kalman filters or variational methods) to optimally blend the observations and the model forecast, weighting the data based on its reliability and error characteristics. The goal is to produce an analysis that minimizes errors.
- Forecast Update: The analysis then becomes the initial condition for the next forecast run, improving its accuracy.
This cyclical process continually refines the forecast, leveraging the strengths of both model simulations and real-world observations. The accuracy of weather forecasting dramatically improves through this iterative assimilation process.
Q 10. What are some common weather hazards and how are they monitored?
Weather hazards are numerous and their monitoring strategies vary widely. Some common hazards include:
- Hurricanes and Typhoons: Monitored using satellites (for track and intensity), radar (for precipitation and wind speed), and weather buoys (for ocean conditions). Early warning systems are vital for evacuation planning.
- Tornadoes: Detected by Doppler radar, which can identify the rotation within a thunderstorm. Spotter networks play a key role in confirming ground-level sightings and reporting damage.
- Floods: Monitored using rain gauges, river gauges, and hydrological models that predict river levels. Satellite imagery is used to assess the extent of flooding.
- Severe Thunderstorms: Monitored using radar to detect hail, heavy rain, and strong winds. Lightning detection networks provide real-time information on lightning strikes.
- Heat Waves: Monitored using surface temperature observations, coupled with human health data to track heat-related illnesses. Predictive models based on temperature and humidity forecasts are also used.
- Winter Storms (Blizzards, Ice Storms): Monitored using radar (for snowfall and ice accumulation), surface observations of temperature, wind speed, and precipitation type. Satellite imagery helps monitor the extent of snow cover.
The monitoring techniques are often combined for a comprehensive understanding of the hazard. Real-time data and advanced warning systems are critical for effective hazard mitigation and public safety.
Q 11. How do you communicate complex weather information to a non-technical audience?
Communicating complex weather information to a non-technical audience requires clear, concise language, avoiding jargon. I use several strategies:
- Analogies and relatable examples: Comparing wind speeds to familiar experiences (e.g., ‘winds strong enough to knock over a small tree’) helps people visualize the impact.
- Visual aids: Maps, charts, and infographics simplify complex data. For example, color-coded maps effectively communicate the severity of a storm.
- Focus on impact: Instead of focusing on technical details, I highlight the consequences of the weather event (e.g., potential for power outages, flooding, or travel disruptions).
- Plain language: Avoid technical terms whenever possible. If a term must be used, define it clearly.
- Layered communication: Providing information at different levels of detail caters to various levels of understanding. Begin with a simple summary, then provide more detail as needed.
Storytelling can also be effective, making the information more memorable and engaging. For instance, I might describe a recent weather event and its impact on a community to illustrate the importance of weather awareness.
Q 12. Describe your experience with GIS software in analyzing weather data.
My GIS (Geographic Information System) skills are integral to my work. I use various GIS software packages (e.g., ArcGIS, QGIS) to analyze and visualize weather data. This involves:
- Spatial analysis: Overlay weather data (e.g., rainfall, temperature) with geographical features (e.g., elevation, land use) to understand patterns and relationships. For example, I’ve used GIS to identify areas at high risk of flooding based on rainfall intensity and elevation data.
- Data visualization: Creating maps, charts, and other visuals that clearly communicate weather information. I’ve created interactive maps showing the real-time progression of a storm, allowing users to see the evolution of the event.
- Geostatistics: Using spatial statistical techniques to interpolate weather data, generating estimations for areas lacking direct observations. This is useful for filling gaps in data coverage.
- Data management: Organizing and managing large datasets of weather information efficiently within a GIS environment.
GIS is crucial for understanding the spatial context of weather events and developing targeted mitigation strategies. It allows for a more comprehensive and nuanced understanding of weather patterns than simply looking at numerical data alone.
Q 13. Explain your experience using remote sensing techniques in weather monitoring.
Remote sensing techniques are vital for large-scale weather monitoring. I have extensive experience using data from various platforms:
- Weather Satellites: Geostationary satellites provide continuous coverage of a specific region, while polar-orbiting satellites offer global coverage. I use data from these satellites to monitor cloud cover, temperature profiles, water vapor content, and precipitation. Examples include analyzing infrared imagery to estimate cloud top temperatures, providing insights into storm intensity.
- Radar: Weather radar uses electromagnetic waves to detect precipitation and wind speed. I analyze radar data to identify severe weather events like tornadoes and hailstorms. The use of Doppler radar is especially important for assessing wind shear and storm rotation.
- LiDAR (Light Detection and Ranging): LiDAR uses laser pulses to measure distances and create 3D models of terrain and vegetation. This is invaluable for understanding how topography influences local weather patterns, such as downslope winds.
Data from these sources is often combined with in-situ observations (data collected on the ground) for a more comprehensive understanding of weather phenomena. The combination of remote sensing data with other observations improves accuracy and allows for better prediction of extreme events.
Q 14. How do you identify and interpret weather anomalies?
Identifying and interpreting weather anomalies involves comparing observed weather patterns to historical data and established climatological norms. Anomalies can range from subtle shifts to extreme events. I use a multi-pronged approach:
- Statistical analysis: Using statistical methods (e.g., time series analysis, trend analysis) to identify deviations from the average. This helps to distinguish between natural variability and significant changes.
- Comparison with historical data: Analyzing current weather data against long-term records to determine if the current conditions are unusual. This context is essential for assessing the significance of an anomaly.
- Spatial analysis: Examining weather patterns across geographical regions to see if an anomaly is localized or widespread. GIS tools are particularly useful here.
- Climate modeling: Using climate models to determine whether an anomaly might be linked to larger climate patterns or trends (e.g., El Niño, La Niña, climate change). This adds an important context of understanding underlying causes.
- Physical understanding: Considering the physical processes that lead to specific weather patterns. Knowing the underlying mechanisms helps understand the causes of observed anomalies.
Once an anomaly is identified, its potential impacts need to be assessed. This may involve forecasting its future evolution and evaluating its potential social and economic effects. Understanding weather anomalies is crucial for effective adaptation strategies and climate resilience.
Q 15. Describe your experience in developing climate adaptation strategies.
Developing climate adaptation strategies involves a multi-step process focused on understanding vulnerabilities, identifying potential risks, and designing solutions to minimize negative impacts. My experience spans various sectors, from working with coastal communities to develop sea-level rise adaptation plans (involving infrastructure upgrades and early warning systems), to collaborating with agricultural communities on drought-resistant crop varieties and water management strategies. A key aspect is stakeholder engagement – understanding the unique needs and challenges faced by different groups is crucial for crafting effective and equitable solutions. For example, in one project, we worked closely with a fishing community to develop alternative livelihood options in response to changing ocean temperatures affecting their fish stocks. This involved researching new fishing techniques, exploring aquaculture possibilities, and providing training and financial support.
Career Expert Tips:
- Ace those interviews! Prepare effectively by reviewing the Top 50 Most Common Interview Questions on ResumeGemini.
- Navigate your job search with confidence! Explore a wide range of Career Tips on ResumeGemini. Learn about common challenges and recommendations to overcome them.
- Craft the perfect resume! Master the Art of Resume Writing with ResumeGemini’s guide. Showcase your unique qualifications and achievements effectively.
- Don’t miss out on holiday savings! Build your dream resume with ResumeGemini’s ATS optimized templates.
Q 16. How do you assess the vulnerability of a community to climate change impacts?
Assessing community vulnerability to climate change involves a holistic approach, combining quantitative and qualitative data. We typically use a framework that considers exposure (to climate hazards like floods or heatwaves), sensitivity (how susceptible the community is – for example, a community with limited access to healthcare is more sensitive to heat-related illnesses), and adaptive capacity (the community’s ability to cope and adapt). This might involve analyzing demographic data (age, income, health status), infrastructure assessments (flood defenses, access to clean water), and social factors (community cohesion, access to information and resources). We use participatory methods, involving community members directly in the assessment process, as their local knowledge is invaluable. For instance, in a recent study, we incorporated local elders’ observations of changing rainfall patterns to enhance the accuracy of our vulnerability map.
Q 17. Discuss your experience in developing climate resilience plans.
Developing climate resilience plans requires a long-term perspective and a strong focus on collaboration. My approach involves five key steps: 1) Risk Assessment – identifying potential hazards and vulnerabilities; 2) Goal Setting – defining specific, measurable, achievable, relevant, and time-bound (SMART) objectives; 3) Strategy Development – outlining concrete actions to reduce risks and enhance adaptive capacity; 4) Implementation Planning – establishing clear responsibilities, timelines, and budgets; and 5) Monitoring and Evaluation – tracking progress and adapting the plan as needed. One successful example was a resilience plan for a coastal city which included a combination of measures like mangrove restoration to reduce coastal erosion, improved drainage systems to manage flooding, and community-based early warning systems for storms. The plan’s effectiveness is continually monitored, allowing for adjustments based on real-world impacts.
Q 18. Explain the role of weather monitoring in disaster risk reduction.
Weather monitoring plays a critical role in disaster risk reduction by providing timely and accurate information about impending hazards. This allows for proactive measures, such as issuing early warnings for severe weather events like cyclones or floods, enabling timely evacuations and resource mobilization. Real-time data from weather stations, satellites, and radar systems allow us to track the development and movement of weather systems, providing vital information for emergency response teams. For instance, accurate rainfall forecasts can help predict potential flooding, enabling authorities to implement flood mitigation strategies and prepare shelters. Improved forecasting also supports the effective management of resources and helps to minimize economic losses.
Q 19. What are the key indicators used to assess climate change impacts?
Key indicators used to assess climate change impacts vary depending on the context, but common examples include changes in temperature and precipitation patterns, sea-level rise, glacier retreat, extreme weather event frequency and intensity (like droughts, floods, heatwaves), changes in vegetation patterns, and impacts on human health (e.g., heat-related mortality rates, vector-borne disease incidence). These indicators are often analyzed using time-series data, comparing historical trends with current observations. For example, increased frequency of extreme rainfall events can be a significant indicator of a changing climate, as can changes in the length and intensity of growing seasons affecting agricultural productivity.
Q 20. Describe your experience in working with climate change datasets.
My experience with climate change datasets involves working with large-scale spatial and temporal datasets from various sources including climate models (like CMIP6), satellite imagery (e.g., MODIS, Landsat), weather station data, and socioeconomic data. I have expertise in data processing, analysis, and visualization techniques, using software such as R, Python (with libraries like pandas, numpy, and xarray), and GIS software (ArcGIS). I’m proficient in handling various data formats, conducting statistical analyses to identify trends and correlations, and creating maps and visualizations to communicate findings effectively. For example, in a recent project, I used satellite imagery to assess the impact of deforestation on regional climate patterns, quantifying changes in land surface temperature and evapotranspiration.
Q 21. How do you evaluate the effectiveness of climate adaptation measures?
Evaluating the effectiveness of climate adaptation measures requires a combination of quantitative and qualitative methods. Quantitative methods might involve analyzing changes in specific indicators over time – for instance, comparing flood damage before and after the implementation of improved drainage systems. Qualitative methods involve assessing community perceptions and experiences – for example, conducting surveys and interviews to gather feedback on the effectiveness of early warning systems. It’s crucial to use a mixed-methods approach to gain a holistic understanding of the impacts. Furthermore, cost-benefit analyses can be performed to assess the economic efficiency of adaptation strategies. Regular monitoring and evaluation are essential to ensure that adaptation measures remain effective in the face of a changing climate and to allow for timely adjustments as needed.
Q 22. Discuss your experience in using statistical methods in analyzing weather data.
Statistical methods are fundamental to analyzing weather data, allowing us to identify patterns, make predictions, and understand climate variability. I’ve extensively used time series analysis techniques like ARIMA (Autoregressive Integrated Moving Average) modeling to forecast temperature and rainfall. For example, I used ARIMA to predict seasonal rainfall patterns in a drought-prone region, which informed water resource management strategies. Beyond ARIMA, I’ve employed regression analysis to explore the relationship between climate variables and agricultural yields, helping farmers make informed decisions about planting and harvesting. Furthermore, I’m proficient in spatial statistical methods like geostatistics (kriging) to interpolate weather data from scattered observation points across a region, creating more complete weather maps for improved analysis and forecasting. Principal Component Analysis (PCA) is another valuable tool I use to reduce the dimensionality of large weather datasets, identifying key modes of variability and simplifying complex patterns.
For instance, in a recent project analyzing historical temperature data, PCA revealed the dominant patterns of temperature variation across a continent, allowing us to better understand the influence of large-scale atmospheric circulation patterns on regional climate. These statistical techniques are crucial for extracting meaningful information from vast and often noisy weather data, supporting more accurate predictions and informed decision-making.
Q 23. Explain your understanding of climate feedback loops.
Climate feedback loops are processes where an initial change in one component of the climate system triggers a chain reaction, amplifying or dampening the initial change. These loops can be positive (amplifying) or negative (dampening).
Positive Feedback Loops: These enhance the initial change. A classic example is the ice-albedo feedback. As ice melts (due to warming), it exposes darker land or ocean surfaces, which absorb more solar radiation, leading to further warming and more ice melt. This creates a self-reinforcing cycle.
Negative Feedback Loops: These counteract the initial change, stabilizing the climate. For instance, increased atmospheric CO2 stimulates plant growth, which absorbs some of the CO2, mitigating the warming effect. However, the capacity of these negative feedback loops to offset the effects of positive feedback loops is uncertain and a key area of climate research.
Understanding these feedback loops is vital for accurate climate modeling and projections. Failing to properly incorporate them can lead to significant under- or overestimation of future climate change impacts.
Q 24. Describe your knowledge of different climate indices (e.g., El Niño-Southern Oscillation).
Climate indices are standardized measurements that summarize climate variability over specific regions or periods. The El Niño-Southern Oscillation (ENSO) is a prime example. ENSO refers to variations in sea surface temperatures (SSTs) in the central and eastern tropical Pacific Ocean. These SST anomalies influence atmospheric circulation patterns globally, leading to changes in rainfall, temperature, and extreme weather events worldwide.
El Niño: Characterized by warmer-than-average SSTs, often leading to increased rainfall in some regions and drought in others.
La Niña: Characterized by cooler-than-average SSTs, producing opposite effects compared to El Niño.
Other important indices include the North Atlantic Oscillation (NAO), Pacific Decadal Oscillation (PDO), and Arctic Oscillation (AO), each reflecting significant climate patterns and influencing weather systems across vast areas. These indices are essential for seasonal forecasting and understanding long-term climate trends. My work involves analyzing these indices to better understand their relationship with regional climate variability and extreme weather events. This aids in developing improved early warning systems for droughts, floods, and heatwaves.
Q 25. How do you incorporate uncertainty into climate change projections?
Incorporating uncertainty into climate change projections is crucial for producing reliable and informative forecasts. Uncertainty arises from various sources, including:
Incomplete Understanding of Climate Processes: We still have gaps in our knowledge regarding the interactions of different components of the Earth’s climate system.
Limitations in Climate Models: Climate models are complex representations of reality and involve simplifications and approximations.
Uncertainty in Future Emissions: Future greenhouse gas emissions depend on various socio-economic factors, which are difficult to predict with certainty.
We address uncertainty through ensemble forecasting, running multiple climate model simulations with varying initial conditions and parameter settings. This generates a range of possible future climate outcomes, quantifying the uncertainty associated with each projection. Probability distributions are used to represent the likelihood of different climate scenarios. Furthermore, sensitivity analyses are conducted to assess the influence of uncertain parameters on the overall results. Communicating this uncertainty effectively to stakeholders is critical for informed decision-making. Instead of presenting single point projections, we offer a range of plausible scenarios, highlighting the associated probabilities and risks. This helps users make more robust and adaptive plans.
Q 26. What are some ethical considerations related to climate change communication?
Ethical considerations in climate change communication are paramount. Transparency, accuracy, and avoidance of misinformation are key.
Transparency: Openly acknowledging uncertainties and limitations in our knowledge is essential to build trust with the public.
Accuracy: Presenting information in a clear, concise, and unbiased manner, avoiding exaggeration or sensationalism is crucial.
Avoiding Misinformation: Actively combating the spread of misinformation and disinformation is critical to inform effective policy decisions and public action.
Equity and Justice: Communicating the disproportionate impacts of climate change on vulnerable populations, ensuring equitable access to information and resources.
Actionable Information: Providing practical information and solutions, empowering individuals and communities to take meaningful action.
For example, I would avoid using overly alarming language that might lead to despair or inaction. Instead, I would focus on presenting evidence-based solutions and empowering individuals and communities to become actively involved in mitigating and adapting to climate change. I also prioritize communicating the information in a way that is accessible and understandable to diverse audiences.
Q 27. Discuss your experience collaborating with interdisciplinary teams on climate projects.
I have extensive experience collaborating with interdisciplinary teams on climate projects. This typically involves working with hydrologists, ecologists, sociologists, economists, and policymakers. For example, in a recent project assessing the vulnerability of coastal communities to sea-level rise, our team, composed of climate scientists, coastal engineers, and social scientists, used climate projections to model future flooding scenarios. The social scientists conducted surveys to gauge community preparedness and identify vulnerable populations. The engineers then used this data to design coastal protection measures. This collaborative approach is essential because climate change impacts are complex and require multifaceted solutions. Effective communication and mutual respect are key to successful interdisciplinary collaboration. I facilitate these aspects through regular team meetings, clear communication of individual responsibilities, and a shared understanding of project goals.
Q 28. Describe a situation where you had to make a critical decision based on incomplete weather data.
During a severe winter storm, we experienced a critical failure in our primary weather radar system. We had incomplete data covering a large area, making accurate storm tracking and prediction challenging. This impacted our ability to issue timely and accurate warnings to the public and local emergency services.
To address this, we utilized available data from neighboring radar stations and weather satellites to fill in the gaps, combining this with surface observations from weather stations and citizen reports. We implemented a data fusion approach, using statistical methods to integrate diverse data sources and minimize errors. We then created a probabilistic forecast, highlighting the areas of greatest uncertainty in our predictions and emphasized the possibility of rapid storm intensification. Although the decision-making process was hampered by the data limitations, our approach prioritized public safety. Post-event analysis helped refine our protocols for handling such situations, including improving our backup systems and developing more robust data fusion algorithms.
Key Topics to Learn for Weather Monitoring and Adaptation Interview
- Weather Data Acquisition and Processing: Understanding various data sources (satellites, radar, surface stations), data formats, and techniques for quality control and preprocessing. Consider exploring specific data analysis software and tools you’re familiar with.
- Meteorological Modeling and Forecasting: Familiarize yourself with different types of weather models (numerical weather prediction, statistical models), their limitations, and applications in forecasting various weather phenomena. Be prepared to discuss model evaluation metrics and uncertainties.
- Climate Change Impacts and Adaptation Strategies: Explore the effects of climate change on various sectors (agriculture, infrastructure, water resources), and the development and implementation of adaptation strategies to mitigate risks. This includes understanding vulnerability assessments and resilience planning.
- Extreme Weather Events and Risk Management: Gain a strong understanding of the characteristics, prediction challenges, and societal impacts of extreme weather events (hurricanes, floods, droughts). Prepare to discuss risk assessment methodologies and disaster preparedness strategies.
- Data Visualization and Communication: Develop your ability to effectively communicate complex weather information to diverse audiences using maps, charts, and other visual aids. Practice explaining technical concepts in a clear and concise manner.
- Technological Advancements in Weather Monitoring: Stay updated on the latest technologies used in weather monitoring (e.g., AI, machine learning, remote sensing) and their impact on forecasting accuracy and efficiency. Be ready to discuss their potential benefits and limitations.
Next Steps
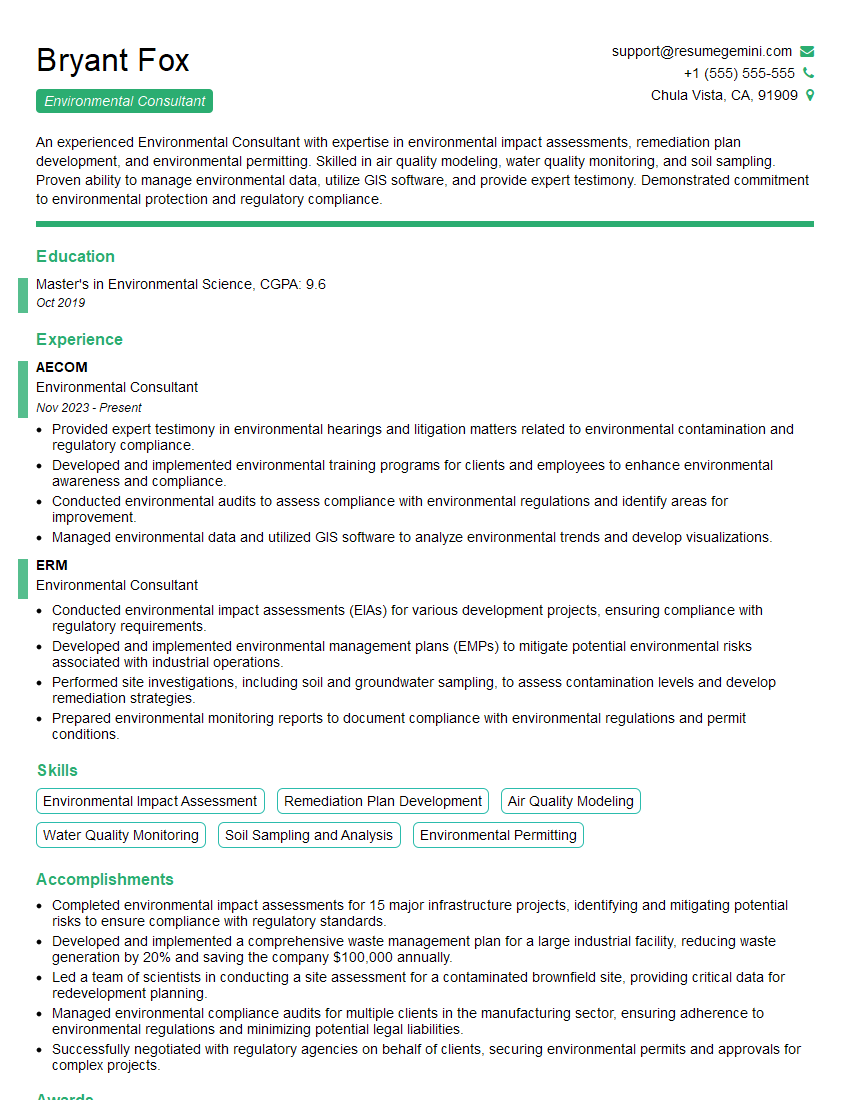
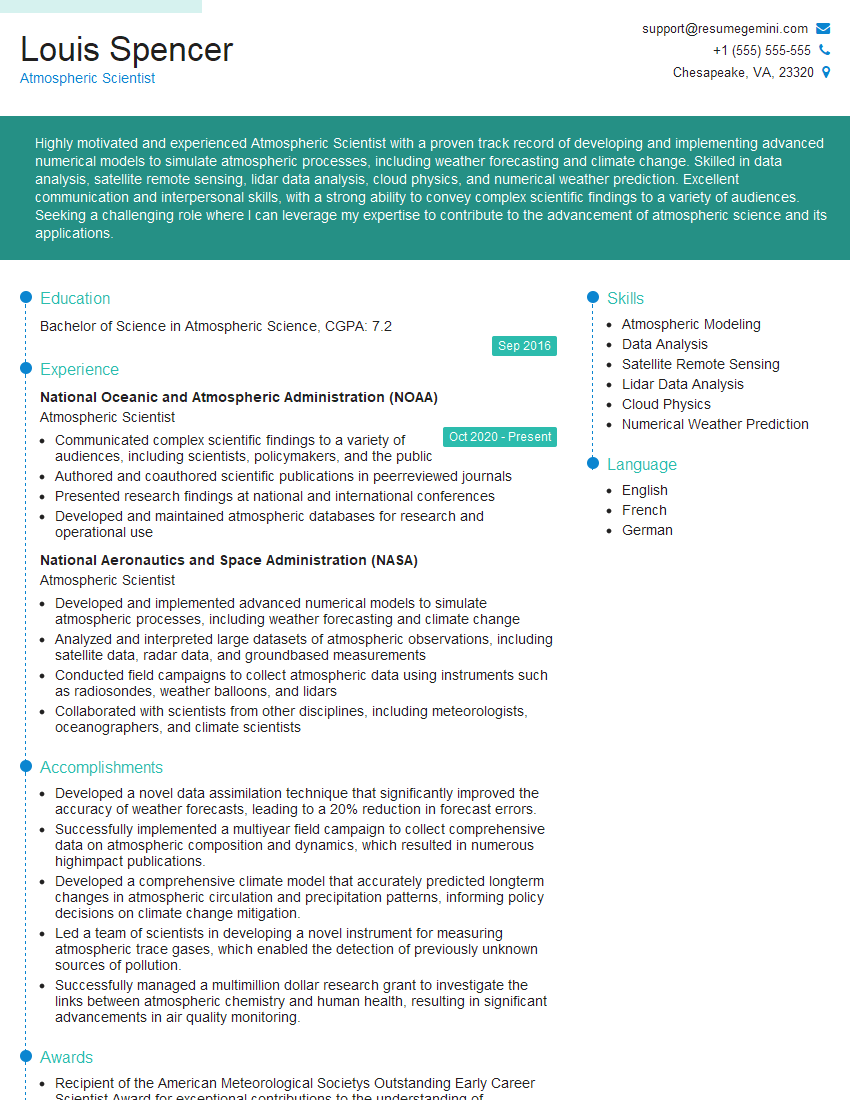
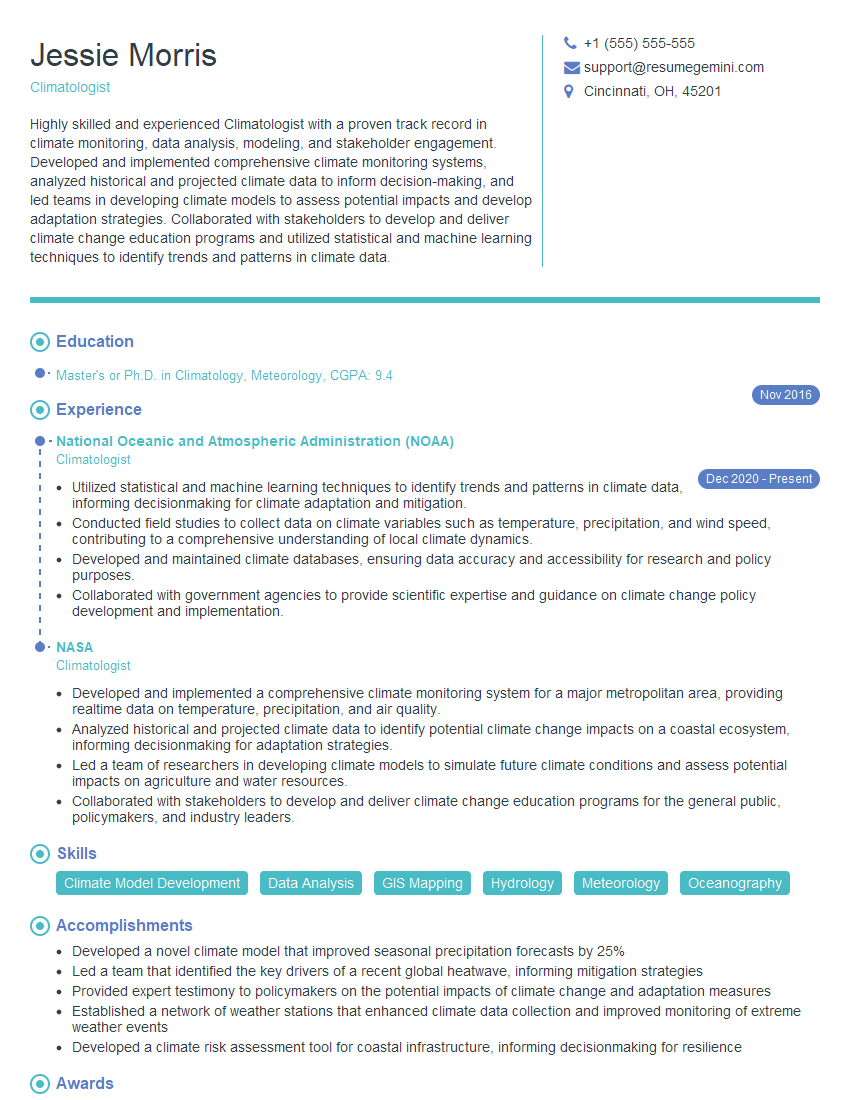
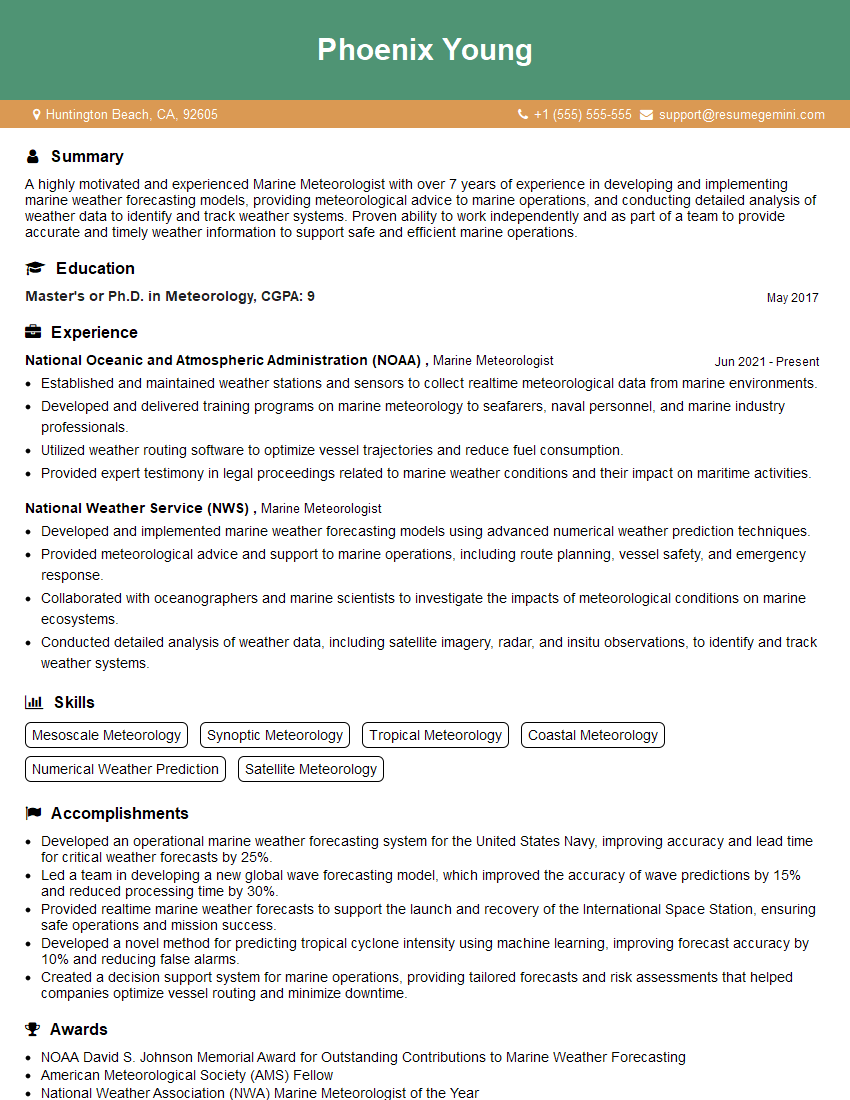
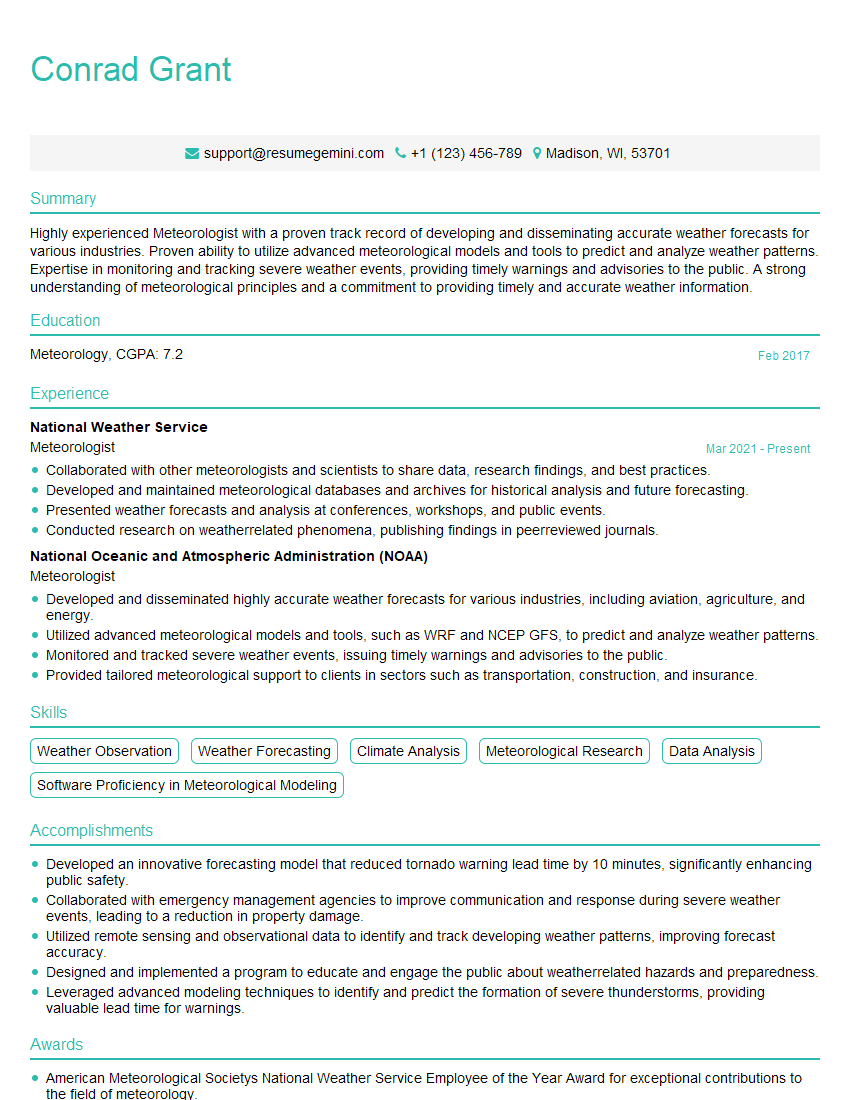
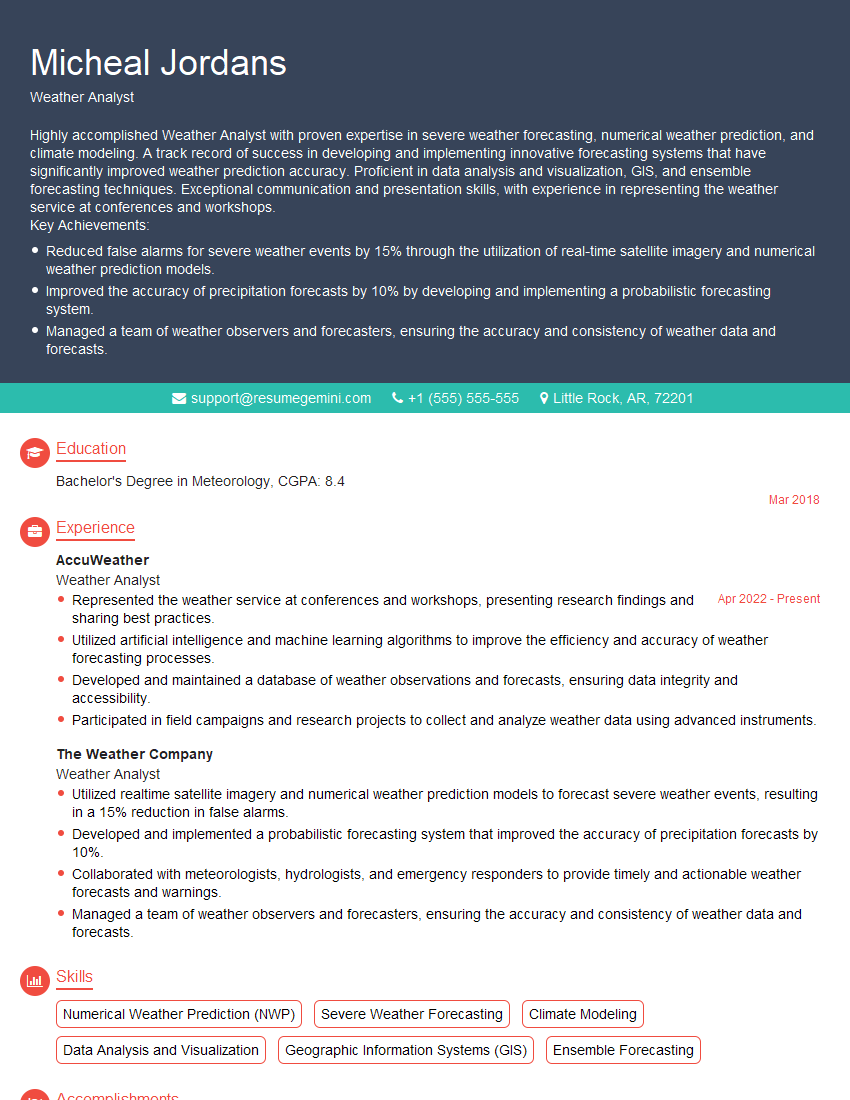
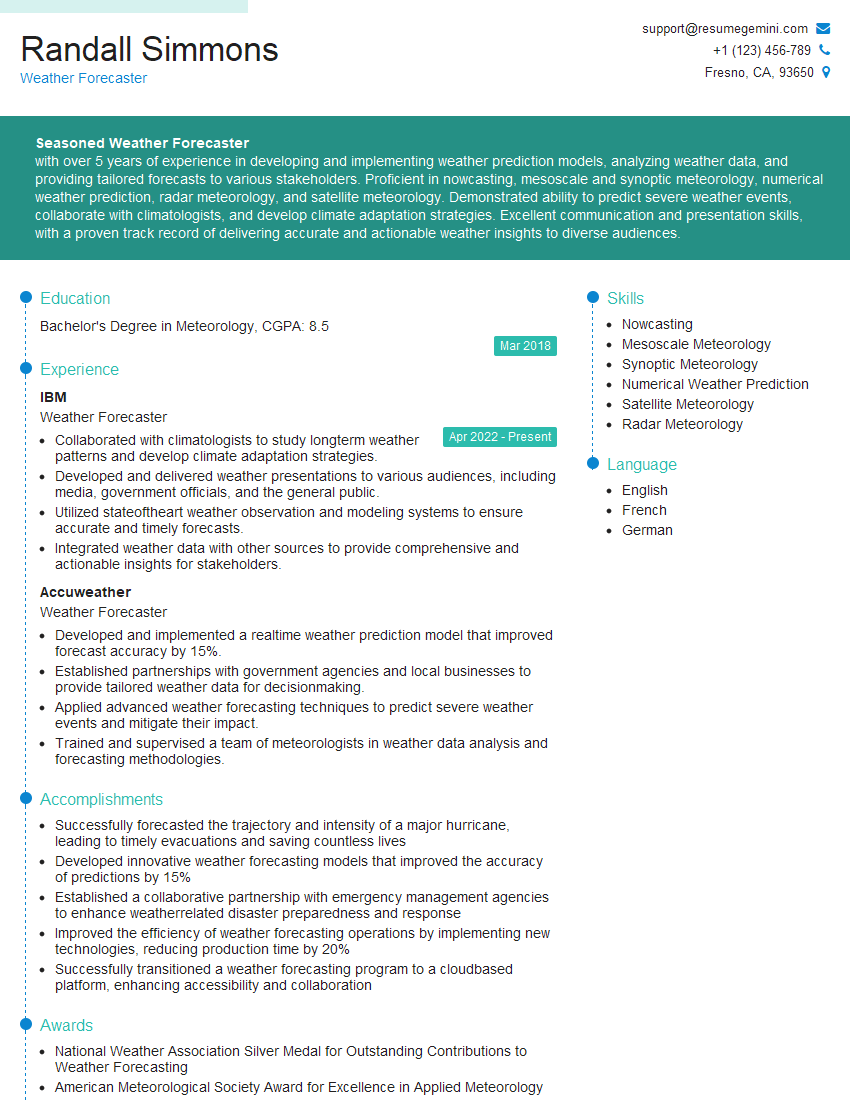
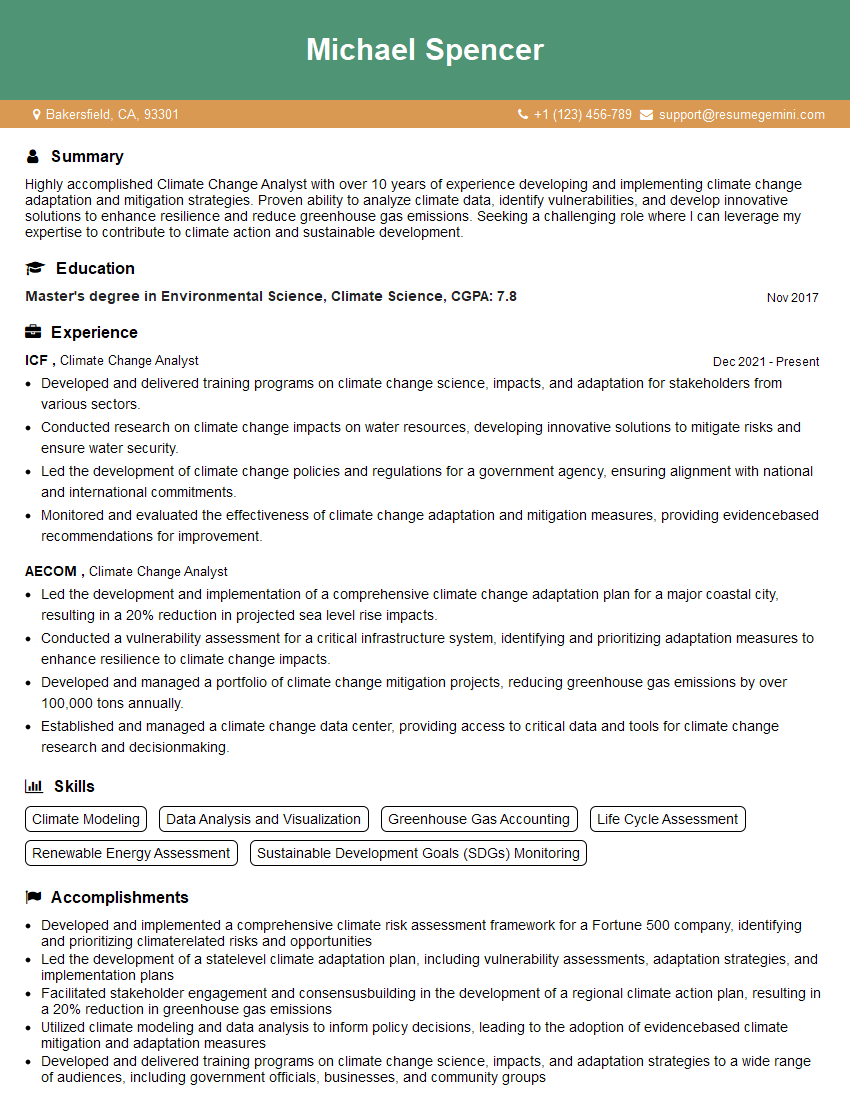
Mastering Weather Monitoring and Adaptation is crucial for a thriving career in a field increasingly vital to our world. The ability to analyze data, predict weather patterns, and develop effective adaptation strategies is highly sought after. To significantly boost your job prospects, creating a strong, ATS-friendly resume is essential. ResumeGemini is a trusted resource to help you craft a professional and impactful resume that highlights your skills and experience effectively. We provide examples of resumes tailored to Weather Monitoring and Adaptation to guide you in creating your own compelling application.
Explore more articles
Users Rating of Our Blogs
Share Your Experience
We value your feedback! Please rate our content and share your thoughts (optional).
What Readers Say About Our Blog
This was kind of a unique content I found around the specialized skills. Very helpful questions and good detailed answers.
Very Helpful blog, thank you Interviewgemini team.
