Interviews are opportunities to demonstrate your expertise, and this guide is here to help you shine. Explore the essential Unsupervised Learning for Remote Sensing interview questions that employers frequently ask, paired with strategies for crafting responses that set you apart from the competition.
Questions Asked in Unsupervised Learning for Remote Sensing Interview
Q 1. Explain the difference between supervised and unsupervised learning in the context of remote sensing.
The core difference between supervised and unsupervised learning lies in the availability of labeled data. In supervised learning, we have a dataset where each data point is tagged with a known class or label. Think of it like having a teacher who provides the correct answers. We use this labeled data to train a model to predict the labels of new, unseen data. For example, in remote sensing, we might have labeled satellite imagery where each pixel is labeled as ‘forest,’ ‘water,’ or ‘urban.’ The algorithm learns to map image features to these predefined classes.
Unsupervised learning, on the other hand, deals with unlabeled data. We don’t have pre-defined classes; instead, the algorithm explores the data to identify patterns, structures, and relationships on its own. It’s like giving a detective a crime scene and asking them to piece together what happened without knowing the perpetrator beforehand. In remote sensing, we might use unsupervised learning to discover distinct land cover types within a satellite image without prior knowledge of what those types might be.
Q 2. Describe various unsupervised learning techniques applicable to remote sensing data.
Several unsupervised learning techniques are highly applicable to remote sensing data. Some of the most common include:
- Clustering: This involves grouping similar data points together. Popular clustering algorithms used in remote sensing include k-means, hierarchical clustering, and DBSCAN. These are used to classify land cover, identify similar spectral signatures, or group objects in imagery.
- Dimensionality Reduction: Techniques like Principal Component Analysis (PCA) and t-distributed Stochastic Neighbor Embedding (t-SNE) reduce the number of variables while preserving important information. This simplifies the data, making it easier to analyze and visualize, and reduces computational costs. In remote sensing, this helps in dealing with the high dimensionality of hyperspectral data.
- Anomaly Detection: This focuses on identifying unusual or unexpected data points. Algorithms like Isolation Forest or One-Class SVM can be applied to detect changes in land use, identify unusual vegetation patterns, or locate damaged infrastructure in satellite imagery.
- Self-Organizing Maps (SOM): SOMs create a low-dimensional representation of the high-dimensional data, often used for visualization and to reveal clusters in complex datasets. This is helpful for exploring the relationships between different spectral bands in remote sensing.
Q 3. How would you apply k-means clustering to classify land cover types in a satellite image?
Applying k-means clustering to classify land cover in a satellite image involves these steps:
- Data Preprocessing: This includes atmospheric correction, geometric correction, and potentially band selection or transformation to improve the quality and relevance of the data for clustering.
- Feature Selection: Determine which spectral bands (or derived features) will be used as input for the k-means algorithm. The choice depends on the specific land cover types and the spectral characteristics that differentiate them.
- Specify k (number of clusters): Determine the number of land cover classes to be identified. This is a crucial parameter and can be chosen based on prior knowledge or using techniques like the elbow method.
- Apply k-means: Run the k-means algorithm on the selected features. The algorithm will iteratively assign each pixel to the nearest cluster center (centroid) based on the Euclidean distance in feature space.
- Evaluate and Refine: Assess the results by visualizing the clustered image and evaluating the homogeneity of clusters. You might need to adjust the value of k or re-process the data.
- Interpretation and Labeling: Once satisfied with the clustering, examine the spectral characteristics of each cluster to assign meaningful land cover labels (e.g., urban, forest, water).
Example Code (Conceptual Python using scikit-learn):
from sklearn.cluster import KMeans
kmeans = KMeans(n_clusters=k)
kmeans.fit(image_data)
labels = kmeans.labels_
Note: image_data represents the preprocessed satellite image data as a NumPy array. The code snippet only provides a high-level illustration. Real-world implementation will necessitate careful data handling and potentially advanced techniques.
Q 4. Explain the concept of dimensionality reduction and its benefits in remote sensing image analysis.
Dimensionality reduction is a technique used to reduce the number of variables (features, dimensions) in a dataset while preserving as much important information as possible. Remote sensing data, especially hyperspectral imagery, often contains a large number of spectral bands. This high dimensionality can lead to increased computational complexity, noise, and redundancy in analysis. Dimensionality reduction addresses these issues.
Benefits in remote sensing:
- Reduced computational cost: Processing and analyzing fewer variables reduces processing time and memory requirements.
- Improved visualization: Reduced dimensionality facilitates data visualization, allowing for easier interpretation of patterns and relationships.
- Noise reduction: Dimensionality reduction can help eliminate irrelevant information and noise, leading to more accurate analysis.
- Enhanced classification accuracy: By focusing on the most informative features, classification algorithms can achieve better performance.
- Feature extraction: Dimensionality reduction can uncover latent features that are not directly observable in the original data but are important for classification or other tasks.
Q 5. What are Principal Component Analysis (PCA) and its applications in remote sensing?
Principal Component Analysis (PCA) is a widely used dimensionality reduction technique. It transforms a set of correlated variables into a new set of uncorrelated variables called principal components. The first principal component captures the maximum variance in the data, the second captures the maximum remaining variance, and so on. This allows us to select a smaller subset of principal components that explain a large portion of the total variance, effectively reducing the dimensionality.
Applications in remote sensing:
- Data compression: Reducing the size of hyperspectral data for storage and transmission.
- Noise reduction: Filtering out noise by discarding principal components with low variance.
- Feature extraction: Using principal components as new features for classification or other downstream analysis.
- Band selection: Selecting the most important spectral bands based on their contribution to the principal components.
- Visualization: Projecting high-dimensional data onto lower-dimensional spaces for easier visualization and interpretation.
Q 6. Discuss the advantages and disadvantages of using PCA for remote sensing data.
Advantages of PCA in remote sensing:
- Effective dimensionality reduction: It captures most of the variance in the data using fewer components.
- Computational efficiency: Processing fewer components speeds up analysis.
- Improved classification accuracy: In some cases, using principal components as features leads to better classification performance.
- Noise reduction: Less important components often contain mostly noise.
Disadvantages of PCA in remote sensing:
- Loss of interpretability: Principal components are linear combinations of the original variables, making them harder to interpret physically.
- Assumption of linearity: PCA assumes linear relationships between variables; if the relationships are non-linear, PCA might not be the best choice.
- Sensitivity to scaling: The results can be sensitive to the scaling of the input variables, necessitating data standardization.
- Not optimal for all data types: PCA might not be the best approach for all types of remote sensing data.
Q 7. How do you handle outliers in unsupervised learning for remote sensing data?
Outliers in unsupervised learning for remote sensing can significantly affect the results, especially clustering algorithms. They can distort cluster shapes and misrepresent the true underlying data structure. Several strategies can be employed to handle outliers:
- Robust Clustering Algorithms: Use clustering algorithms that are less sensitive to outliers, such as DBSCAN (Density-Based Spatial Clustering of Applications with Noise), which is better at identifying clusters of arbitrary shapes and handling noise.
- Outlier Detection before Clustering: Before applying clustering, use outlier detection methods like Isolation Forest or Local Outlier Factor (LOF) to identify and remove or down-weight outliers. These methods can identify data points that deviate significantly from their neighbors.
- Data Preprocessing: Careful data preprocessing can help mitigate the impact of outliers. Techniques like robust standardization (using median and median absolute deviation instead of mean and standard deviation) reduce the influence of extreme values.
- Iterative Approaches: Some approaches iteratively remove or down-weight outliers and re-run the clustering algorithm until a stable solution is obtained.
- Visualization: Visual inspection of the data (e.g., scatter plots) can help identify potential outliers before applying any algorithm. Careful examination of the clusters after clustering can also reveal the impact of outliers.
The best approach depends on the characteristics of the data and the specific unsupervised learning algorithm used. Often, a combination of these techniques proves most effective.
Q 8. What are the challenges in applying unsupervised learning to hyperspectral imagery?
Applying unsupervised learning to hyperspectral imagery presents unique challenges stemming from its high dimensionality and the inherent complexity of the data. The sheer number of spectral bands leads to the curse of dimensionality, making computations slower and increasing the risk of overfitting. This high dimensionality also makes it harder to visualize the data and understand the underlying patterns. Another challenge is the high spectral correlation between bands, meaning that much of the information is redundant. This redundancy increases computational load and can obscure subtle variations important for classification. Furthermore, mixed pixels, where a single pixel represents multiple materials, are common in hyperspectral data, requiring specialized techniques to handle. Finally, the lack of labeled data, which is the defining characteristic of unsupervised learning, necessitates robust evaluation methods to ensure the quality and meaningfulness of the obtained results.
Q 9. Explain different distance metrics used in clustering algorithms for remote sensing data (e.g., Euclidean, Manhattan).
Clustering algorithms rely on distance metrics to quantify the similarity between data points. In remote sensing, common choices include:
- Euclidean Distance: This is the most straightforward measure, calculating the straight-line distance between two points in n-dimensional space. It’s sensitive to outliers and assumes features are equally important. Imagine two cities on a map; the Euclidean distance is the ‘as the crow flies’ distance. Formula:
√∑(xi - yi)² - Manhattan Distance (or L1 distance): This metric calculates the sum of absolute differences between coordinates. It’s less sensitive to outliers than Euclidean distance. Think of navigating a city grid – the Manhattan distance is the total distance traveled along the streets. Formula:
∑|xi - yi| - Mahalanobis Distance: This accounts for the correlation between features, making it suitable for hyperspectral data with correlated bands. It’s less sensitive to differences in scale and variability among features. It’s like comparing apples to apples, even if they are different sizes or colors.
- Cosine Similarity: Measures the angle between two vectors, focusing on the direction rather than the magnitude. Useful when the magnitude of the spectral values is less important than their relative proportions. It’s like comparing the similarity in the shape of two objects regardless of their size.
The choice of distance metric depends on the specific dataset and the characteristics of the features. For example, if the features are highly correlated, Mahalanobis distance is preferred. If the scale of different features varies greatly, Manhattan distance might be more robust.
Q 10. How do you evaluate the performance of a clustering algorithm in remote sensing?
Evaluating clustering performance in remote sensing is crucial, but challenging due to the lack of ground truth labels. Instead, we rely on internal and external validation methods. Internal validation assesses the clustering structure itself, without external reference data. External validation compares the clustering results to a reference dataset (if available, perhaps from field surveys). Internal methods are usually more common in purely unsupervised applications. A good approach often combines several metrics to get a comprehensive picture of the performance.
Internal validation techniques look at properties like the compactness of clusters (how close points are within a cluster) and the separation between clusters (how far apart clusters are). External validation might involve comparing to a labeled dataset using metrics like accuracy, precision, and recall (if such a ground truth is available). Visual inspection of the clustered data using maps and spectral plots is also a very useful qualitative assessment tool.
Q 11. What are some common metrics used to assess clustering performance (e.g., Silhouette score, Davies-Bouldin index)?
Several common metrics quantify clustering performance:
- Silhouette Score: Measures how similar a data point is to its own cluster compared to other clusters. A score closer to 1 indicates better clustering. Think of it as a measure of how confident each point is in its assigned cluster.
- Davies-Bouldin Index: Measures the average similarity between each cluster and its most similar cluster. Lower values indicate better clustering – implying clusters are well-separated and internally cohesive.
- Calinski-Harabasz Index (Variance Ratio Criterion): This metric compares the between-cluster dispersion to the within-cluster dispersion. A higher value suggests better-separated clusters.
- Dunn Index: Measures the ratio of the minimum inter-cluster distance to the maximum intra-cluster distance. A higher value indicates better clustering, with well-separated and compact clusters.
These metrics provide a quantitative assessment of the clustering results, but they shouldn’t be used in isolation. Visual inspection and domain knowledge are essential to interpret the results meaningfully.
Q 12. Describe the process of feature engineering for unsupervised learning in remote sensing.
Feature engineering is a critical step in improving the performance of unsupervised learning algorithms on remote sensing data. It involves creating new features from existing ones to enhance the algorithm’s ability to discover meaningful patterns. This is particularly important for hyperspectral data because of its high dimensionality and often redundant information.
Techniques include:
- Band Selection: Identifying and selecting the most informative spectral bands, reducing dimensionality and computational load. Methods like principal component analysis (PCA) are often used here.
- Band Ratios: Creating new features by calculating ratios between different spectral bands. These ratios can highlight subtle differences in material properties that are not apparent in individual bands. For example, the Normalized Difference Vegetation Index (NDVI) is a widely used band ratio.
- Transformations: Applying mathematical transformations to the data, such as logarithmic or power transformations, to improve data distribution and algorithm performance.
- Texture Features: Extracting texture information from the images, capturing spatial patterns that are valuable for classification. Methods like gray-level co-occurrence matrices (GLCM) can be used.
Careful feature engineering can significantly improve the accuracy and interpretability of unsupervised clustering results.
Q 13. How would you preprocess remote sensing data before applying unsupervised learning techniques?
Preprocessing remote sensing data is essential before applying unsupervised learning techniques. The goal is to improve data quality, reduce noise, and prepare the data for algorithm use.
Common preprocessing steps include:
- Atmospheric Correction: Removing the effects of the atmosphere on the spectral signals, ensuring that variations reflect ground features rather than atmospheric conditions.
- Geometric Correction: Correcting for geometric distortions in the imagery, aligning it to a known coordinate system. This ensures that features are spatially aligned and prevents errors in analysis.
- Radiometric Calibration: Converting digital numbers (DN) to physically meaningful units (e.g., radiance or reflectance), making the data comparable across different sensors and images.
- Noise Reduction: Filtering out noise from the data using techniques like smoothing filters or wavelet denoising. This minimizes the influence of random variations on the analysis.
- Data Normalization: Scaling the data to a specific range, such as 0-1, to ensure that features are weighted equally and to prevent the algorithm from being dominated by features with larger scales.
Careful preprocessing is crucial for obtaining meaningful and accurate results from unsupervised learning techniques. The specific preprocessing steps depend on the characteristics of the data and the chosen algorithms.
Q 14. Explain the concept of anomaly detection in remote sensing and how unsupervised learning can be used.
Anomaly detection in remote sensing involves identifying unusual or unexpected patterns in imagery that deviate significantly from the norm. These anomalies could represent interesting phenomena, such as illegal deforestation, oil spills, or changes in land cover. Unsupervised learning plays a vital role in this process because it can identify anomalies without relying on labeled examples of anomalies.
Unsupervised anomaly detection techniques often leverage clustering or density-based methods. Clustering algorithms can identify outliers as points that do not belong to any significant cluster. Density-based methods identify areas with lower density than the surrounding areas, indicating anomalies. For example, One-Class SVM and Isolation Forest are popular choices for this task. These methods are well suited to anomaly detection in high dimensional spaces, like those generated by hyperspectral data. In practice, visualization and domain expertise are critical for validating the detected anomalies and interpreting their significance within the context of the data.
Q 15. How would you use DBSCAN for detecting urban areas in a satellite image?
DBSCAN, or Density-Based Spatial Clustering of Applications with Noise, is a powerful unsupervised learning algorithm ideal for identifying clusters of high density in data, even those with complex shapes. In the context of satellite imagery, this makes it perfectly suited for detecting urban areas, which are characterized by densely packed buildings and infrastructure.
Here’s how you’d apply it:
- Preprocessing: First, you’d need to preprocess your satellite image. This might involve converting it to a suitable feature space. For example, you could use Normalized Difference Vegetation Index (NDVI) and Normalized Difference Built-Up Index (NDBI) as features. High NDBI values and low NDVI values generally indicate built-up areas.
- Parameter Selection: DBSCAN requires two key parameters:
eps(radius) andmin_samples(minimum points within the radius to form a cluster). Choosing appropriate values is crucial. A smallerepswill lead to more clusters, while a largerepsmight merge distinct clusters.min_samplescontrols the density threshold; a higher value requires denser clusters. - Clustering: Apply the DBSCAN algorithm to your feature data. The algorithm will identify clusters of data points that are densely packed together based on the defined
epsandmin_samples. - Post-processing: The output will be a set of clusters, each representing a potential urban area. You might need to perform post-processing steps, like removing small or isolated clusters (noise), to refine the results. This could involve setting a minimum cluster size based on area or number of pixels.
Think of it like this: imagine dropping a ball of yarn onto a table. DBSCAN would identify each clump of yarn as a separate cluster, even if they aren’t perfectly spherical. Similarly, it can effectively identify urban areas even if their shapes are irregular.
Career Expert Tips:
- Ace those interviews! Prepare effectively by reviewing the Top 50 Most Common Interview Questions on ResumeGemini.
- Navigate your job search with confidence! Explore a wide range of Career Tips on ResumeGemini. Learn about common challenges and recommendations to overcome them.
- Craft the perfect resume! Master the Art of Resume Writing with ResumeGemini’s guide. Showcase your unique qualifications and achievements effectively.
- Don’t miss out on holiday savings! Build your dream resume with ResumeGemini’s ATS optimized templates.
Q 16. What are the limitations of using unsupervised learning in remote sensing?
Unsupervised learning in remote sensing offers significant advantages, but it also has limitations. The biggest challenge is the lack of ground truth. Unlike supervised learning, we don’t have labelled data to evaluate the accuracy of our clustering or other models. This makes evaluating the quality and meaning of the discovered patterns difficult.
Other limitations include:
- Sensitivity to parameter choices: Many unsupervised algorithms have parameters that greatly influence the results. Finding optimal parameters often requires extensive experimentation and domain expertise. For instance, the
kin k-means clustering directly affects the number of clusters found. - Interpretability: The clusters or patterns discovered might not always have a clear or easily interpretable meaning. Further investigation and validation are needed to understand their significance.
- High dimensionality: Remote sensing data often has high dimensionality (many spectral bands). This can make clustering more challenging and computationally expensive. Dimensionality reduction techniques are often necessary.
- Computational cost: Some unsupervised algorithms, especially those dealing with large datasets, can be computationally expensive and require significant processing power.
For example, if we use k-means to cluster satellite imagery, the choice of ‘k’ (number of clusters) directly impacts the results. An incorrect ‘k’ could lead to meaningless or inaccurate clusters. Interpreting the meaning of these clusters requires careful analysis and domain knowledge.
Q 17. Discuss the use of self-organizing maps (SOM) in remote sensing applications.
Self-Organizing Maps (SOMs) are powerful unsupervised neural networks that create a low-dimensional representation of high-dimensional data while preserving the topological relationships. In remote sensing, this allows for visualizing and analyzing complex data in a more manageable way.
Applications include:
- Data visualization: SOMs can effectively visualize high-dimensional spectral data from hyperspectral imagery, reducing the complexity and allowing for easier identification of spectral signatures.
- Feature extraction: The nodes in a SOM can act as representatives of distinct spectral classes or land cover types. This can help extract meaningful features from the data.
- Anomaly detection: Unusual data points, representing anomalies like deforestation or oil spills, tend to fall outside the main clusters in a SOM, making them easily identifiable.
- Classification: While primarily an unsupervised method, SOMs can be used as a pre-processing step for supervised classification. The SOM’s output can provide initial groupings that can then be used to train a supervised classifier.
Imagine a large city map compressed onto a smaller grid. Each grid cell represents a cluster of similar locations. Similarly, an SOM compresses high-dimensional remote sensing data, preserving the spatial relationships between data points and simplifying analysis.
For instance, a SOM can be used to analyze hyperspectral imagery of a forest, clustering pixels based on their spectral signatures to identify different tree species or areas of stress.
Q 18. How can you combine unsupervised and supervised learning techniques for improved remote sensing analysis?
Combining unsupervised and supervised learning techniques can significantly improve remote sensing analysis by leveraging the strengths of both approaches. This is often referred to as a semi-supervised or hybrid approach.
Here’s how it works:
- Unsupervised pre-processing: Use unsupervised methods like clustering (k-means, DBSCAN) or dimensionality reduction (PCA) to pre-process the data. This can reduce noise, identify potential classes, and reduce the dimensionality, making the data more manageable for supervised learning.
- Supervised model training: Use the results from the unsupervised step to inform the training of a supervised model. For example, the clusters identified using unsupervised methods can be used as initial labels for a supervised classifier, requiring less labelled data.
- Refinement and iterative improvement: Iterate between the unsupervised and supervised steps. The results of the supervised model can provide feedback to refine the unsupervised clustering or feature extraction.
Consider a scenario where you’re classifying land cover types. First, apply DBSCAN to identify potential clusters. Then, use a small amount of labelled data to train a support vector machine (SVM) to classify these clusters more precisely. The SVM’s performance provides feedback to improve the DBSCAN parameter selection in subsequent iterations.
Q 19. Explain the application of unsupervised learning in change detection using remote sensing data.
Unsupervised learning plays a crucial role in change detection using remote sensing data, particularly for identifying changes without prior knowledge of the specific types of changes.
Common methods include:
- Clustering techniques: Apply clustering algorithms to both pre- and post-event imagery separately. Comparing the resulting clusters can reveal changes. For example, changes in land cover might result in the formation of new clusters or shifts in existing ones.
- Principal Component Analysis (PCA): PCA can reduce the dimensionality of the data by identifying principal components that capture the most variance. Changes can be detected by analyzing the differences in the principal component scores between different time points.
- Change Vector Analysis (CVA): Although not strictly unsupervised, CVA utilizes multi-temporal data without class labels. It analyzes the difference vectors between time points to identify areas of significant change.
For example, by comparing multispectral satellite images of a region over several years using clustering, you could identify areas where forests have been cleared or new urban development has taken place. The algorithm doesn’t need to know *what* type of change occurred beforehand; it simply highlights regions that have changed significantly.
Q 20. How do you address the issue of class imbalance in unsupervised learning for remote sensing?
Class imbalance is a significant issue in unsupervised learning for remote sensing, especially when dealing with datasets where certain land cover types are vastly more prevalent than others. This can lead to algorithms focusing predominantly on the majority class, neglecting minority classes that are potentially more important (e.g., rare species habitats).
Here’s how to address this:
- Oversampling: Duplicate samples from minority classes to artificially balance the dataset. This helps algorithms pay more attention to underrepresented features.
- Undersampling: Randomly remove samples from the majority class to make the class distribution more balanced. This can reduce computational complexity but might lead to loss of information.
- Cost-sensitive learning: Assign higher weights to minority classes in the loss function of the algorithm (though this isn’t directly applicable to every unsupervised algorithm). This encourages the algorithm to pay more attention to minority classes.
- Synthetic data generation: Use techniques like SMOTE (Synthetic Minority Over-sampling Technique) to generate synthetic samples for the minority classes, preserving the data distribution and avoiding overfitting.
- Focus on evaluation metrics: Use evaluation metrics that are less sensitive to class imbalance, such as the F1-score, instead of relying solely on accuracy.
Imagine a forest with a small area of deforestation. Standard clustering might ignore this small area because it is a minority. Oversampling or cost-sensitive methods would help balance the dataset so the algorithm doesn’t ignore this critical change.
Q 21. What are the ethical considerations of using unsupervised learning in remote sensing applications?
Ethical considerations in using unsupervised learning for remote sensing are crucial. Because these techniques often reveal patterns and information without human intervention, it’s essential to be mindful of potential biases and misuses.
Key ethical considerations include:
- Bias and fairness: Algorithms trained on biased data will produce biased results. This can perpetuate existing inequalities, especially when used for applications like resource allocation or urban planning. Carefully evaluating the data for bias and choosing algorithms that are robust to bias is important.
- Privacy and surveillance: Unsupervised learning can be used for identifying individuals or groups without their knowledge or consent. This raises serious privacy concerns, especially when applied to high-resolution imagery.
- Transparency and explainability: The lack of transparency in many unsupervised learning methods makes it difficult to understand why a model made a specific decision. This limits accountability and can lead to unfair or discriminatory outcomes. Striving for more explainable AI is critical.
- Data security: Protecting the sensitive data used for training and analysis is paramount. Implementing robust security measures to prevent data breaches is necessary.
- Misinterpretation of results: The output of unsupervised learning algorithms should be interpreted cautiously and verified by domain experts. Misinterpretations can lead to faulty conclusions and inappropriate actions.
It’s essential to consider these factors and design robust, ethical processes to ensure responsible use of unsupervised learning in remote sensing applications. Openly discussing limitations and potential biases is crucial for building trust and responsible innovation.
Q 22. Discuss the impact of cloud cover on unsupervised learning in remote sensing.
Cloud cover significantly impacts unsupervised learning in remote sensing because it masks the Earth’s surface, leading to incomplete or inaccurate data. Imagine trying to classify land cover from a satellite image – if a large portion is obscured by clouds, you’re missing crucial information about that area. This missing data can lead to inaccurate clustering results and biased interpretations.
The effect manifests in several ways:
- Reduced Sample Size: Cloud-covered areas are typically excluded from analysis, reducing the overall dataset size and potentially impacting the statistical robustness of the results.
- Spatial Bias: The remaining data might not be representative of the entire area, introducing spatial bias into the analysis. For instance, if cloud cover predominantly affects one land cover type, its representation in the final clusters will be under-represented.
- Increased Noise: Cloud edges often introduce noise into the data, affecting the performance of clustering algorithms. These noisy pixels can distort the similarity measures used by the algorithms, leading to inaccurate groupings.
Strategies to mitigate the impact of cloud cover include using multiple images to fill in gaps, employing cloud masking techniques to remove or fill in cloud-affected areas, and using advanced data fusion methods which combine data from different sensors or dates to reduce the effect of cloud coverage.
Q 23. How can you improve the scalability of unsupervised learning algorithms for large remote sensing datasets?
Scalability is crucial when dealing with the massive datasets generated by remote sensing. Unsupervised learning algorithms, even efficient ones, can struggle with the sheer volume of data. To improve scalability, we can leverage several approaches:
- Distributed Computing: Parallelizing the computation across multiple machines using frameworks like Apache Spark or Dask allows processing of large datasets that wouldn’t fit in a single machine’s memory. This involves breaking down the dataset into smaller chunks and processing them independently before combining the results.
- Approximate Nearest Neighbor Search: For algorithms like k-means that rely heavily on distance calculations, approximate nearest neighbor search techniques (like Annoy or Locality Sensitive Hashing) significantly reduce the computational complexity of finding the nearest data points. These methods trade some accuracy for significant speed improvements.
- Dimensionality Reduction: Techniques such as Principal Component Analysis (PCA) or t-distributed Stochastic Neighbor Embedding (t-SNE) can reduce the dimensionality of the data while preserving crucial information. This smaller dataset is then used for clustering, leading to faster and more efficient processing.
- Algorithm Selection: Some algorithms are inherently more scalable than others. For instance, mini-batch k-means is generally more scalable than standard k-means because it processes data in smaller batches.
- Data Sampling: For very large datasets, a representative subset of the data can be used for clustering. This approach trades some accuracy for a significant gain in scalability. Careful sampling techniques are needed to avoid introducing bias.
In practice, a combination of these methods is often employed to achieve optimal scalability. For example, I’ve worked on a project where we used a distributed computing framework to process a massive Landsat dataset, employing PCA for dimensionality reduction and mini-batch k-means for clustering.
Q 24. Compare and contrast different clustering algorithms (e.g., k-means, hierarchical clustering, DBSCAN).
Several clustering algorithms are commonly used in remote sensing. Let’s compare k-means, hierarchical clustering, and DBSCAN:
| Algorithm | Description | Strengths | Weaknesses |
|---|---|---|---|
| K-means | Partitions data into k clusters based on distance to centroids. | Simple, fast for relatively small datasets. | Requires specifying k, sensitive to initial centroid placement, assumes spherical clusters. |
| Hierarchical Clustering | Builds a hierarchy of clusters, either agglomerative (bottom-up) or divisive (top-down). | Provides a dendrogram showing cluster relationships, doesn’t require specifying the number of clusters. | Computationally expensive for large datasets, sensitive to noise and outliers. |
| DBSCAN | Groups data points based on density; identifies clusters as dense regions separated by sparse regions. | Robust to outliers, discovers clusters of arbitrary shape. | Sensitive to parameter selection (epsilon and minPts), struggles with varying densities. |
The choice of algorithm depends on the specific dataset and the desired outcome. For example, if we have a clear idea about the number of clusters and the data is relatively clean, k-means might be suitable. If cluster shapes are irregular and outliers are present, DBSCAN is a better choice. Hierarchical clustering offers a more comprehensive view of the cluster relationships, but its computational cost should be considered.
Q 25. Describe your experience with specific remote sensing software or libraries (e.g., ENVI, ArcGIS, Python libraries like scikit-learn).
My experience spans several remote sensing software packages and libraries. I’m proficient in using Python with libraries like scikit-learn for implementing and evaluating various unsupervised learning algorithms. Scikit-learn offers a comprehensive suite of tools for data preprocessing, feature engineering, and model evaluation, which are essential for effectively working with remote sensing data. For example, I’ve used its k-means and DBSCAN implementations extensively for land cover classification.
I also have experience with ENVI, particularly its image processing and classification tools. ENVI excels in handling large raster datasets and offers a user-friendly interface for visual inspection and analysis. In one project, I used ENVI for initial data exploration and pre-processing before applying unsupervised learning techniques in Python. While I’m not as heavily experienced with ArcGIS’s direct unsupervised learning capabilities, I understand its spatial analysis tools, which can be integrated effectively into workflows alongside Python-based unsupervised learning.
Q 26. Explain your experience with parallel processing and its importance when dealing with large remote sensing datasets.
Parallel processing is absolutely essential when dealing with large remote sensing datasets. The sheer volume of data makes sequential processing impractically slow. Imagine trying to process a 100 GB satellite image on a single core – it would take an unreasonably long time. Parallel processing divides the workload across multiple cores or machines, significantly reducing processing time.
I’ve extensively used parallel processing techniques in my work. For instance, I’ve used multiprocessing in Python (using the multiprocessing library) to parallelize computationally intensive steps like feature extraction and clustering calculations. This involved splitting the input data into chunks, processing each chunk on a separate core, and then aggregating the results. The benefits were substantial: processing times were reduced by orders of magnitude, allowing for much faster analysis and experimentation.
In addition to multiprocessing, I am also familiar with using distributed computing frameworks like Dask and Spark for handling datasets that exceed the memory capacity of a single machine. These frameworks allow for efficient distribution of tasks across a cluster of computers.
Q 27. How do you handle noisy or missing data in unsupervised learning for remote sensing?
Noisy and missing data are common challenges in remote sensing. Noise can stem from atmospheric effects, sensor limitations, or errors during data acquisition. Missing data can result from cloud cover, sensor malfunction, or data corruption. These issues can significantly impact the accuracy of unsupervised learning algorithms.
Several techniques can be employed to handle these issues:
- Data Cleaning: This involves identifying and removing or correcting obviously erroneous data points. For example, pixels with extremely high or low values that deviate significantly from surrounding pixels can be identified and removed or replaced with interpolated values.
- Data Imputation: For missing data, imputation methods like mean imputation, k-Nearest Neighbors imputation, or more sophisticated model-based approaches can fill in the gaps. The best approach depends on the nature and extent of missing data.
- Robust Algorithms: Some unsupervised learning algorithms are inherently more robust to noise and outliers than others. DBSCAN, for example, is relatively insensitive to noise compared to k-means.
- Preprocessing Techniques: Applying filtering techniques (like median filtering) to reduce noise before applying clustering is often a very effective strategy.
Choosing the right strategy involves careful analysis of the data and understanding the source and nature of the noise or missing data. A combination of these techniques is often necessary to get the best results.
Q 28. What are some future trends in unsupervised learning for remote sensing?
Unsupervised learning in remote sensing is a rapidly evolving field. Several exciting future trends are shaping its development:
- Deep Learning for Feature Extraction: Deep learning models, particularly convolutional neural networks (CNNs), are increasingly used for automated feature extraction from remote sensing data. This reduces reliance on manual feature engineering and potentially leads to more robust and informative representations for clustering.
- Integration of Multi-Source Data: Combining data from different sensors (e.g., optical, radar, LiDAR) and sources (e.g., satellite, UAV, in-situ measurements) is becoming increasingly common. This fusion of data can improve the accuracy and richness of land cover classification.
- Semi-Supervised and Active Learning: Combining unsupervised learning with limited labeled data or active learning strategies can significantly improve the accuracy and efficiency of land cover mapping. Active learning allows for iterative refinement of the clustering process by intelligently selecting samples for manual labeling.
- Explainable AI (XAI) for Remote Sensing: Understanding the reasoning behind clustering results is crucial for building trust in the analysis. XAI techniques aim to make the decision-making processes of deep learning models more transparent and interpretable.
- Applications in Environmental Monitoring: Unsupervised learning will play a critical role in monitoring environmental change, detecting deforestation, tracking urban sprawl, and monitoring climate change impacts.
These trends highlight a future where unsupervised learning will be even more powerful and impactful in addressing pressing environmental and societal challenges.
Key Topics to Learn for Unsupervised Learning for Remote Sensing Interview
- Clustering Techniques: Understand and compare different clustering algorithms like k-means, hierarchical clustering, and DBSCAN, their strengths and weaknesses in the context of remote sensing data (e.g., handling noise, identifying optimal cluster numbers).
- Dimensionality Reduction: Master techniques like Principal Component Analysis (PCA) and t-SNE for reducing the dimensionality of high-dimensional remote sensing datasets, improving computational efficiency and visualization.
- Feature Extraction and Selection: Learn how to extract meaningful features from remote sensing imagery (e.g., texture features, spectral indices) and select the most relevant features for unsupervised learning models, impacting model performance and interpretability.
- Anomaly Detection: Explore methods for identifying unusual patterns or outliers in remote sensing data, crucial for applications like change detection and identifying anomalies in environmental monitoring.
- Image Segmentation: Understand how unsupervised learning can be applied to segment images into meaningful regions based on spectral and spatial characteristics, supporting applications in land cover classification and object detection.
- Practical Applications: Be prepared to discuss real-world applications of unsupervised learning in remote sensing, such as land cover mapping, urban planning, environmental monitoring, precision agriculture, and disaster response. Consider the challenges and limitations in each application.
- Model Evaluation: Know how to evaluate the performance of unsupervised learning models using appropriate metrics (e.g., silhouette score, Davies-Bouldin index) and understand the challenges in evaluating unsupervised models compared to supervised models.
- Software and Tools: Familiarize yourself with commonly used software packages and libraries for remote sensing data processing and unsupervised learning (e.g., Python with scikit-learn, GDAL, rasterio).
Next Steps
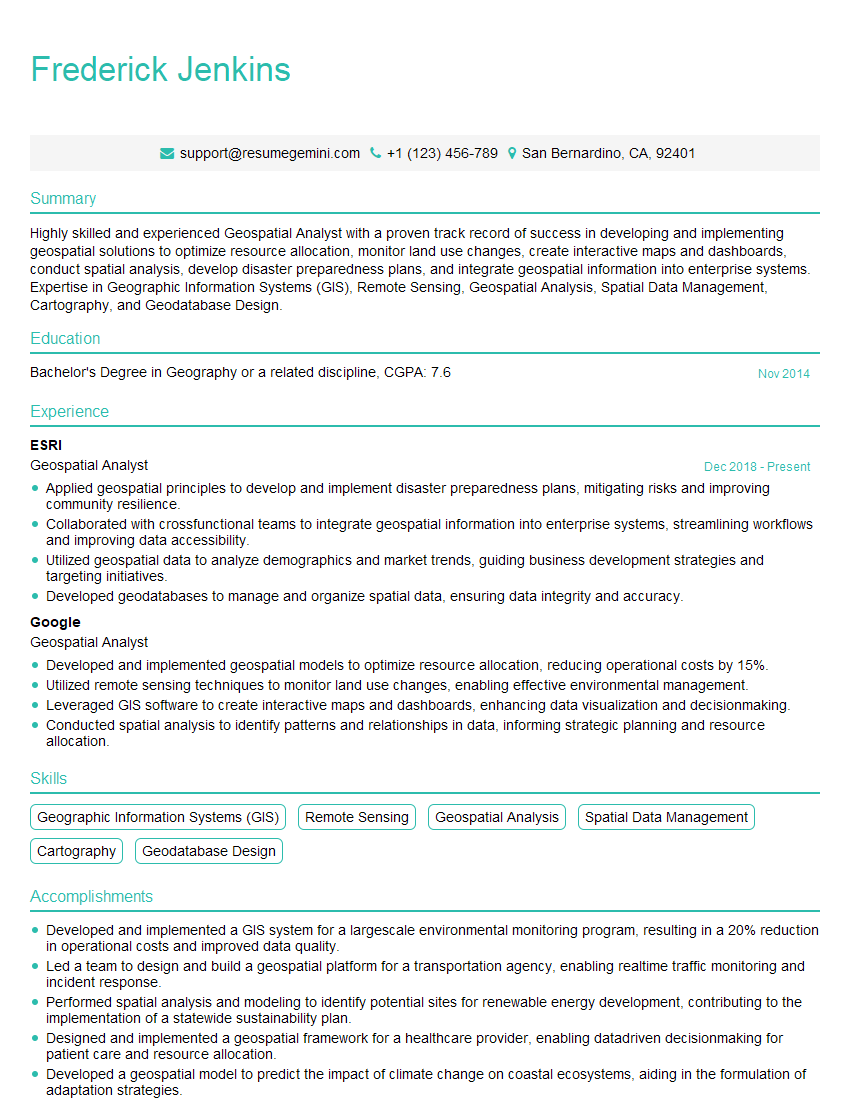
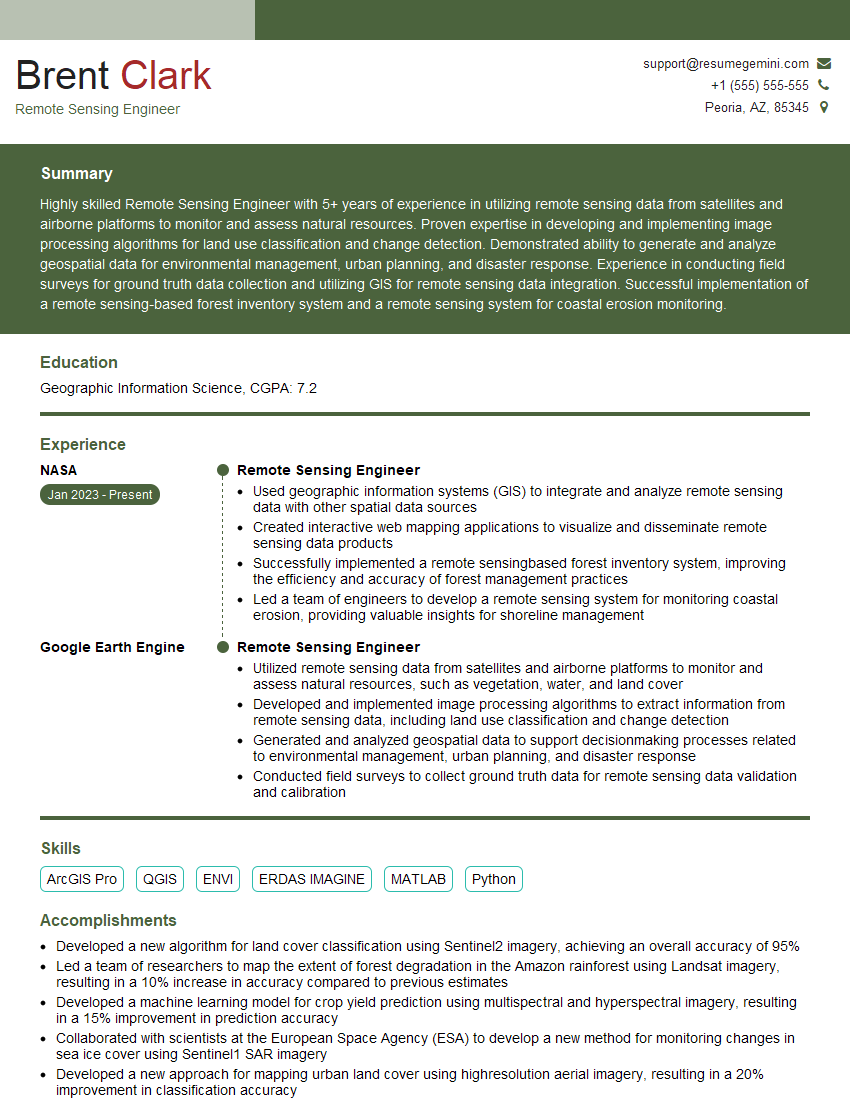
Mastering unsupervised learning for remote sensing significantly enhances your career prospects in the rapidly growing field of geospatial analysis. This expertise is highly sought after in various sectors, offering exciting opportunities for innovation and impact. To maximize your chances of landing your dream role, creating a strong, ATS-friendly resume is crucial. ResumeGemini is a trusted resource that can help you build a professional and impactful resume tailored to your specific skills and experience. We provide examples of resumes specifically designed for candidates with expertise in Unsupervised Learning for Remote Sensing to guide you in showcasing your qualifications effectively.
Explore more articles
Users Rating of Our Blogs
Share Your Experience
We value your feedback! Please rate our content and share your thoughts (optional).
What Readers Say About Our Blog
To the interviewgemini.com Webmaster.
Very helpful and content specific questions to help prepare me for my interview!
Thank you
To the interviewgemini.com Webmaster.
This was kind of a unique content I found around the specialized skills. Very helpful questions and good detailed answers.
Very Helpful blog, thank you Interviewgemini team.