Unlock your full potential by mastering the most common Demographic Software (e.g., Census Bureau’s American FactFinder) interview questions. This blog offers a deep dive into the critical topics, ensuring you’re not only prepared to answer but to excel. With these insights, you’ll approach your interview with clarity and confidence.
Questions Asked in Demographic Software (e.g., Census Bureau’s American FactFinder) Interview
Q 1. Explain the difference between decennial and American Community Survey data.
The key difference between decennial census data and American Community Survey (ACS) data lies in their frequency and scope. The decennial census, conducted every 10 years, provides a comprehensive snapshot of the entire U.S. population at a specific point in time. It aims for complete coverage, gathering data from every household. Think of it as a detailed photograph of the nation’s population.
In contrast, the ACS is an ongoing survey that collects data continuously throughout the year. It samples a smaller, rotating portion of the population, providing more frequent updates on demographic trends but with higher sampling error than the decennial census. Imagine the ACS as a series of time-lapse videos, showing population changes over time, although with less detailed resolution per frame compared to the photograph of the decennial census. The ACS data is released annually and in five-year averages to smooth out sampling variability.
Q 2. Describe the various data tables available in American FactFinder (or its successor).
American FactFinder, while now discontinued, offered a vast array of data tables covering various demographic, economic, housing, and social characteristics. The data was organized geographically, allowing users to explore data at national, state, county, tract, and block group levels. Key table categories included:
- Population: Age, sex, race, ethnicity, household size, etc.
- Housing: Occupancy, value, rent, homeownership, etc.
- Economic Characteristics: Income, poverty, employment, education, etc.
- Social Characteristics: Language spoken at home, veteran status, disability status, etc.
Each category contained numerous detailed tables, allowing users to build very specific queries. For example, one might find tables detailing median income by race and ethnicity for specific zip codes or the percentage of households with internet access in a particular county.
Q 3. How would you use American FactFinder to identify areas with high poverty rates?
To identify areas with high poverty rates using American FactFinder (or its successor, data.census.gov), I would utilize the poverty data tables. First, I would define the geographic level of analysis (e.g., counties, census tracts). Then, I would select the relevant table containing poverty estimates, likely a table showing the percentage of individuals or families below the poverty line. I would then filter or sort the data to show the areas with the highest poverty percentages. This could be exported as a data file (CSV or other) and then used with mapping software to visualize the results. This process now happens on data.census.gov using similar search functionalities.
Q 4. What are the limitations of using data from American FactFinder?
American FactFinder data, like any demographic data source, had limitations. Some key limitations include:
- Sampling Error: Especially with ACS data, sampling error can lead to uncertainty in estimates, particularly for small geographic areas or less prevalent population subgroups. This means the reported numbers are estimates with a margin of error.
- Data Lag: While the ACS provided more timely data than the decennial census, there’s still a time lag between data collection and release. Trends might have shifted by the time the data is published.
- Data Suppression: To protect individual privacy, certain data values might be suppressed or aggregated, particularly for small populations, making precise analysis at highly granular geographic levels difficult. This means some data points will be unavailable.
- Definition Changes: Definitions and methodologies used to collect data can change over time, making comparisons across different years or surveys challenging. You need to understand the methodology used in the survey year.
Q 5. How do you handle missing data in demographic datasets?
Handling missing data is crucial for accurate analysis. Several approaches exist, each with advantages and disadvantages:
- Deletion: The simplest approach, but can introduce bias if missing data is not random. It’s best used when missing data is minimal and randomly distributed.
- Imputation: This involves filling in missing values based on observed data. Methods include mean imputation (replacing with the average), regression imputation (predicting missing values based on other variables), and multiple imputation (creating several plausible datasets to account for uncertainty). Imputation is preferred if missing data is non-random, but choosing the correct method depends on the pattern of missing data.
- Weighting Adjustments: Adjusting the weights assigned to observations can account for bias introduced by missing data. This is often used in large-scale surveys.
The best approach depends on the amount of missing data, the pattern of missingness (random or non-random), and the research question. It’s crucial to document the method used and acknowledge its potential impact on the results.
Q 6. Explain different data aggregation techniques and their applications.
Data aggregation techniques combine data from multiple sources or geographic levels to summarize or simplify complex datasets. Examples include:
- Spatial Aggregation: Combining data from smaller geographic units (e.g., census blocks) into larger ones (e.g., census tracts, counties). This is useful for creating less detailed maps or comparing larger areas.
- Temporal Aggregation: Combining data from multiple time points (e.g., monthly or yearly data) into broader periods (e.g., quarterly or annually). This smooths out short-term fluctuations and reveals longer-term trends.
- Categorical Aggregation: Grouping observations with similar characteristics into categories (e.g., age groups, income brackets). This simplifies analysis and improves interpretation of results. An example would be combining several age categories into an ‘elderly’ category.
The choice of aggregation technique depends on the research question and the desired level of detail. It’s essential to consider the potential loss of information when aggregating data.
Q 7. How would you create a map visualizing demographic data from American FactFinder?
To create a map visualizing demographic data from American FactFinder (or its successor), I would first download the relevant data tables in a format suitable for mapping software (e.g., CSV). Then, I would use Geographic Information System (GIS) software like ArcGIS or QGIS. The data would need to have a geographic component which usually involves a spatial identifier such as a FIPS code or latitude/longitude to locate the data on a map. I would then use the software’s mapping tools to create choropleth maps (maps that show data values using different colors or shades), dot density maps (maps that show data density using dots), or other suitable visualization techniques, depending on the type of data and the message I wanted to convey. The resulting map would effectively illustrate geographic variations in the chosen demographic characteristic.
Q 8. Describe your experience with data cleaning and preprocessing techniques.
Data cleaning and preprocessing are crucial steps before any meaningful analysis of demographic data. Think of it like preparing ingredients before cooking a delicious meal – you wouldn’t start cooking with spoiled ingredients, right? My experience encompasses a wide range of techniques, including:
- Handling Missing Data: I utilize various imputation methods such as mean/median imputation, k-Nearest Neighbors imputation, or more sophisticated techniques based on the context and nature of the missing data. For example, if income data is missing for a specific demographic group, I might use data from similar groups to estimate the missing values.
- Outlier Detection and Treatment: Outliers can skew results significantly. I employ box plots, scatter plots, and Z-score calculations to identify outliers. I then decide whether to remove them, transform them (like using a logarithmic transformation), or replace them with more reasonable values depending on the underlying cause of the outlier.
- Data Transformation: This involves changing the format of data to make it suitable for analysis. For example, I often standardize or normalize data to ensure all variables have a similar scale, which is particularly important when using algorithms sensitive to scaling like principal component analysis.
- Data Consistency Checks: I meticulously check for inconsistencies and errors in the data, such as duplicate entries or conflicting information. This often involves using data validation tools and writing custom scripts to ensure data integrity.
For instance, when working with census data, I’ve encountered inconsistencies in address information or age reporting. Identifying and resolving such discrepancies is critical for generating reliable analyses.
Q 9. How familiar are you with data visualization tools for demographic data?
I’m proficient in several data visualization tools tailored for demographic data analysis. Effective visualization is key to communicating complex information clearly and concisely. My experience includes:
- Tableau: Excellent for creating interactive dashboards and maps to showcase demographic trends geographically. For example, I could easily visualize population density across different states or analyze income disparities within a city using interactive maps and charts.
- R (with ggplot2): Provides unparalleled flexibility for creating customized and publication-quality visualizations. I can use R to create intricate charts, maps, and other graphics tailored to effectively communicate my findings. For example, I can generate age pyramids, population density maps, or choropleth maps illustrating changes in ethnic composition over time.
- Python (with Matplotlib and Seaborn): Similar to R, it offers extensive visualization capabilities. I can use this combination for creating a range of static and interactive visualizations, including bar charts, line graphs, and scatter plots to illustrate relationships between various demographic variables.
Choosing the right tool depends on the specific analysis and the intended audience. A client might prefer an interactive Tableau dashboard, while a research paper may benefit from the high-quality graphics produced by R or Python.
Q 10. What statistical methods do you use to analyze demographic data?
My analytical toolkit includes a variety of statistical methods commonly used in demographic studies. The choice of method depends on the research question and the nature of the data.
- Descriptive Statistics: I regularly use measures of central tendency (mean, median, mode), dispersion (standard deviation, variance), and frequency distributions to summarize demographic characteristics.
- Inferential Statistics: This involves making generalizations about a population based on a sample. I use techniques like hypothesis testing (t-tests, ANOVA), regression analysis (linear, logistic), and correlation analysis to explore relationships between demographic variables. For example, I might use regression to model the relationship between education level and income.
- Spatial Statistics: When dealing with geographically referenced data, I utilize techniques such as spatial autocorrelation analysis and spatial regression to account for the spatial dependencies in the data. For example, analyzing crime rates requires considering the spatial proximity of different neighborhoods.
- Time Series Analysis: To study demographic trends over time, I use time series techniques such as ARIMA modeling or exponential smoothing to forecast future population sizes or migration patterns.
I also leverage advanced techniques like machine learning algorithms when appropriate, for example, to predict future population growth or classify individuals into different demographic groups based on various characteristics.
Q 11. Explain the concept of population density and its calculation.
Population density describes how densely populated a given area is. It’s simply the number of people per unit of area, typically expressed as people per square kilometer or people per square mile.
The calculation is straightforward:
Population Density = Total Population / Total AreaFor example, if a city with an area of 100 square kilometers has a population of 50,000, its population density is 500 people per square kilometer (50,000 / 100 = 500).
Understanding population density is critical for urban planning, resource allocation, and understanding societal pressures. High population density often leads to challenges like increased traffic congestion, strain on infrastructure, and higher housing costs. Conversely, low population density can present its own set of challenges, such as difficulty in providing essential services.
Q 12. How would you interpret age pyramids and their implications?
Age pyramids, also known as population pyramids, are graphical representations of the age and sex composition of a population. They provide a snapshot of a population’s structure and offer insights into potential future trends.
Interpretation involves analyzing the shape of the pyramid:
- Expanding Pyramid: A wide base indicates a high birth rate and a growing population. This suggests a young population with considerable future growth potential.
- Stationary Pyramid: A relatively uniform shape with a slowly decreasing base suggests a stable birth rate and a slowly growing or stable population.
- Contracting Pyramid: A narrow base indicates a declining birth rate and a shrinking population. This suggests an aging population with potentially fewer people entering the workforce.
The implications of different pyramid shapes are significant for various sectors. For example, a contracting pyramid implies an increased strain on social security systems and potential labor shortages. An expanding pyramid might necessitate increased investment in education and infrastructure.
Analyzing the sex ratio within each age group also reveals important information. For example, significant imbalances can point to historical events like war or migration patterns.
Q 13. Describe your experience with data query languages like SQL.
SQL (Structured Query Language) is indispensable for working with large demographic datasets. My experience includes writing complex SQL queries to extract, manipulate, and analyze data from various sources.
Here are some examples of how I use SQL:
- Data Extraction:
SELECT * FROM population_data WHERE state = 'California';This simple query retrieves all data from the ‘population_data’ table for California. - Data Filtering and Aggregation:
SELECT COUNT(*) , AVG(age) FROM population_data WHERE gender = 'Female' GROUP BY city;This query calculates the number of females and their average age in each city. - Data Joining:
SELECT p.city, i.median_income FROM population_data p JOIN income_data i ON p.city_id = i.city_id;This joins two tables to associate population data with income data based on city.
Beyond basic queries, I can develop intricate SQL queries involving subqueries, window functions, and common table expressions to handle more complex analysis tasks. My expertise extends to optimizing SQL queries for performance, ensuring efficient data retrieval from large databases.
Q 14. What are the ethical considerations when working with demographic data?
Ethical considerations are paramount when dealing with demographic data, as it is often sensitive and can be misused. My ethical framework includes:
- Privacy Protection: I strictly adhere to data privacy regulations (like GDPR, HIPAA) and anonymize data wherever possible to protect individual identities. This might involve removing personally identifiable information or using aggregation techniques to report data at a higher level of granularity.
- Data Security: I employ appropriate security measures to protect data from unauthorized access, use, disclosure, disruption, modification, or destruction. This includes secure data storage, access controls, and encryption.
- Avoiding Bias: I am aware of potential biases in data collection and analysis and actively work to mitigate them. This requires careful consideration of sampling methods, data sources, and analytical techniques to avoid perpetuating or creating discriminatory outcomes.
- Transparency and Accountability: I maintain transparency in my methods and findings, clearly documenting my processes and acknowledging any limitations. I am accountable for the responsible use and interpretation of the data.
- Informed Consent: Whenever feasible, I ensure that data subjects provide informed consent for the use of their data.
For example, when analyzing income data, I’m mindful of avoiding generalizations that could perpetuate stereotypes. I carefully present findings avoiding inflammatory language that might unfairly target specific groups.
Q 15. How would you ensure the accuracy and reliability of demographic data?
Ensuring the accuracy and reliability of demographic data is paramount. It involves a multi-faceted approach focusing on data collection, processing, and validation. Think of it like building a sturdy house – you need a strong foundation and meticulous construction.
Data Source Validation: We need to critically assess the source of the data. Is it from a reputable organization like the Census Bureau or a potentially biased source? Understanding the methodology used in data collection (e.g., sampling techniques, survey design) is crucial. For instance, a self-reported survey might be subject to response bias compared to data collected through administrative records.
Data Cleaning and Processing: This stage involves identifying and handling inconsistencies, errors, and outliers. This could involve techniques like data imputation to fill in missing values (using reasonable estimates) or outlier removal (after carefully investigating potential reasons for the anomaly). Imagine finding a data point showing a person 150 years old— that clearly needs attention!
Data Validation and Cross-Referencing: Comparing data from multiple sources helps identify inconsistencies and potential errors. For example, we could compare population counts from the Census Bureau with those from a local government agency. Discrepancies need investigation and resolution. It’s like double-checking your work for accuracy.
Quality Control Measures: Implementing rigorous quality control measures throughout the data pipeline is critical. This could involve automated checks, manual reviews, and statistical tests to ensure data integrity.
Career Expert Tips:
- Ace those interviews! Prepare effectively by reviewing the Top 50 Most Common Interview Questions on ResumeGemini.
- Navigate your job search with confidence! Explore a wide range of Career Tips on ResumeGemini. Learn about common challenges and recommendations to overcome them.
- Craft the perfect resume! Master the Art of Resume Writing with ResumeGemini’s guide. Showcase your unique qualifications and achievements effectively.
- Don’t miss out on holiday savings! Build your dream resume with ResumeGemini’s ATS optimized templates.
Q 16. How can you identify potential biases in demographic data?
Identifying biases in demographic data is crucial for drawing accurate conclusions. Biases can stem from various sources, impacting the reliability of analysis. Consider it like spotting hidden flaws in a seemingly perfect picture.
Sampling Bias: A non-representative sample can lead to skewed results. For example, if a survey only targets a specific socioeconomic group, the findings won’t accurately reflect the overall population.
Measurement Bias: This occurs when the method used to collect data systematically over- or under-represents certain characteristics. For example, questions phrased in a leading manner might influence responses.
Non-response Bias: If a significant portion of the target population doesn’t respond to a survey, the results can be biased. For instance, people with lower incomes might be less likely to participate in surveys, creating a bias in income-related data.
Reporting Bias: This can occur when certain groups are more likely to report certain behaviors or characteristics than others. For instance, studies show individuals may underreport sensitive information like income or health conditions.
Identifying these biases requires careful examination of the data collection methods, sample characteristics, and the context in which the data was collected. We often use statistical techniques to assess the impact of these biases.
Q 17. Explain your experience with data management and storage techniques.
My experience with data management and storage techniques encompasses various aspects, from data cleaning and transformation to efficient storage and retrieval. Think of it as being a librarian for large datasets, ensuring accessibility and integrity.
Relational Databases (SQL): I am proficient in using relational database management systems (RDBMS) like MySQL and PostgreSQL for storing and managing large demographic datasets. This involves designing efficient database schemas, creating queries to extract information, and ensuring data integrity through constraints and transactions.
NoSQL Databases: For certain types of demographic data, like geospatial data, NoSQL databases can be more efficient. I have experience working with MongoDB and other NoSQL solutions to store and manage unstructured or semi-structured data.
Cloud Storage: I am familiar with cloud storage solutions such as Amazon S3 and Google Cloud Storage for storing large datasets securely and accessibly. This ensures scalability and redundancy, safeguarding against data loss.
Data Warehousing and ETL Processes: I have hands-on experience with building data warehouses and implementing Extract, Transform, Load (ETL) processes to integrate data from various sources into a cohesive and consistent format. This involves data cleaning, transformation, and loading into a target database.
Q 18. How familiar are you with geographic information systems (GIS)?
I’m very familiar with Geographic Information Systems (GIS). GIS software allows visualizing and analyzing geographic data, making it invaluable for demographic analysis. Think of it as adding a geographic dimension to our understanding of population distribution.
My experience includes using GIS software (ArcGIS, QGIS) to map demographic data, analyze spatial patterns, and create visualizations such as population density maps, choropleth maps showing income levels, and spatial autocorrelation analyses to study relationships between demographic variables and geographic locations.
For example, I’ve used GIS to identify underserved communities based on factors like access to healthcare or education, visualized the spread of a particular disease, or analyzed patterns of migration.
Q 19. Describe your experience with statistical software packages (e.g., R, SPSS, SAS).
I possess extensive experience using statistical software packages like R, SPSS, and SAS for demographic data analysis. These tools are indispensable for sophisticated analysis.
R: I utilize R’s extensive statistical libraries (e.g., dplyr, ggplot2) for data manipulation, statistical modeling (regression, time series analysis), and creating compelling visualizations. For example, I’ve used R to build predictive models for population growth.
SPSS: SPSS is frequently used for surveys and demographic analyses. I’ve used it for descriptive statistics, hypothesis testing, and complex statistical modeling.
SAS: SAS is known for its power in handling large datasets and its advanced statistical capabilities. I’ve leveraged SAS for complex data management, statistical modeling, and report generation.
My proficiency extends beyond basic statistical functions; I’m comfortable with advanced techniques like multivariate analysis, spatial statistics, and causal inference.
Q 20. How would you analyze demographic trends over time?
Analyzing demographic trends over time requires a combination of statistical techniques and visualization. It’s like observing a movie rather than a single snapshot to understand the bigger picture.
My approach involves:
Data Aggregation and Cleaning: I’d first compile the demographic data from various sources, ensuring consistency and accuracy across different time points.
Time Series Analysis: Techniques like moving averages, exponential smoothing, and ARIMA models help identify trends, seasonality, and cyclical patterns in the data.
Visualization: Line graphs, area charts, and other dynamic visualizations are very effective for showing trends visually.
Regression Analysis: Regression models can help identify factors contributing to changes in demographic variables over time.
For example, I might analyze birth rates over the past 50 years, identifying periods of high and low fertility, exploring contributing socioeconomic factors.
Q 21. Explain how you would use demographic data for market research.
Demographic data is fundamental to effective market research; it helps target the right customers and optimize marketing strategies. Imagine it as your map to navigating a diverse market landscape.
I would use demographic data in the following ways:
Market Segmentation: Demographic data (age, gender, income, education, ethnicity) allows us to segment the market into distinct groups with shared characteristics and needs, enabling targeted marketing campaigns.
Demand Forecasting: Analyzing population trends and household characteristics allows us to predict future demand for products and services.
Site Selection: Demographic data helps determine optimal locations for new stores, restaurants, or other businesses based on population density, income levels, and consumer preferences.
Campaign Optimization: Analyzing demographic data helps tailor marketing messages, media choices, and campaign timing for maximum effectiveness. For example, an advertisement for a retirement community would target an older demographic.
In essence, demographic data provides the insights needed to understand customer behavior, tailor products and services, and optimize marketing strategies for maximum impact and return.
Q 22. How would you present your findings from a demographic analysis to a non-technical audience?
Presenting complex demographic data to a non-technical audience requires translating technical jargon into plain language and using visuals to illustrate key findings. I would begin by outlining the overall objective of the analysis – what questions were we trying to answer? Then, I’d present the key findings using clear, concise statements supported by charts and graphs. For example, instead of saying “The age-adjusted mortality rate increased by 1.5%,” I might say, “More people are dying than expected for their age group, representing a 1.5% increase.” I would avoid technical terms unless absolutely necessary, and when used, I’d provide clear definitions. Finally, I’d focus on the implications of the findings, explaining what they mean for decision-making and future planning. I find that using analogies and real-world examples helps tremendously; for instance, comparing population growth to the growth of a plant helps visualize the concept.
For example, if analyzing census data showing a decline in the young adult population in a specific city, I would use a bar chart comparing the population across different age groups over time to clearly show the trend. I’d then explain the possible implications – perhaps less demand for certain goods and services, or a potential need for different types of housing.
Q 23. Describe a time you had to solve a complex data analysis problem.
During a project analyzing the impact of a new transportation system on neighborhood demographics, I encountered a significant data quality issue. The initial dataset contained inconsistencies in address matching, leading to inaccurate population counts for certain neighborhoods. To solve this, I employed several techniques. First, I investigated the source of the inconsistencies, tracing them back to variations in address formatting in the original datasets. Then, I implemented data cleaning and standardization techniques, such as using fuzzy matching algorithms to identify and correct inconsistencies. Finally, I developed a series of quality control checks to verify the accuracy of the cleaned data before using it for analysis. This process involved cross-referencing with other datasets like geographic information systems (GIS) data, and ultimately resulted in a more accurate and reliable representation of population distribution and changes.
Q 24. How do you stay updated on the latest advancements in demographic data and analysis?
Staying current in the field of demographic data and analysis is crucial. I actively engage in several strategies. Firstly, I subscribe to and regularly read relevant journals and publications such as the journal of the American Statistical Association or publications from the US Census Bureau. Secondly, I attend conferences and workshops organized by professional organizations like the Population Association of America. These events provide access to the latest research, methodologies, and advancements in the field. I also actively participate in online communities and forums dedicated to demographic analysis, exchanging insights with other professionals and learning about new software and techniques. Finally, I leverage online courses and training programs to learn about new data visualization tools and statistical methods.
Q 25. What are some of the challenges in working with large demographic datasets?
Working with large demographic datasets presents numerous challenges. One key issue is data volume – the sheer size of these datasets demands significant computational resources and efficient data management techniques. Another challenge is data complexity; demographic data often contains multiple variables and layers of information requiring sophisticated analytical methods. Data quality is another significant concern, as inconsistencies, errors, and missing values are common, requiring substantial data cleaning and validation. Moreover, ensuring data privacy and security when handling sensitive personal information is paramount. Finally, the ethical implications of using demographic data and the potential for bias in both the data and analysis methods must be carefully considered.
Q 26. Describe your experience with data interpretation and reporting.
My experience in data interpretation and reporting spans several years and diverse projects. I’m proficient in various statistical techniques, ranging from descriptive statistics (mean, median, standard deviation) to more advanced methods like regression analysis and time series analysis. I can effectively interpret the results of these analyses and translate them into clear, concise, and actionable insights. I’m skilled in creating a variety of reports, from simple tables and charts to complex presentations suitable for both technical and non-technical audiences. I always focus on visualizing data effectively – choosing appropriate chart types to highlight key trends and patterns. I believe in communicating findings transparently, acknowledging limitations and potential biases in the data or analysis. For instance, in a recent report, I used interactive dashboards to allow stakeholders to explore the data in detail and derive their own conclusions, emphasizing transparency and accessibility.
Q 27. How do you ensure data security and privacy when working with sensitive demographic data?
Data security and privacy are of paramount importance when working with sensitive demographic data. I adhere to strict protocols to ensure compliance with all relevant regulations, such as HIPAA and GDPR. This includes using secure storage solutions, implementing access controls to restrict access to authorized personnel only, and encrypting data both in transit and at rest. I anonymize data whenever possible to remove or mask personally identifiable information, while preserving the analytical value of the dataset. Regular security audits are performed to identify and address any vulnerabilities. Furthermore, I always obtain proper consent and authorization before collecting, using, or sharing any personal data. Data governance and ethical considerations are central to my workflow.
Q 28. What are the key differences between different demographic software packages?
Different demographic software packages vary significantly in their features, capabilities, and target users. Some packages, such as the now-retired American FactFinder, focus on providing access to large government datasets and basic analytical tools. Others, like specialized GIS software, are geared towards spatial analysis and mapping. Commercial packages often offer more advanced statistical functionalities, data visualization options, and user-friendly interfaces, while open-source options prioritize flexibility and customizability but may require greater technical expertise. The choice of software depends heavily on the specific project needs, budget constraints, and the technical skills of the analysts involved. For example, a simple analysis of census data might only require a spreadsheet program, while a complex spatial analysis would likely demand a GIS platform.
Key Topics to Learn for Demographic Software (e.g., Census Bureau’s American FactFinder) Interview
- Data Retrieval and Querying: Understanding how to effectively navigate the software interface, formulate complex queries, and extract relevant demographic data. Practice retrieving data using various search parameters and filters.
- Data Interpretation and Analysis: Mastering the ability to interpret the retrieved data, identify trends and patterns, and draw meaningful conclusions. Focus on translating raw data into actionable insights.
- Data Visualization: Familiarize yourself with the software’s capabilities for creating charts, graphs, and maps to visually represent demographic data. Practice presenting data effectively using different visualization techniques.
- Geographical Information Systems (GIS) Integration (if applicable): If the role involves GIS, understand how demographic data integrates with maps and spatial analysis tools. Practice creating thematic maps and analyzing spatial patterns.
- Data Accuracy and Validation: Learn about data quality control measures and how to identify and address potential inconsistencies or errors in demographic data. Understand the limitations and potential biases within the data.
- Specific Software Features: Become proficient in using the specific features and functionalities of the target demographic software (e.g., American FactFinder’s advanced search options, data tables, and map functionalities). Explore tutorials and practice exercises available.
- Problem-Solving and Case Studies: Prepare to discuss how you would approach common challenges in analyzing demographic data, such as dealing with missing data or interpreting complex statistical outputs. Consider practicing with sample datasets.
Next Steps
Mastering demographic software like American FactFinder is crucial for career advancement in fields requiring data analysis, research, and policy development. A strong understanding of these tools demonstrates valuable skills highly sought after by employers. To significantly boost your job prospects, it’s essential to create an ATS-friendly resume that highlights your expertise effectively. ResumeGemini is a trusted resource to help you craft a professional and impactful resume tailored to your specific skills and experience. Examples of resumes tailored to roles involving demographic software are available to guide your resume creation process.
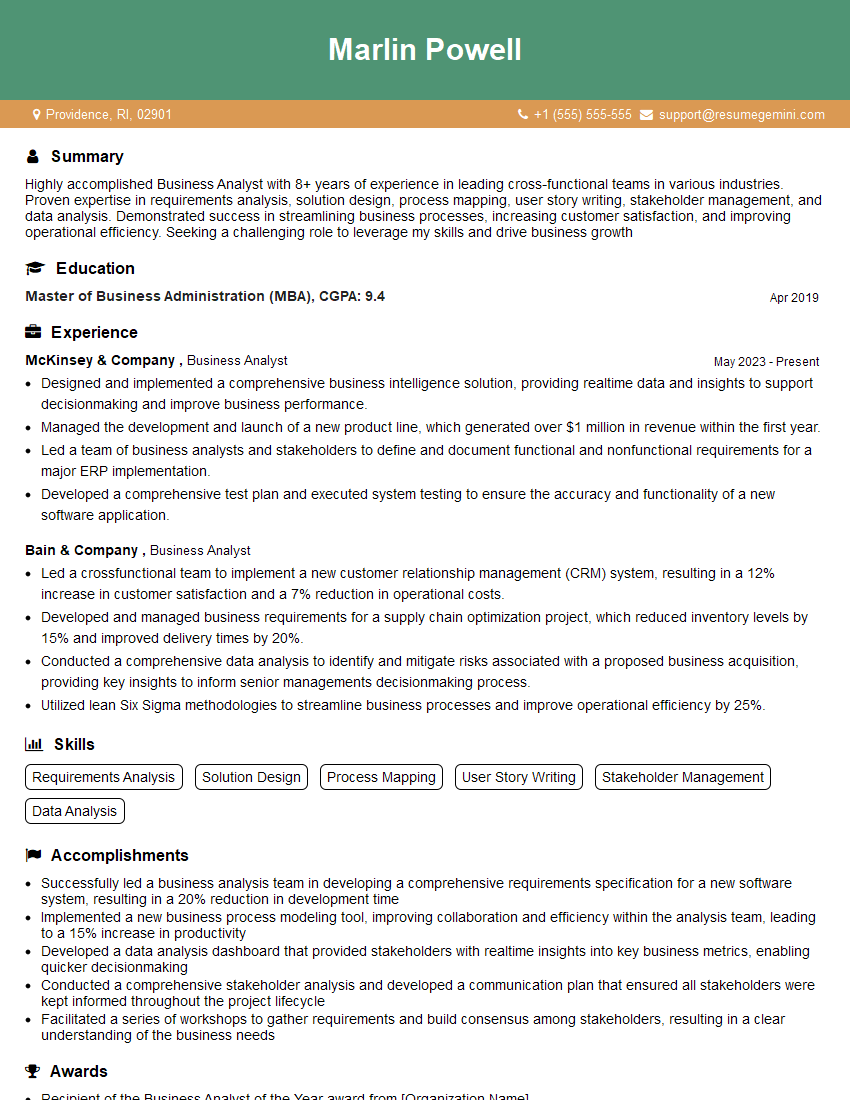
Business Analyst Resume Sample
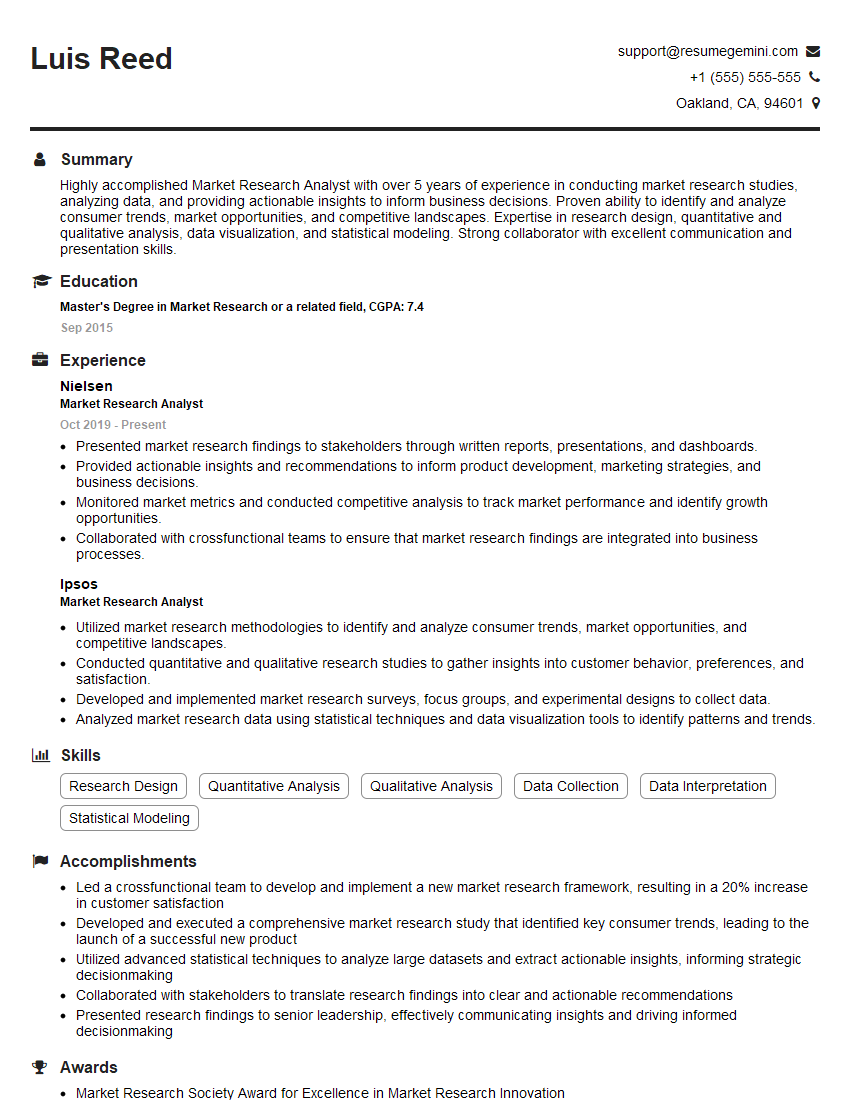
Market Research Analyst Resume Sample
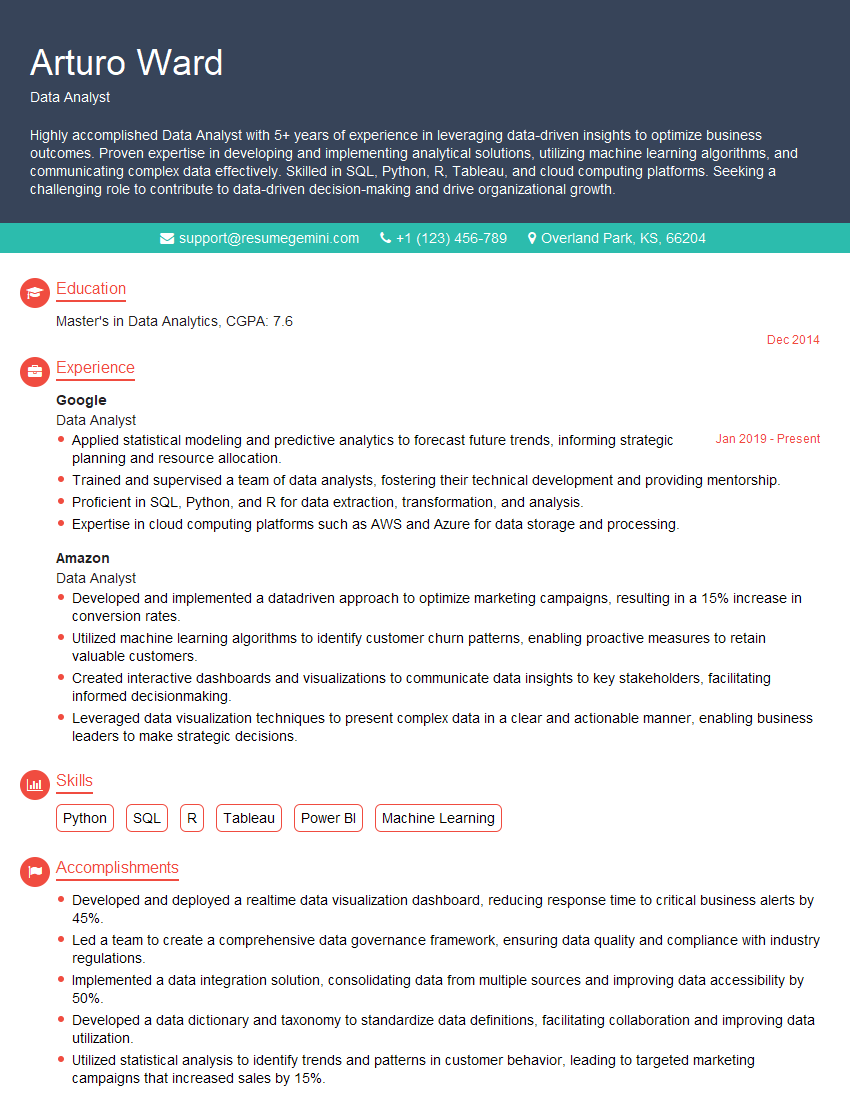
Data Analyst Resume Sample
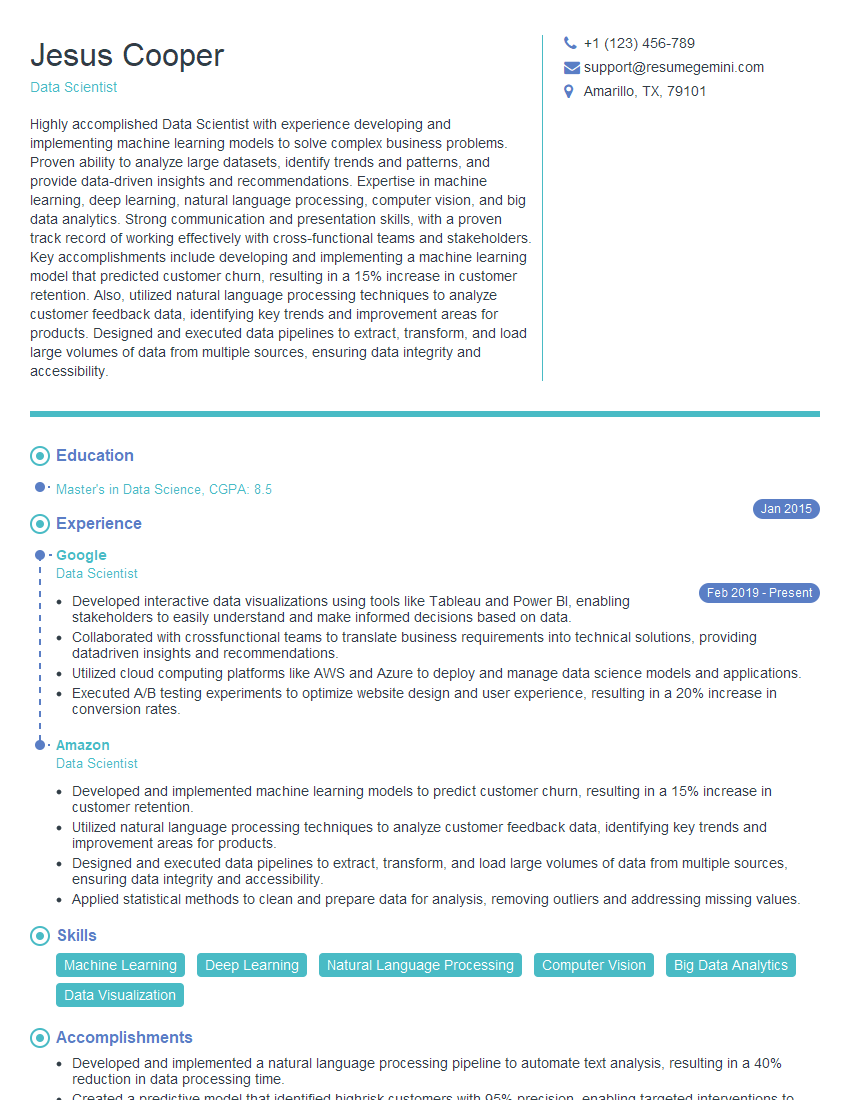
Data Scientist Resume Sample
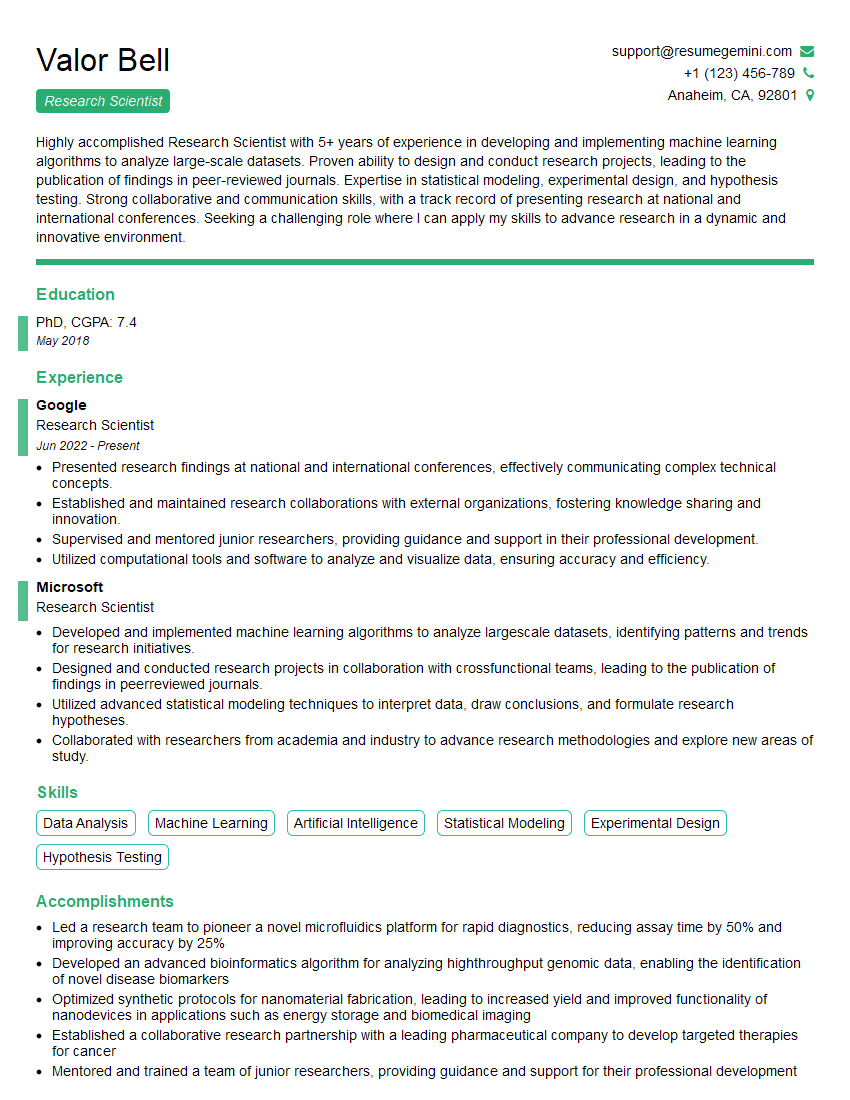
Research Scientist Resume Sample
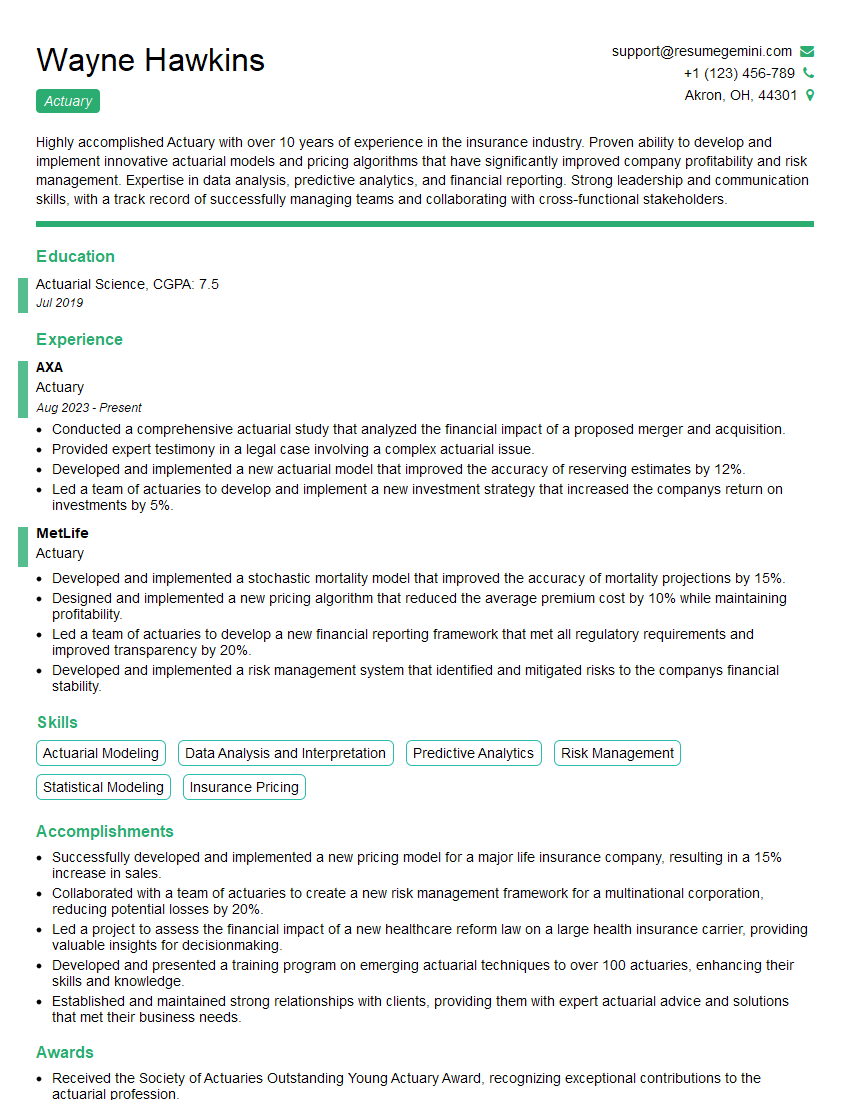
Actuary Resume Sample
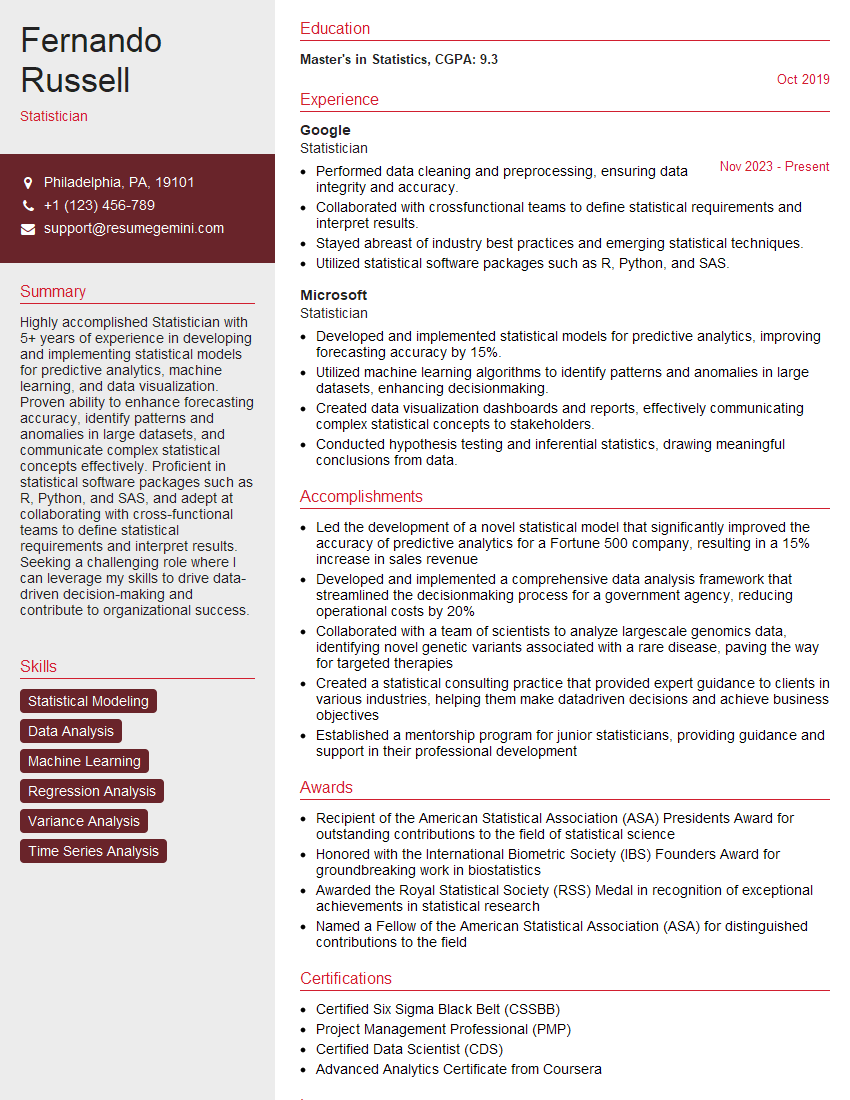
Statistician Resume Sample
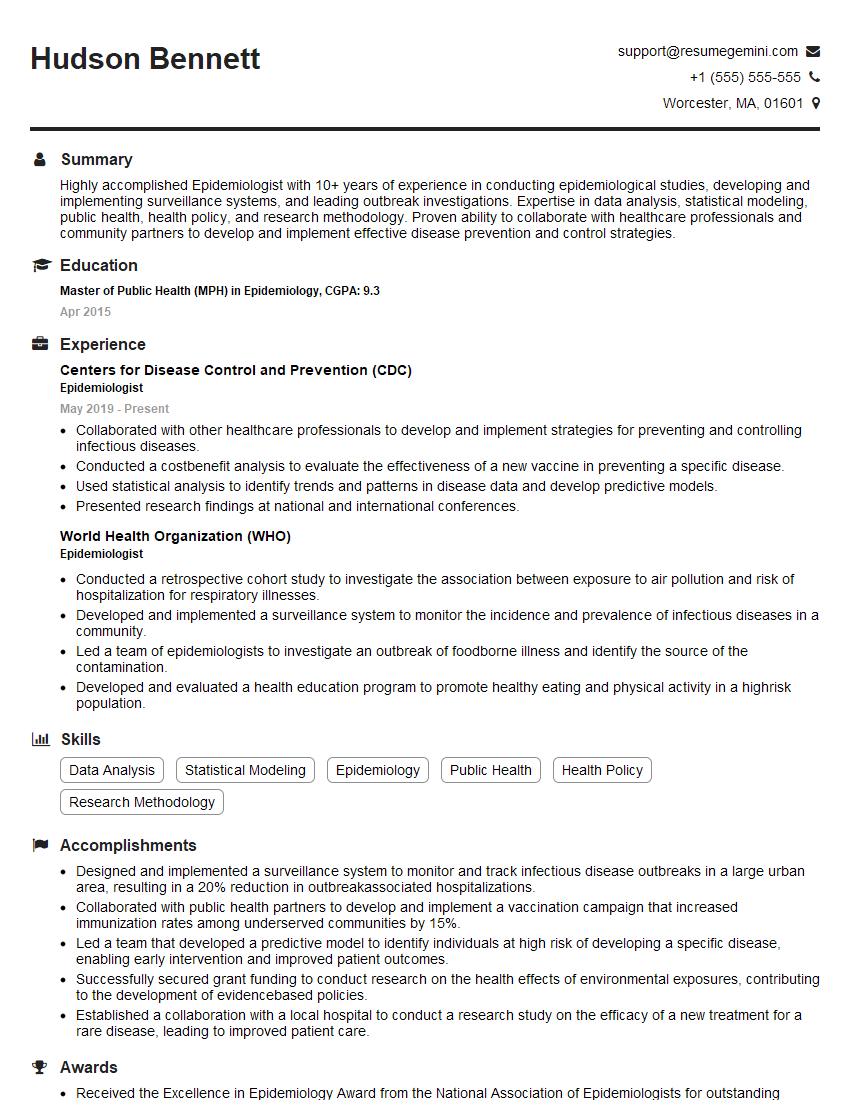
Epidemiologist Resume Sample
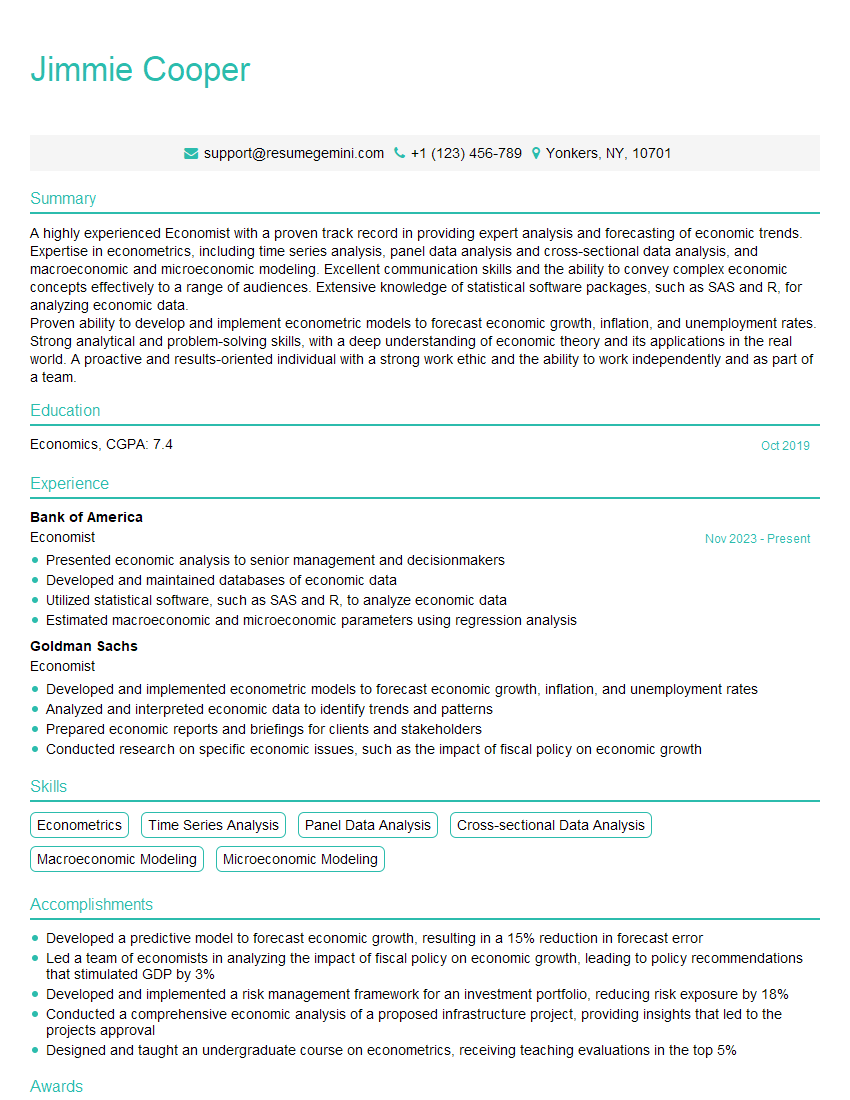
Economist Resume Sample
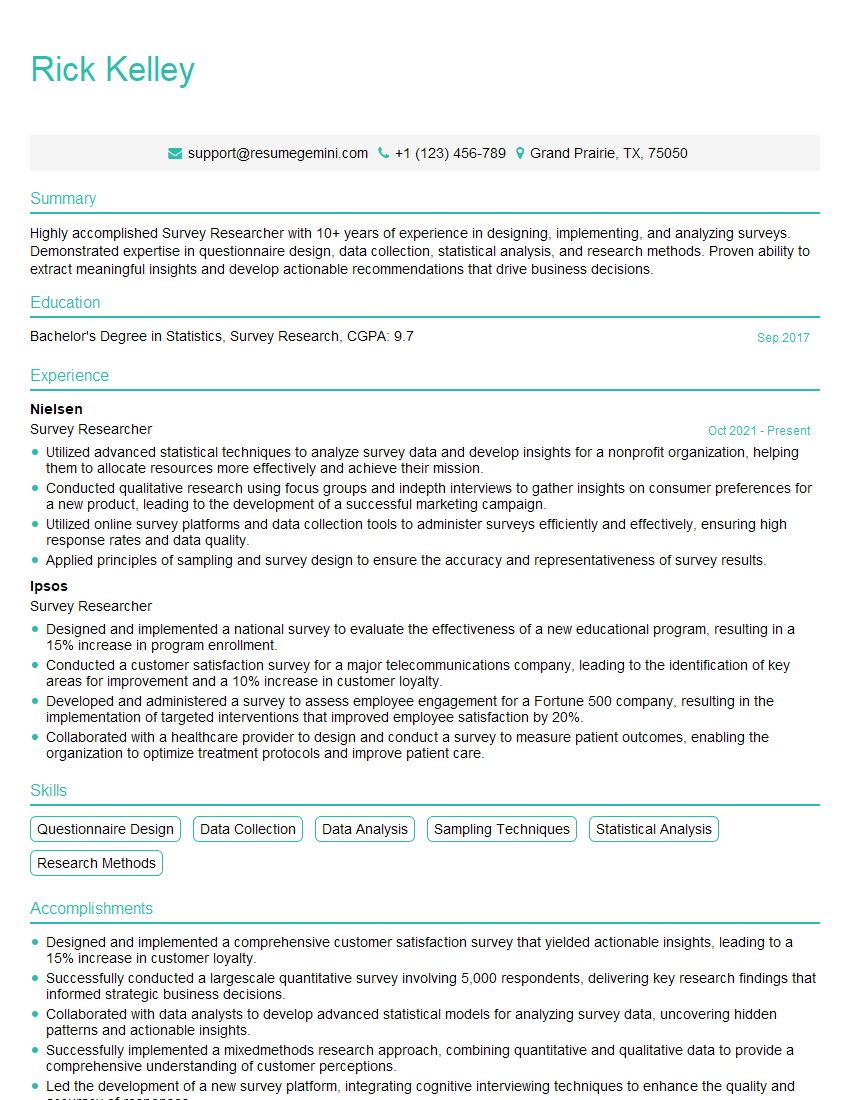
Survey Researcher Resume Sample
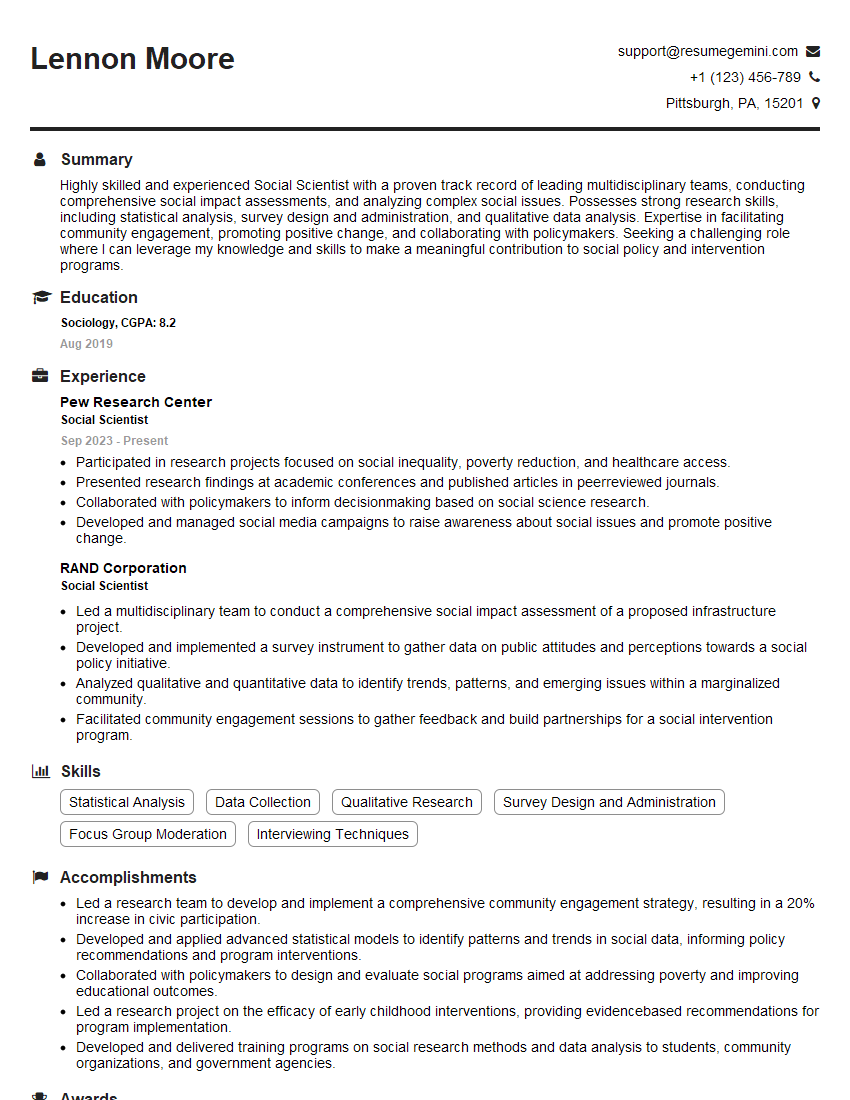
Social Scientist Resume Sample
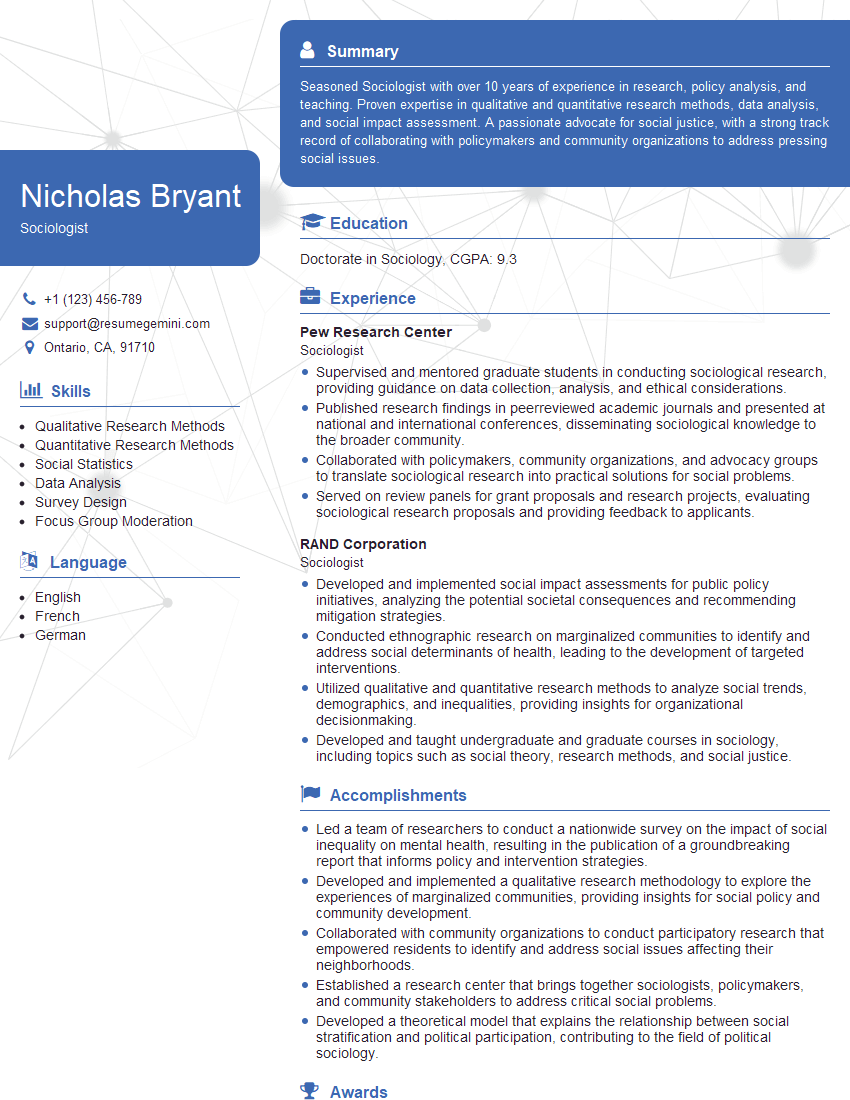
Sociologist Resume Sample
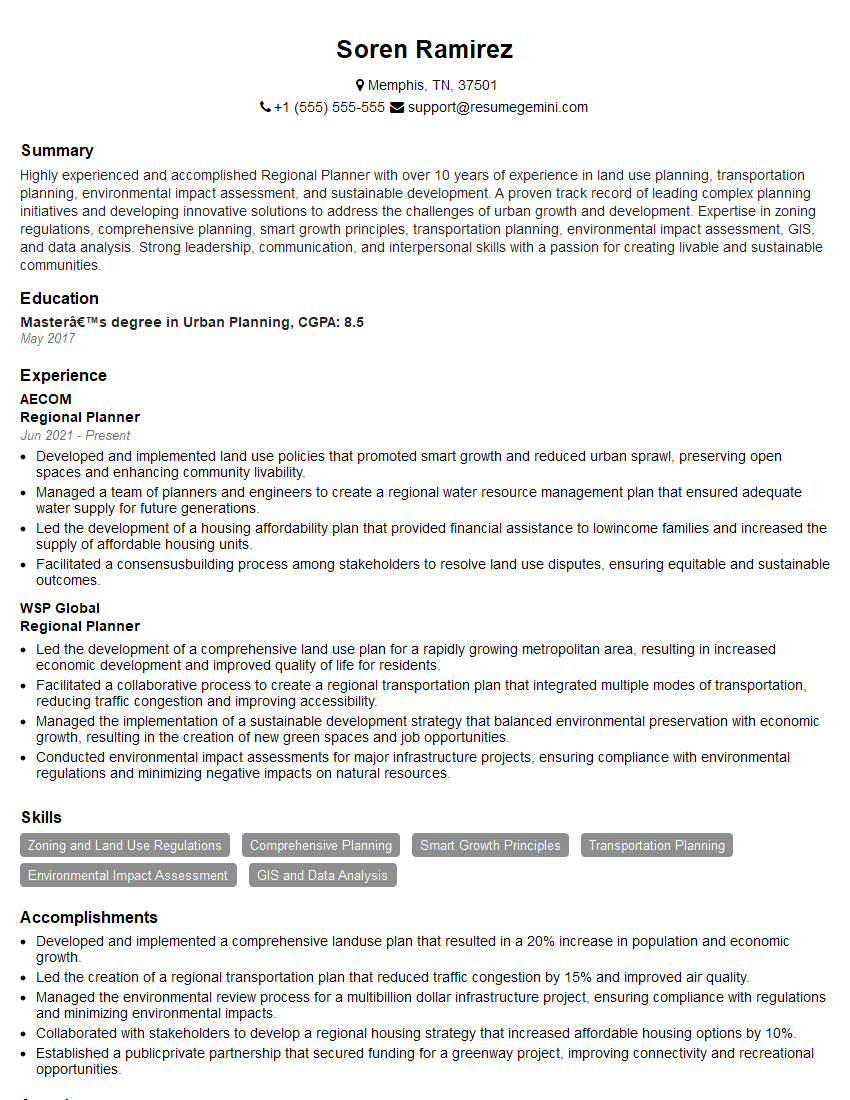
Regional Planner Resume Sample
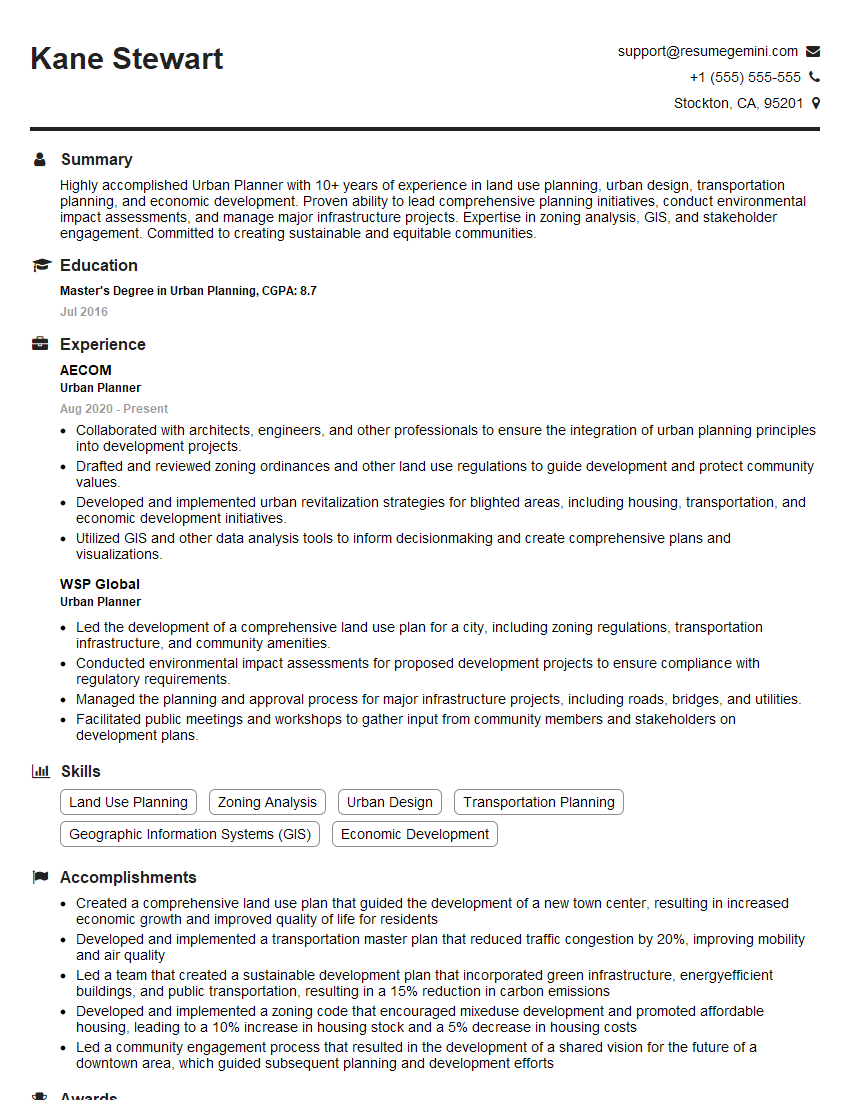
Urban Planner Resume Sample
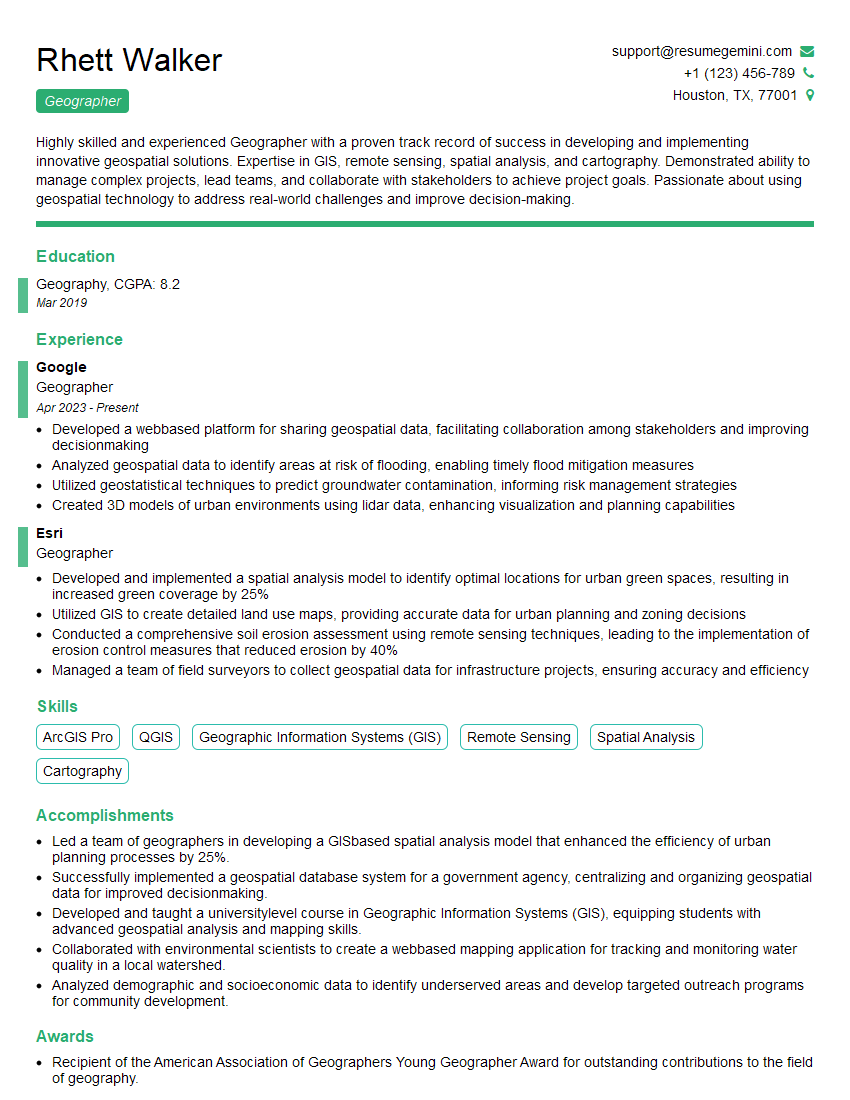
Geographer Resume Sample
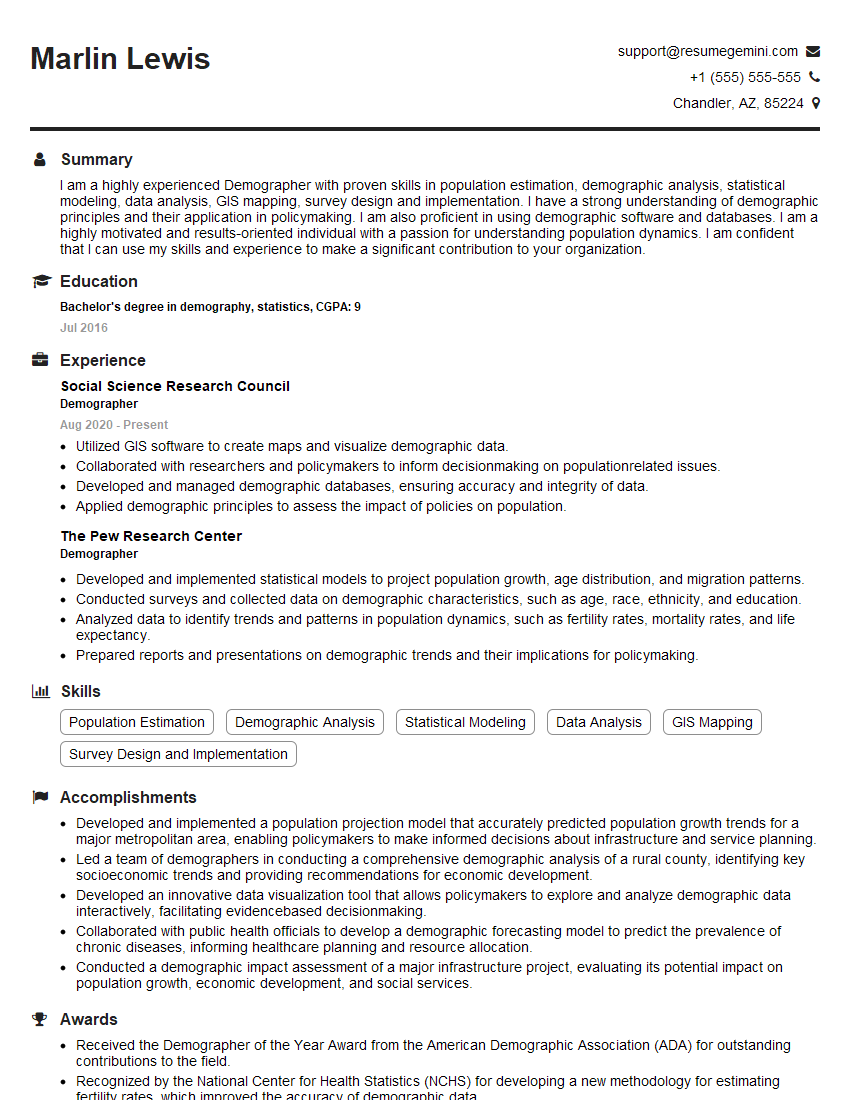
Demographer Resume Sample

Public Health Analyst Resume Sample
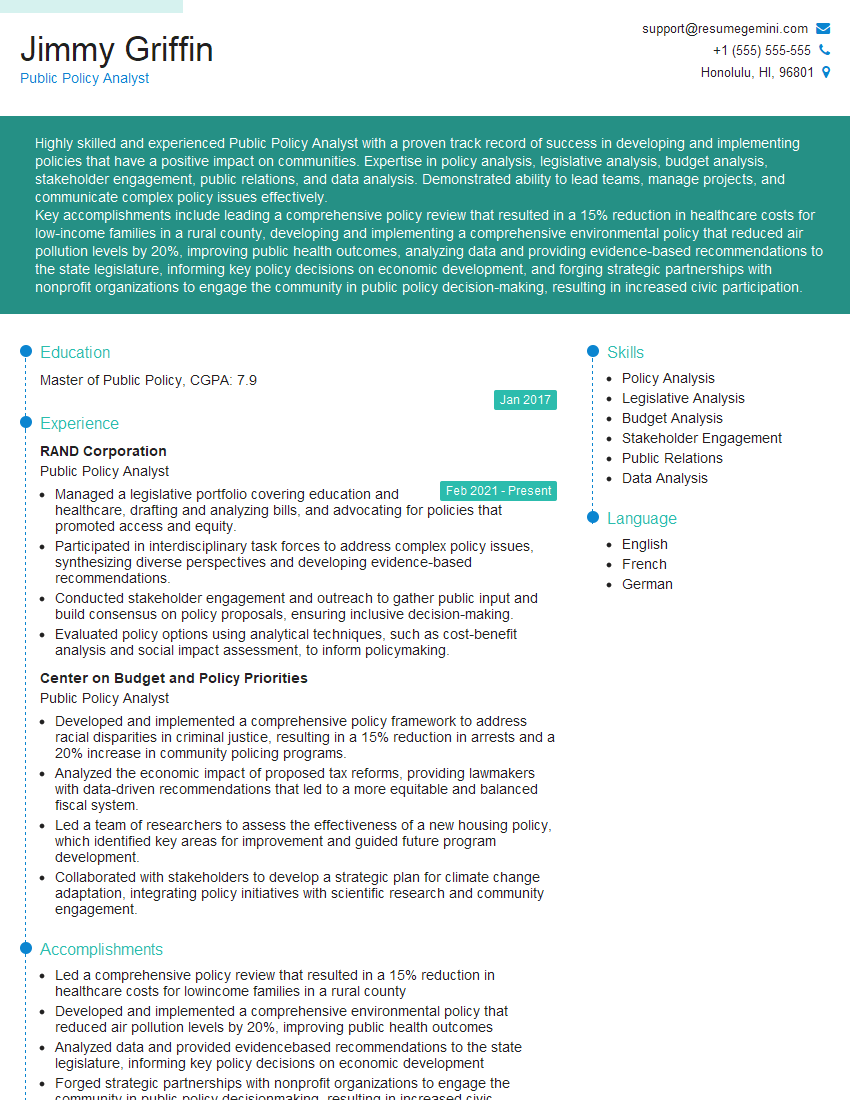
Public Policy Analyst Resume Sample
Explore more articles
Users Rating of Our Blogs
Share Your Experience
We value your feedback! Please rate our content and share your thoughts (optional).
What Readers Say About Our Blog
To the interviewgemini.com Webmaster.
Very helpful and content specific questions to help prepare me for my interview!
Thank you
To the interviewgemini.com Webmaster.
This was kind of a unique content I found around the specialized skills. Very helpful questions and good detailed answers.
Very Helpful blog, thank you Interviewgemini team.