The right preparation can turn an interview into an opportunity to showcase your expertise. This guide to Outcome Measurement and Quality Improvement interview questions is your ultimate resource, providing key insights and tips to help you ace your responses and stand out as a top candidate.
Questions Asked in Outcome Measurement and Quality Improvement Interview
Q 1. Define outcome measurement and its significance in healthcare.
Outcome measurement is the systematic process of collecting and analyzing data to determine the impact of healthcare interventions on patients’ health status. It’s crucial because it helps us understand whether our efforts are actually improving patient outcomes. Without outcome measurement, we’re essentially working in the dark, unable to determine what works and what doesn’t. For example, a new diabetes management program might track patients’ HbA1c levels (a measure of blood sugar control) over time to see if the program effectively lowers these levels. This allows for evidence-based adjustments and improvements to the program.
Its significance in healthcare is multifaceted: it guides resource allocation, improves clinical practice, enhances accountability, drives quality improvement initiatives, supports evidence-based decision-making, and ultimately, contributes to better patient care.
Q 2. Explain the difference between process measures and outcome measures.
Process measures and outcome measures are both important in quality improvement, but they focus on different aspects of care. Process measures assess how care is delivered. They look at the steps and activities involved in providing a service. An example is the percentage of patients receiving a particular medication within a certain timeframe. These measures don’t necessarily tell us about the impact on the patient’s health, only if the steps were followed correctly.
Outcome measures, on the other hand, assess the results of care. They focus on the patient’s health status and well-being following an intervention. For instance, measuring patient survival rates after a heart surgery is an outcome measure. It directly reflects the impact of the intervention on the patient’s health. The difference can be visualized like this: process measures are about the ‘doing,’ while outcome measures are about the ‘resulting’.
Q 3. Describe the various methodologies used for outcome measurement.
Several methodologies are used for outcome measurement. The choice depends on the specific outcome being measured and the context. Some common ones include:
- Surveys and questionnaires: These are used to collect patient-reported outcomes (PROs), such as quality of life, satisfaction, or symptom burden. Examples include SF-36 (a generic health survey) or disease-specific questionnaires.
- Clinical data extraction: This involves reviewing medical records to identify relevant data, such as diagnoses, lab results, and treatment received. It’s often used to measure objective outcomes like mortality rates or readmission rates.
- Administrative data: Information from databases like hospital discharge records or claims data can be analyzed to understand trends and measure outcomes at a population level. This data is often readily available but can be limited in detail.
- Observational studies: These involve observing and documenting patient outcomes without intervening. Cohort studies and case-control studies fall under this category and are often used to investigate the impact of different exposures or treatments.
- Randomized controlled trials (RCTs): The gold standard for assessing the effectiveness of an intervention, these trials involve randomly assigning participants to either an intervention or a control group. The results are compared to determine the intervention’s impact.
Often, a mixed-methods approach, combining several of these methodologies, provides a more comprehensive understanding of the outcomes.
Q 4. How do you identify key performance indicators (KPIs) for a quality improvement project?
Identifying key performance indicators (KPIs) is crucial for a successful quality improvement project. It requires a structured approach:
- Define the project goal: What are you trying to achieve? For example, reducing hospital-acquired infections or improving patient satisfaction.
- Identify stakeholders: Who will be impacted by the project? Their input is essential in identifying relevant KPIs.
- Select relevant measures: Choose KPIs that directly reflect the project’s goal and are measurable, achievable, relevant, and time-bound (SMART). Consider both process and outcome measures. For example, if reducing hospital-acquired infections is the goal, KPIs could include hand hygiene compliance rate (process) and infection rate (outcome).
- Establish baseline data: Collect data to determine the current performance level before implementing any interventions. This provides a benchmark against which to compare future results.
- Set targets: Establish realistic and ambitious targets for improvement. The targets should be based on evidence and best practices.
For instance, in a project aiming to reduce patient wait times, KPIs might include average wait time, patient satisfaction with wait times, and the number of patients seen within a specific timeframe.
Q 5. What are the common challenges in implementing outcome measurement systems?
Implementing outcome measurement systems faces several challenges:
- Data collection difficulties: Collecting reliable and complete data can be time-consuming and resource-intensive. Missing data or inaccurate recording can significantly impact the results.
- Defining meaningful outcomes: Selecting the right outcomes to measure can be challenging. Outcomes should be relevant, clinically significant, and readily measurable.
- Data analysis complexity: Analyzing large datasets can be complex, requiring specialized statistical expertise. Improper analysis can lead to misleading conclusions.
- Lack of resources: Implementing an outcome measurement system requires financial and human resources for data collection, analysis, and reporting.
- Resistance to change: Healthcare professionals may resist changes to established practices, even if data shows the need for improvement.
- Attribution challenges: Determining the true cause of an outcome can be challenging, especially when multiple factors are involved. It is difficult to isolate the effect of a single intervention.
Addressing these challenges requires careful planning, stakeholder engagement, adequate resources, and a commitment to data-driven decision-making.
Q 6. Explain the role of data analysis in outcome measurement and quality improvement.
Data analysis plays a pivotal role in outcome measurement and quality improvement. It allows us to transform raw data into meaningful insights that guide decision-making. Through data analysis, we can:
- Identify trends and patterns: Analyze data to identify trends in patient outcomes over time, revealing areas of strength and weakness.
- Assess the effectiveness of interventions: Determine whether implemented interventions had a positive impact on patient outcomes.
- Compare performance against benchmarks: Compare performance to national or regional averages to identify areas for improvement.
- Detect outliers and anomalies: Identify unusual results that may warrant further investigation.
- Predict future outcomes: Use statistical modeling to predict future outcomes and plan resources effectively.
Different analytical techniques may be used, including descriptive statistics (means, medians, standard deviations), inferential statistics (t-tests, ANOVA, regression analysis), and more advanced techniques like predictive modeling. The specific methods will depend on the research question and the nature of the data.
Q 7. Describe your experience with statistical process control (SPC).
Statistical Process Control (SPC) is a powerful tool for monitoring processes and identifying areas for improvement. My experience with SPC involves using control charts to track key process measures over time. Control charts visually represent data, allowing for the identification of patterns and trends, such as shifts or drifts in process performance. For example, I used a control chart to monitor the average wait time in a clinic. This chart showed that while the wait time was generally stable, there was a noticeable increase in wait times during certain periods. Further investigation identified staff shortages during those times as the root cause. This led to adjustments in scheduling and staffing, resulting in reduced wait times.
I’ve applied SPC in various healthcare settings, including surgical suites, intensive care units, and outpatient clinics. It’s been invaluable in identifying and resolving issues related to medication errors, patient safety, and process efficiency. I’m proficient in interpreting control charts, understanding control limits, and using the data to drive process improvement. Beyond just using the charts, I emphasize the importance of understanding the process, identifying assignable causes of variation, and using data-driven approaches for problem-solving.
Q 8. How do you ensure the reliability and validity of outcome data?
Ensuring the reliability and validity of outcome data is paramount in Outcome Measurement and Quality Improvement. Reliability refers to the consistency of the data; will we get the same results if we measure the same thing again? Validity refers to whether we’re actually measuring what we intend to measure. We achieve this through a multi-pronged approach:
- Standardized Data Collection Methods: Using pre-defined protocols, questionnaires, or observation checklists minimizes bias and ensures consistency across measurements. For instance, instead of relying on subjective descriptions of patient pain, we’d use a validated pain scale like the Numerical Rating Scale (NRS).
- Inter-rater Reliability: When multiple assessors are involved, we train them rigorously and conduct inter-rater reliability checks to ensure consistent interpretation of data. For example, if we are measuring patient satisfaction through interviews, multiple interviewers should reach similar conclusions about the same interviewee.
- Pilot Testing: Before large-scale data collection, we conduct pilot tests to identify and refine our methods. This helps us detect flaws in our instruments or protocols, ensuring we are collecting accurate data.
- Triangulation: Using multiple sources of data (e.g., surveys, medical records, clinical observations) helps to validate the findings. If all sources point to the same conclusion, it strengthens the validity of our measurements.
- Statistical Analysis: Appropriate statistical methods are used to assess reliability (e.g., Cronbach’s alpha for internal consistency) and validity (e.g., correlation with a gold standard measure). We also look for potential outliers and biases within the data itself.
Ignoring these steps can lead to inaccurate conclusions, ineffective interventions, and wasted resources. A robust data collection and analysis plan is fundamental to any successful quality improvement initiative.
Q 9. Explain the concept of root cause analysis and its application in quality improvement.
Root Cause Analysis (RCA) is a systematic process used to identify the underlying causes of problems, not just the symptoms. It’s crucial for effective quality improvement because addressing only surface-level issues often fails to prevent recurrence. Think of it like treating a fever without diagnosing the underlying infection – the fever will likely return.
There are various RCA methods, but a common approach involves the ‘5 Whys’. We repeatedly ask ‘why’ to delve deeper into the cause of an event until we reach the root cause. For example:
- Problem: High patient wait times in the emergency room.
- Why 1: Insufficient staffing.
- Why 2: High staff turnover.
- Why 3: Low employee morale.
- Why 4: Lack of management support and recognition.
- Why 5: Poor communication and insufficient leadership training within the management team.
In this example, simply increasing staffing (Why 1) would likely be a temporary fix. Addressing the root cause (Why 5) requires a long-term strategy to improve management practices and increase employee satisfaction.
Other methods include Fishbone diagrams (Ishikawa diagrams) which visually map out potential causes contributing to a problem, and Fault Tree Analysis which identifies multiple failure points and their potential combinations that lead to an undesirable outcome. The selected method depends on the complexity of the problem and the resources available.
Q 10. Describe your experience with Lean Six Sigma methodologies.
I have extensive experience applying Lean Six Sigma methodologies to improve processes and reduce variation. Lean principles focus on eliminating waste and maximizing value, while Six Sigma aims to reduce defects to a level of 3.4 defects per million opportunities (DPMO).
In a previous role, we used DMAIC (Define, Measure, Analyze, Improve, Control) to streamline our patient admission process.
- Define: We clearly defined the problem – excessive wait times for patients to be admitted.
- Measure: We collected data on wait times, identifying bottlenecks and key performance indicators (KPIs).
- Analyze: We used statistical tools like control charts and Pareto charts to identify root causes, finding that inadequate staffing during peak hours and inefficient paperwork processes were the major contributors.
- Improve: We implemented several improvements, including optimizing staffing schedules, using electronic documentation, and redesigning the admission forms.
- Control: We established monitoring systems to track wait times and ensure that the improvements were sustained. We also developed a process for handling unexpected surges in patient volume.
This project significantly reduced wait times, improved patient satisfaction, and freed up staff to focus on patient care. My experience also encompasses the use of other Lean Six Sigma tools like value stream mapping, 5S methodology, and Kaizen events.
Q 11. How do you measure the effectiveness of a quality improvement initiative?
Measuring the effectiveness of a quality improvement initiative requires a well-defined set of metrics and a clear understanding of the desired outcomes. We shouldn’t just rely on anecdotal evidence; we need objective data to demonstrate impact.
Methods include:
- Process Metrics: These track the efficiency and effectiveness of the improved process. Examples include cycle time reduction, defect rates, throughput, and cost savings.
- Outcome Metrics: These measure the impact on patients, customers, or other stakeholders. Examples include patient satisfaction scores, readmission rates, mortality rates, and improved productivity.
- Before-and-After Comparisons: We compare the performance metrics before and after implementing the improvement to demonstrate the impact. Control groups can also be used for comparison.
- Statistical Significance Testing: We use statistical tests (e.g., t-tests, ANOVA) to determine if observed changes are statistically significant and not due to random variation.
- Return on Investment (ROI): Calculating the ROI helps justify the investment in the quality improvement initiative by quantifying cost savings or revenue gains.
It is crucial to select relevant and measurable metrics aligned with the initiative’s goals. Regular monitoring of these metrics is also necessary to track progress and make necessary adjustments.
Q 12. What is the Plan-Do-Study-Act (PDSA) cycle, and how have you used it?
The Plan-Do-Study-Act (PDSA) cycle is an iterative quality improvement model that emphasizes continuous learning and improvement. It’s a simple yet powerful framework for testing changes and evaluating their impact on a small scale before broader implementation.
- Plan: Define the problem, objectives, and the change to be tested. Develop a detailed plan including data collection methods.
- Do: Implement the change on a small scale, collect data, and document observations.
- Study: Analyze the data collected. Did the change achieve the intended results? What were the unexpected outcomes?
- Act: Based on the study phase, decide whether to adopt, modify, or abandon the change. Implement the change more broadly if successful, or revise the plan and start a new PDSA cycle.
I have used the PDSA cycle extensively in various projects. In one instance, we were trying to reduce medication errors on a particular ward. We planned a small change – introducing a new medication labeling system on one unit. We implemented it (Do), collected data on medication errors (Study), and found a significant reduction. Based on this, we acted by implementing the new system across the entire hospital (Act).
The beauty of PDSA is its iterative nature; it allows for continuous refinement and learning. It’s particularly useful for complex problems where a single solution isn’t immediately apparent.
Q 13. Explain your experience with change management in quality improvement projects.
Change management is a critical aspect of successful quality improvement projects. Even the best-designed improvements will fail if people don’t adopt and utilize them. My approach to change management incorporates several key principles:
- Stakeholder Engagement: Involving key stakeholders (staff, patients, management) from the start helps to build buy-in and ownership. Active listening and addressing concerns are crucial.
- Communication: Clear and consistent communication is essential throughout the entire process. This includes explaining the rationale for the change, the benefits, and how it will affect individuals. Using multiple communication channels (e.g., meetings, emails, newsletters) ensures information reaches everyone.
- Training and Support: Providing adequate training and ongoing support ensures that staff feel confident in using the new processes or systems. Offering opportunities for feedback and adjustments can improve the effectiveness of the training.
- Incentives and Recognition: Recognizing and rewarding staff participation and contributions can boost morale and encourage adoption of the changes.
- Leadership Support: Visible support from leadership is essential to demonstrate commitment to the change initiative and to overcome resistance from individuals or departments.
Ignoring change management can lead to resistance, low adoption rates, and ultimately, failure of the quality improvement project. A proactive and well-planned change management strategy ensures a smoother transition and maximizes the chances of success.
Q 14. How do you communicate complex data and findings to diverse audiences?
Communicating complex data and findings to diverse audiences requires tailoring the message to the audience’s level of understanding and their specific needs. Simply presenting raw data is rarely effective. I utilize a variety of techniques:
- Visualizations: Graphs, charts, and infographics are powerful tools for conveying complex information in a concise and easily digestible format. Choosing the right type of visualization (e.g., bar chart, scatter plot, line graph) depends on the data and the message.
- Storytelling: Framing data within a compelling narrative helps to engage the audience and make the information more memorable. This involves using real-life examples, anecdotes, and relatable scenarios.
- Plain Language: Avoiding jargon and technical terms ensures that the message is clear and understandable to everyone, regardless of their background.
- Interactive Presentations: Using interactive elements like quizzes or polls can keep the audience engaged and facilitate understanding.
- Tailored Presentations: Presenting information differently based on the audience (e.g., a detailed technical report for experts versus a summary for non-technical stakeholders) is crucial for effective communication.
- Data Summaries and Key Messages: Focusing on key findings and presenting data in a summarized form simplifies the information for audiences with limited time or attention span.
By using a combination of these techniques, I ensure that the key messages are clear, concise, and resonate with the intended audience, regardless of their background or level of expertise. This ultimately ensures that the findings of the quality improvement initiative are effectively used to drive change and improve outcomes.
Q 15. Describe a situation where you had to overcome a challenge in a quality improvement project.
In a recent project aimed at reducing hospital readmission rates for heart failure patients, we encountered significant resistance from the nursing staff to adopt a new, evidence-based discharge planning protocol. The nurses, accustomed to their established workflows, perceived the new protocol as overly complex and time-consuming. This created a significant challenge to the project’s success.
To overcome this, we employed a multi-pronged approach. First, we actively engaged the nursing staff in the design and implementation process, soliciting their feedback and addressing their concerns. We held several workshops where we demonstrated the protocol’s simplicity through role-playing and hands-on training. Second, we leveraged data visualization tools to show the clear link between the protocol and a reduction in readmission rates in pilot programs. Finally, we celebrated early successes and acknowledged the staff’s contributions to build momentum and foster a sense of ownership. This collaborative approach gradually built trust and acceptance, leading to the successful implementation of the new protocol and a demonstrable reduction in readmission rates.
Career Expert Tips:
- Ace those interviews! Prepare effectively by reviewing the Top 50 Most Common Interview Questions on ResumeGemini.
- Navigate your job search with confidence! Explore a wide range of Career Tips on ResumeGemini. Learn about common challenges and recommendations to overcome them.
- Craft the perfect resume! Master the Art of Resume Writing with ResumeGemini’s guide. Showcase your unique qualifications and achievements effectively.
- Don’t miss out on holiday savings! Build your dream resume with ResumeGemini’s ATS optimized templates.
Q 16. How do you prioritize competing quality improvement initiatives?
Prioritizing competing quality improvement initiatives requires a structured approach. I typically use a matrix that considers three key factors: urgency, impact, and feasibility. Urgency refers to the immediate need for improvement, often driven by patient safety concerns or regulatory mandates. Impact considers the potential positive change on patient outcomes and resource utilization. Feasibility assesses the available resources, time constraints, and the likelihood of successful implementation.
Each initiative is then scored on these three factors, and a weighted average is calculated to determine the priority. For instance, a high-urgency, high-impact initiative with high feasibility will rank highest. This allows for a data-driven decision, minimizing bias and ensuring that resources are focused on the projects that will yield the greatest return. This matrix is also regularly reviewed and updated as new information becomes available or priorities shift.
Q 17. What are some common quality improvement frameworks you are familiar with?
I’m proficient in several quality improvement frameworks, each offering unique strengths depending on the context. These include:
- Plan-Do-Study-Act (PDSA): A cyclical model ideal for iterative improvements, allowing for rapid testing and adjustments. I often use this for smaller, localized projects.
- Model for Improvement (MFI): This framework, focused on asking three key questions—What are we trying to accomplish? How will we know that a change is an improvement? What changes can we make that will result in improvement?— provides a clear structure for defining aims and measuring progress. I find this framework especially helpful for larger-scale projects.
- Lean Methodology: Concentrating on eliminating waste and improving efficiency, Lean is beneficial for streamlining processes and reducing bottlenecks. It’s particularly useful in operational settings.
- Six Sigma: A data-driven approach focusing on reducing variation and defects, Six Sigma is ideal for projects requiring precise measurement and statistical analysis. It is particularly useful for process optimization.
My choice of framework depends on the specific project goals, the available data, and the organizational context.
Q 18. Describe your experience with data visualization tools.
I’m experienced with several data visualization tools, including Tableau, Power BI, and R. I choose the tool based on the complexity of the data, the desired level of interactivity, and the audience for the visualization. For instance, Tableau is excellent for creating interactive dashboards that can be easily shared with non-technical stakeholders. Power BI is particularly strong in integrating data from multiple sources. R provides greater flexibility for complex statistical analysis and custom visualizations.
In my work, I emphasize clear and concise visualizations that avoid overwhelming the audience with unnecessary details. My goal is to translate complex data into easily understood narratives that support informed decision-making. I’ve found that effectively visualizing data is crucial in communicating the impact of quality improvement initiatives.
Q 19. What are your preferred methods for collecting outcome data?
My preferred methods for collecting outcome data are multifaceted and depend on the specific outcome being measured. For example:
- Electronic Health Records (EHR): EHRs are a rich source of data for many clinical outcomes. I utilize structured data fields whenever possible to ensure accuracy and consistency. However, I am also aware of the limitations of EHR data and ensure that proper data validation and cleaning steps are employed.
- Surveys and Questionnaires: Patient-reported outcome measures (PROMs) are essential for capturing the patient experience. I design and administer surveys carefully, ensuring clarity and avoiding bias.
- Administrative Data: Data on hospital readmissions, length of stay, and other administrative metrics provide valuable context and are often used in conjunction with clinical and patient-reported data.
- Direct Observation: In some cases, direct observation of processes or workflows can be valuable in identifying areas for improvement.
It’s crucial to select data collection methods that are reliable, valid, and feasible, ensuring the data accurately reflects the intended outcome.
Q 20. How do you handle conflicting data or interpretations in outcome measurement?
Conflicting data or interpretations are inevitable in outcome measurement. My approach involves a systematic investigation to identify the source of the discrepancy. This often involves:
- Data Verification: A thorough review of data collection methods and data entry processes to identify any errors or biases.
- Statistical Analysis: Utilizing appropriate statistical tests to determine if differences are statistically significant or simply due to random variation.
- Qualitative Data Collection: Gathering qualitative data, such as through interviews with stakeholders, to understand the context and potential explanations for the conflicting findings.
- Transparency and Collaboration: Openly discussing the conflicting data with the project team and other stakeholders, collaboratively exploring potential explanations and developing a consensus interpretation.
Ultimately, the goal is to arrive at an interpretation that is well-supported by the evidence and accounts for potential limitations in the data. It’s essential to document the process and rationale behind the final interpretation.
Q 21. Explain your experience with regulatory requirements related to quality and outcomes.
My experience with regulatory requirements related to quality and outcomes is extensive. I’m familiar with regulations such as HIPAA (regarding patient data privacy), CMS (Centers for Medicare & Medicaid Services) requirements for reporting quality measures, and Joint Commission standards. I understand the importance of complying with these regulations to ensure patient safety and maintain the integrity of our quality improvement programs.
My work routinely involves designing and implementing systems to collect and report data in compliance with these regulations. This includes developing processes for data security, ensuring data accuracy, and preparing regular reports to regulatory bodies. I also stay updated on changes in regulations and best practices to ensure our programs remain compliant and effective. Understanding and adhering to these regulations is crucial for the success and sustainability of any quality improvement initiative.
Q 22. How do you ensure the sustainability of quality improvement efforts?
Ensuring the sustainability of quality improvement (QI) efforts requires a multifaceted approach that goes beyond simply implementing a new process. It’s about embedding QI into the very fabric of an organization’s culture and systems.
- Leadership Commitment: Sustained QI requires visible and unwavering support from top leadership. This includes allocating resources, championing QI initiatives, and holding individuals accountable for their roles in the improvement process. Without this buy-in, efforts will likely fizzle out.
- Team Ownership and Empowerment: QI initiatives should not be imposed from above; rather, they should be developed and owned by the teams directly involved in the work. Empowering staff to identify problems, design solutions, and implement changes fosters a sense of responsibility and commitment.
- Data-Driven Culture: A culture that values data and uses it to inform decision-making is crucial. This means establishing systems for collecting, analyzing, and reporting data on key performance indicators (KPIs) related to the QI efforts. Regular review of these data helps track progress and identify areas needing attention.
- Integration into Workflow: Sustainable QI requires integrating improvement efforts into the existing workflow, making them part of everyday practice rather than a separate project. This can involve changes to policies, procedures, and training.
- Continuous Learning and Improvement: QI is not a one-time event; it’s an ongoing process. Regular training, feedback mechanisms, and opportunities for reflection and adjustment ensure continuous learning and refinement of processes.
- Celebrating Successes: Recognizing and celebrating successes along the way reinforces positive behaviors and motivates teams to continue their QI work. This could involve awards, team meetings, or public acknowledgement of achievements.
For example, in a hospital setting, successfully implementing a new patient handoff protocol requires ongoing training for all staff, integration into electronic health records, and regular audits to ensure adherence. This consistent effort, supported by leadership and celebrated by the team, ensures long-term success.
Q 23. Describe your experience with performance improvement software or tools.
I have extensive experience with several performance improvement software tools, including electronic health record (EHR) systems with integrated QI modules, statistical software packages like R and SPSS, and dedicated QI platforms such as LeanKit and Kaizen.
EHR systems often provide dashboards for tracking key metrics, allowing for real-time monitoring of performance. Statistical software helps analyze data to identify trends and patterns, allowing for data-driven decision making. Dedicated QI platforms offer tools for project management, data visualization, and collaboration, facilitating the entire QI cycle.
For instance, in a previous role, I used R to analyze patient wait times in a clinic. By visualizing the data and applying statistical tests, we identified specific bottlenecks and implemented changes to reduce wait times by 20%. We then used the EHR system to track the impact of these changes over time.
Q 24. How do you measure patient satisfaction and its correlation to quality outcomes?
Measuring patient satisfaction and correlating it with quality outcomes requires a multi-pronged approach. We need to collect both quantitative and qualitative data.
- Quantitative Data: This involves using standardized surveys (e.g., the Hospital Consumer Assessment of Healthcare Providers and Systems (CAHPS) surveys) to collect numerical data on various aspects of patient experience, such as communication with providers, responsiveness of staff, and overall satisfaction. These scores can be compared against benchmarks and tracked over time.
- Qualitative Data: Qualitative data provides richer insights. This can include conducting focus groups, interviews, or analyzing open-ended comments from surveys to understand the reasons behind patient satisfaction or dissatisfaction. This helps to identify areas for improvement beyond simple numerical scores.
- Correlation Analysis: Once data is collected, statistical analysis is used to explore the correlation between patient satisfaction scores and quality outcomes. For instance, we might look at the relationship between patient satisfaction with pain management and readmission rates or between patient satisfaction with communication and adherence to treatment plans. This analysis helps establish whether improvements in patient experience translate into better health outcomes.
For example, a consistently low patient satisfaction score related to wait times might correlate with higher rates of patient dissatisfaction leading to missed appointments and poorer adherence to treatment plans. Addressing the wait time issue may improve satisfaction and subsequently lead to improved quality outcomes.
Q 25. How do you identify and address systemic issues contributing to poor outcomes?
Identifying and addressing systemic issues requires a structured approach involving data analysis, root cause analysis, and process improvement methodologies.
- Data Analysis: Start by analyzing data to identify patterns and trends that suggest systemic problems. This might involve examining rates of adverse events, complications, or other negative outcomes. Look for variations across different patient populations, locations, or time periods. Unusual patterns or outliers warrant further investigation.
- Root Cause Analysis (RCA): Once a problem is identified, conduct an RCA to understand the underlying causes. Techniques like the “five whys” or fishbone diagrams can help drill down to the root of the problem rather than just addressing symptoms. This process often involves engaging staff from different levels and departments to gain a holistic understanding.
- Process Improvement Methodologies: Once root causes are identified, utilize process improvement methodologies such as Lean, Six Sigma, or Plan-Do-Study-Act (PDSA) cycles to design and implement solutions. These methods provide a structured approach for developing, testing, and refining interventions.
- Change Management: Implementing system-wide changes requires careful planning and execution, involving stakeholder engagement, training, and communication. Success depends on effectively managing the transition and addressing any resistance to change.
For example, if a hospital sees a high rate of medication errors, a root cause analysis might reveal gaps in training, inadequate staffing levels, or poorly designed medication dispensing systems. This would then inform the implementation of solutions such as improved training programs, increased staffing, or a redesign of the medication dispensing process using PDSA cycles to iteratively test and refine the solution.
Q 26. What is your experience with benchmarking against industry standards?
Benchmarking against industry standards is a crucial part of quality improvement. It provides a context for evaluating an organization’s performance relative to its peers and identifying areas for improvement.
My experience includes using publicly available databases, industry reports, and professional organizations’ benchmarks to compare performance on various metrics. This involves selecting appropriate benchmarks, collecting and analyzing data, and then identifying gaps and opportunities for improvement. It’s important to select benchmarks that are relevant to the specific context and to consider factors that may influence performance such as patient demographics, case mix, and resource availability.
For instance, in a previous role, we benchmarked our hospital’s surgical infection rates against national averages published by the Centers for Disease Control and Prevention (CDC). Identifying that our rates were higher than the national average, we then used this information to launch a QI initiative focused on improving surgical practices and infection control protocols.
Q 27. Describe a time you successfully used data to influence a decision related to quality improvement.
In a previous role at a large outpatient clinic, we experienced consistently long patient wait times. Anecdotal evidence suggested scheduling inefficiencies were a primary contributor. However, to make a data-driven case for change, we collected detailed data on appointment durations, provider schedules, and patient arrival times over a three-month period.
Using statistical software, we analyzed the data and found that a significant portion of the delay stemmed from inconsistent appointment lengths and scheduling practices. The data revealed that some providers consistently ran over schedule while others consistently finished early. We presented this data to clinic leadership, showing specific examples of the impact of these scheduling inconsistencies on overall wait times. This data-driven approach persuaded leadership to implement a new scheduling system and staff training to better manage appointment durations. The result was a significant reduction in patient wait times, improved patient satisfaction, and increased clinic efficiency.
Key Topics to Learn for Outcome Measurement and Quality Improvement Interview
- Defining and Measuring Outcomes: Understand different outcome types (process, outcome, impact), selecting appropriate metrics, and developing robust measurement systems. Consider the nuances of quantitative and qualitative data collection.
- Data Analysis and Interpretation: Mastering descriptive and inferential statistics relevant to outcome measurement. Practice interpreting data visualizations and communicating findings effectively to diverse audiences.
- Quality Improvement Methodologies: Gain proficiency in frameworks like Plan-Do-Study-Act (PDSA), Lean, Six Sigma, and Model for Improvement. Be prepared to discuss their applications in real-world scenarios.
- Root Cause Analysis: Develop skills in identifying the underlying causes of problems using techniques such as fishbone diagrams, 5 Whys, and fault tree analysis. Practice applying these to quality improvement projects.
- Change Management and Implementation: Understand the principles of change management and how to effectively implement improvements. Consider strategies for overcoming resistance to change and sustaining improvements over time.
- Stakeholder Engagement and Communication: Discuss the importance of engaging stakeholders throughout the quality improvement process. Practice communicating complex information clearly and persuasively to different audiences.
- Performance Monitoring and Evaluation: Explain how to track progress towards improvement goals, evaluate the effectiveness of interventions, and make data-driven adjustments to strategies.
- Ethical Considerations in Quality Improvement: Understand the ethical implications of data collection, analysis, and reporting in quality improvement projects. Discuss issues of bias, confidentiality, and informed consent.
Next Steps
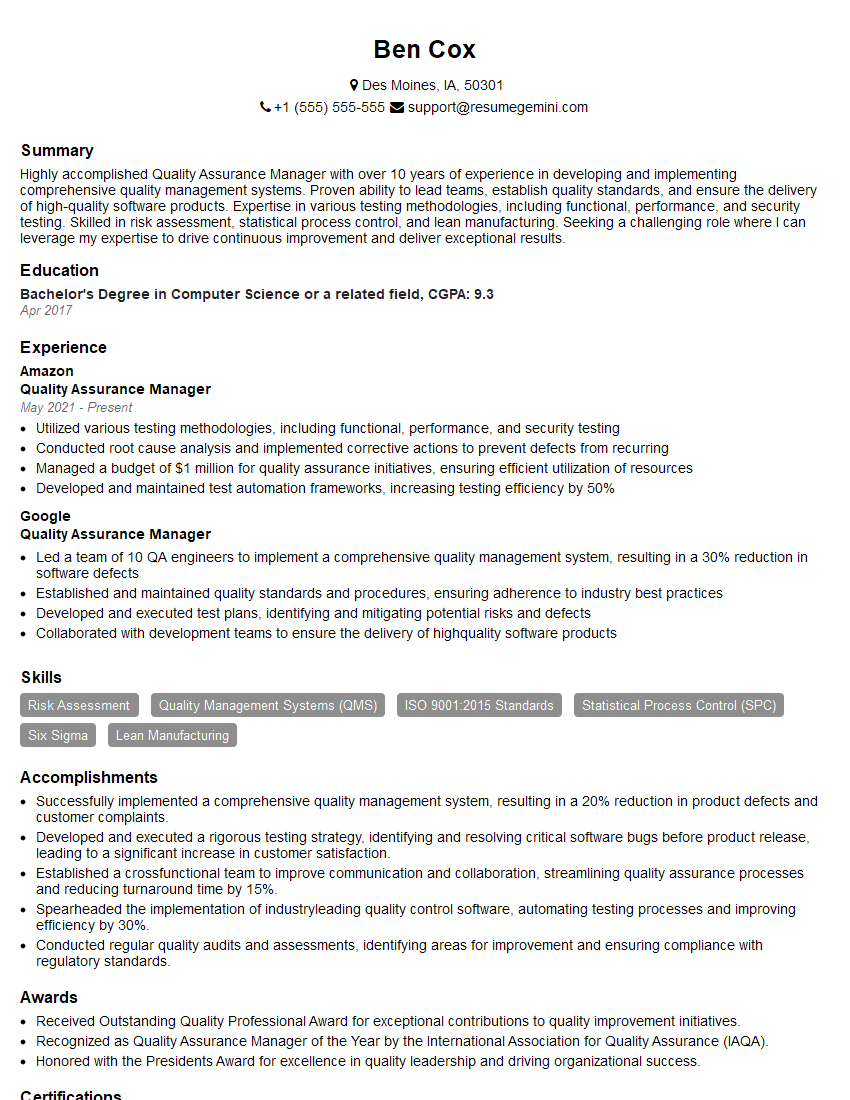
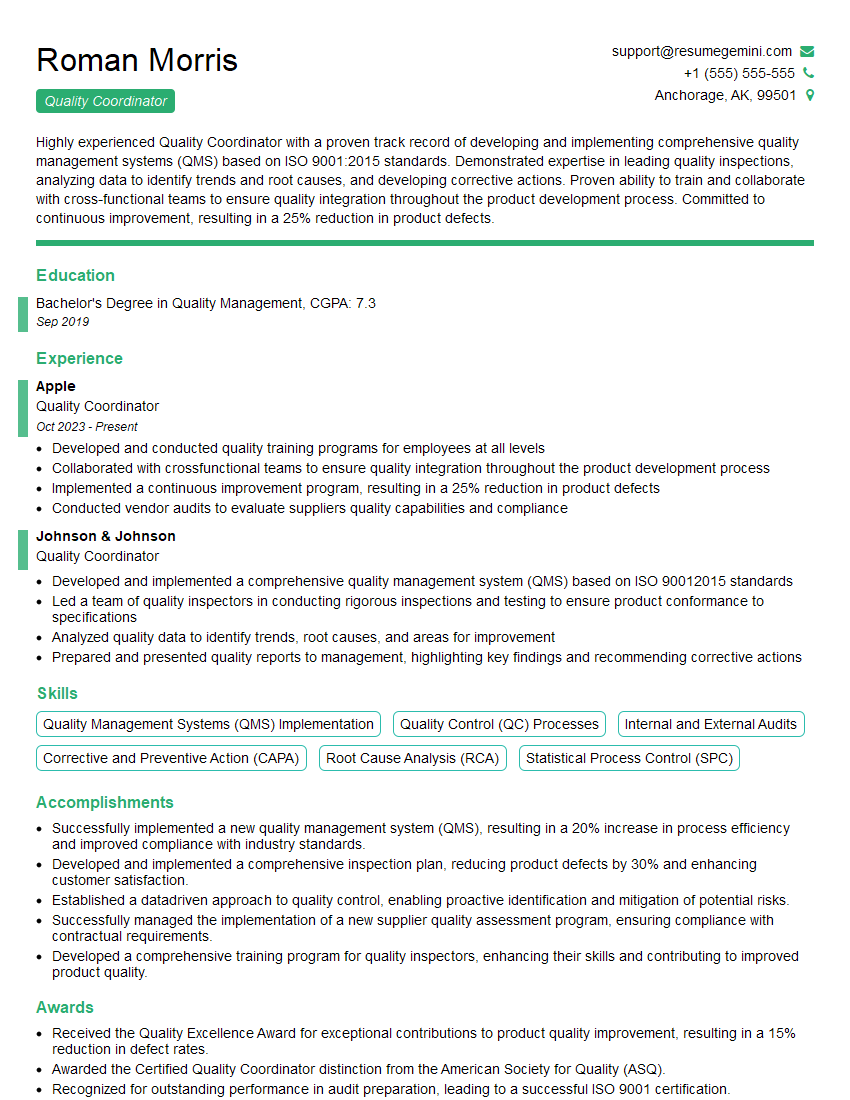
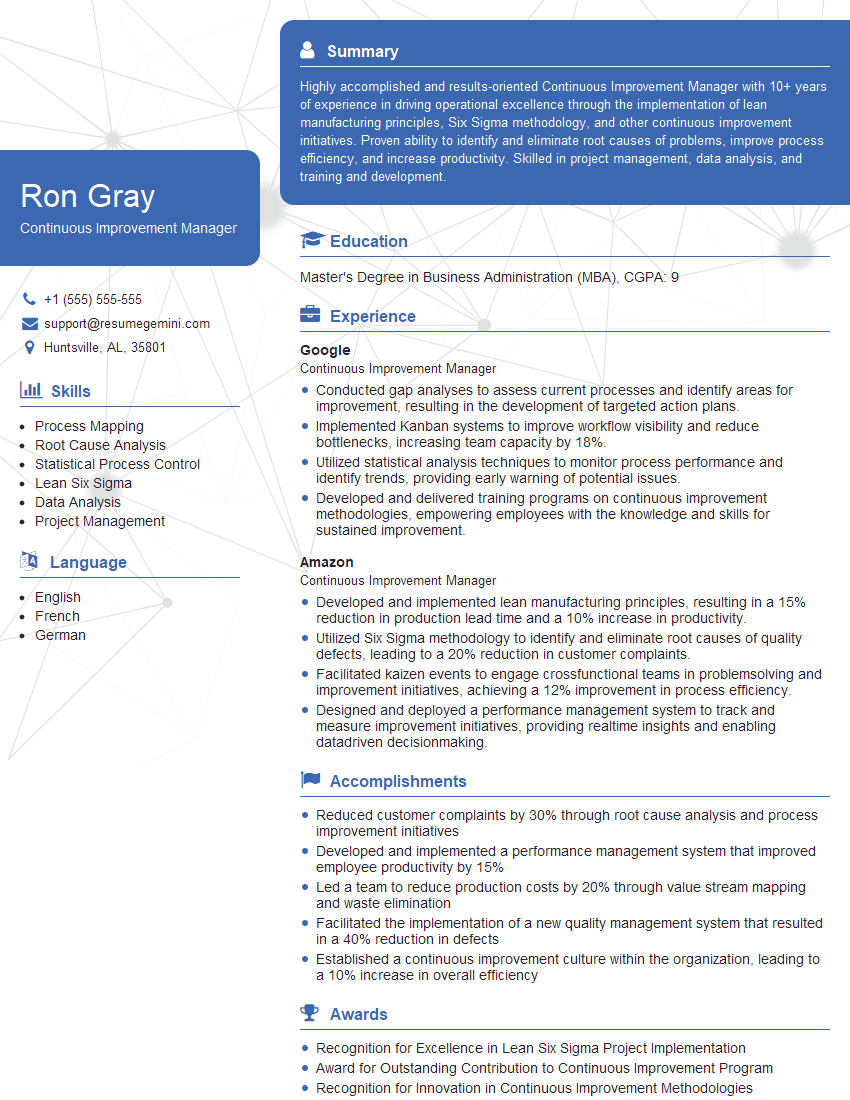
Mastering Outcome Measurement and Quality Improvement is crucial for advancing your career in healthcare, research, and many other fields. Demonstrating expertise in these areas will significantly enhance your job prospects. To maximize your chances of success, invest time in crafting an ATS-friendly resume that highlights your skills and experience effectively. ResumeGemini is a trusted resource that can help you build a professional and impactful resume, ensuring your qualifications stand out to recruiters. Examples of resumes tailored to Outcome Measurement and Quality Improvement are available to guide your resume creation process.
Explore more articles
Users Rating of Our Blogs
Share Your Experience
We value your feedback! Please rate our content and share your thoughts (optional).
What Readers Say About Our Blog
To the interviewgemini.com Webmaster.
Very helpful and content specific questions to help prepare me for my interview!
Thank you
To the interviewgemini.com Webmaster.
This was kind of a unique content I found around the specialized skills. Very helpful questions and good detailed answers.
Very Helpful blog, thank you Interviewgemini team.