Interviews are opportunities to demonstrate your expertise, and this guide is here to help you shine. Explore the essential Cross-Tabulation Analysis interview questions that employers frequently ask, paired with strategies for crafting responses that set you apart from the competition.
Questions Asked in Cross-Tabulation Analysis Interview
Q 1. Explain the concept of cross-tabulation analysis.
Cross-tabulation analysis, also known as contingency table analysis, is a powerful statistical method used to analyze the relationship between two or more categorical variables. Imagine you’re a market researcher studying consumer preferences. You might want to see if there’s a connection between age group (young, middle-aged, senior) and preferred brand of coffee (Brand A, Brand B, Brand C). Cross-tabulation helps you organize and visualize this relationship, revealing patterns and associations.
Essentially, it creates a table that summarizes the counts of observations for each combination of categories across the variables. This allows us to see, for example, how many young people prefer Brand A, how many middle-aged people prefer Brand B, and so on. This visual representation quickly highlights potential relationships that might not be apparent from looking at individual variable distributions.
Q 2. What are the different types of cross-tabulations?
While the core concept remains consistent, cross-tabulations can be categorized based on the number of variables involved and the type of analysis performed. The most common types are:
- Two-way cross-tabulation: This is the most basic form, examining the relationship between two categorical variables. Our coffee example above is a two-way cross-tabulation.
- Three-way (or higher-way) cross-tabulation: These involve three or more categorical variables, allowing for more complex analyses. For instance, we could add another variable like ‘gender’ to our coffee example to see if preferences differ across gender within age groups. This can get complex quickly, requiring careful consideration of how to interpret the results.
- Cross-tabulation with percentages: Instead of just raw counts, we can express the data as percentages (row percentages, column percentages, or total percentages) to better understand the proportional relationships between categories. This improves comparison and interpretation significantly.
Q 3. How do you interpret a cross-tabulation table?
Interpreting a cross-tabulation table involves looking for patterns and associations between the variables. Let’s say our coffee example yields a table showing that a significantly higher percentage of young people prefer Brand A compared to other age groups. This suggests a potential relationship between age and brand preference.
We look for:
- Significant differences in cell counts or percentages: Large discrepancies might indicate a relationship. For example, a disproportionately high number of observations in one cell suggests a possible association.
- Patterns and trends: Do certain combinations of categories occur more frequently than others? Do patterns emerge that might support a hypothesis?
- Statistical significance testing: Techniques like Chi-square tests can be used to determine whether the observed relationships are statistically significant or merely due to chance. This is crucial for drawing valid conclusions.
It’s important to remember that correlation doesn’t equal causation. Cross-tabulation can reveal associations, but it cannot definitively prove that one variable *causes* changes in the other.
Q 4. What are the limitations of cross-tabulation analysis?
Cross-tabulation, while powerful, has limitations:
- Limited to categorical data: It can only handle categorical variables; continuous variables need to be categorized first, potentially leading to information loss.
- Doesn’t show strength of association: It indicates the presence of association but doesn’t quantify the strength of the relationship. Further analysis, like calculating correlation coefficients, might be necessary.
- Can become complex with many variables: Interpreting higher-order cross-tabulations can be difficult and requires specialized skills.
- Potential for misleading interpretations: If the sample size is too small or not representative of the population, results might be unreliable.
Q 5. Explain the concept of marginal totals in a cross-tabulation.
Marginal totals represent the total counts for each category of a single variable, ignoring the other variables. In our coffee example, the marginal totals would show the total number of young people, middle-aged people, and senior people, regardless of their coffee preference. Similarly, it would show the total number of people who prefer Brand A, Brand B, and Brand C, regardless of their age. These totals provide the overall distribution of each individual variable.
Think of them as the ‘margins’ of the cross-tabulation table – they sum up the rows and columns independently.
Q 6. What is a contingency table and how is it related to cross-tabulation?
A contingency table is essentially another name for a cross-tabulation table. Both terms refer to the same thing: a table that displays the frequency distribution of two or more categorical variables, showing the counts of observations for each combination of categories. The term ‘contingency’ highlights the fact that the table shows how the frequency of one variable *depends* or is *contingent* upon the other.
Q 7. How do you calculate percentages in a cross-tabulation table?
Calculating percentages in a cross-tabulation enhances interpretation. There are three main types of percentages:
- Row percentages: Each cell’s value is expressed as a percentage of its row total. This shows the conditional probability of a certain category in one variable, given a specific category in the other variable (e.g., the percentage of young people who prefer Brand A, out of all young people).
- Column percentages: Each cell’s value is expressed as a percentage of its column total. This shows the conditional probability of a category in one variable, given a specific category in the other (e.g., the percentage of those who prefer Brand A that are young).
- Total percentages: Each cell’s value is expressed as a percentage of the grand total (total number of observations). This shows the overall proportion of observations that fall into a specific combination of categories.
The choice of percentage type depends on the research question. For example, if you want to understand how age affects coffee brand preference, row percentages would be most appropriate.
The calculation is straightforward: (Cell count / Relevant total) * 100%
Q 8. What are row percentages, column percentages, and total percentages?
In cross-tabulation, we present data in a table format showing the relationship between two or more categorical variables. Percentages help us understand the proportions within this data. Let’s break down the three types:
- Row Percentages: These percentages are calculated within each row of the cross-tabulation table. They show the proportion of each column category relative to the total for that specific row. Think of it like this: If we’re looking at customer satisfaction (satisfied/unsatisfied) broken down by age group (young/old), a row percentage would tell us, for example, what percentage of *young* customers were satisfied and what percentage were unsatisfied. This allows comparison across the column categories *within* each row.
- Column Percentages: Conversely, column percentages are calculated within each column of the table. They show the proportion of each row category relative to the total for that specific column. Using the same example, a column percentage would tell us what percentage of *satisfied* customers are young and what percentage are old. This facilitates comparison across row categories *within* each column.
- Total Percentages: These percentages are calculated based on the grand total of all observations in the table. They show the proportion of each cell relative to the entire dataset. This gives an overall picture of the distribution of the data across both variables.
Choosing the right percentage type depends entirely on the question you’re trying to answer. For example, if you want to see how a specific demographic responds to a product, you would likely use row percentages. If you want to examine what factors contribute to a specific outcome, column percentages might be more insightful.
Q 9. When is cross-tabulation most useful?
Cross-tabulation shines when you need to explore the relationship between two or more categorical variables. It’s particularly useful when:
- Identifying associations: You want to see if there’s a connection between variables like purchase behavior and age group, or voting patterns and political affiliation.
- Understanding subgroups: You need to delve deeper into data and examine how relationships differ across subgroups (e.g., the relationship between product usage and satisfaction might vary by gender).
- Simplifying complex data: You have a large dataset with many categorical variables and need a way to visualize and understand the relationships between them in a clear and concise manner.
- Generating hypotheses: Cross-tabulations can reveal unexpected patterns that lead to further investigation and the formulation of new hypotheses for testing.
For example, a marketing team might use cross-tabulation to analyze the relationship between customer demographics (age, location, income) and their purchasing behavior (products purchased, frequency of purchases). This analysis helps them tailor marketing campaigns to specific customer segments.
Q 10. How would you use cross-tabulation to identify relationships between variables?
Cross-tabulation directly reveals relationships between variables by showing the frequency distribution of observations across different categories. Strong relationships manifest as noticeable differences in the cell counts or percentages across the table. Let’s say we cross-tabulate ‘Smoking Status’ (Smoker/Non-Smoker) with ‘Lung Cancer Diagnosis’ (Yes/No). A significant difference in the percentage of smokers diagnosed with lung cancer compared to non-smokers would strongly suggest a relationship between smoking and lung cancer.
To further analyze this relationship, we examine the distribution of data across the table. Are certain combinations of categories highly represented? Are others underrepresented? These patterns help us visualize and quantify the relationship between the variables. For instance, a higher proportion of smokers with lung cancer compared to non-smokers is a clear indication of a possible relationship.
Q 11. What are some common statistical measures used in conjunction with cross-tabulation?
Several statistical measures enhance the interpretation of cross-tabulations. These include:
- Chi-square test: Assesses the statistical significance of the association between the variables (discussed in more detail below).
- Phi coefficient/Cramer’s V: Measures the strength of the association between two nominal variables (variables with categories).
- Odds ratio: Explores the relationship between two binary variables (variables with two categories) by calculating the odds of an event occurring in one group compared to another.
- Relative risk: Compares the probability of an outcome occurring in two groups.
These measures quantify the strength and significance of the relationships observed in the cross-tabulation, providing more objective insights beyond visual inspection alone.
Q 12. Explain the concept of statistical significance in the context of cross-tabulation.
Statistical significance, in the context of cross-tabulation, refers to the probability that the observed relationship between the variables is not due to random chance. A statistically significant result suggests there’s a real relationship, not just a random fluctuation in the data. It’s usually determined using a p-value.
The p-value represents the probability of observing the relationship (or a stronger one) if there were truly no relationship between the variables. A commonly used threshold is a p-value of 0.05. If the p-value is less than 0.05, we reject the null hypothesis (the hypothesis that there is no relationship) and conclude that the relationship is statistically significant. This doesn’t necessarily imply a *strong* relationship, but it does suggest a relationship that is unlikely to be due to mere chance.
Q 13. How do you handle missing data in cross-tabulation analysis?
Missing data is a common challenge in any analysis. Several strategies exist for handling missing data in cross-tabulation:
- Listwise deletion: This involves removing any observation with missing data for any of the variables involved in the cross-tabulation. Simple but can lead to a significant loss of data if missingness is substantial.
- Pairwise deletion: This excludes cases only when data are missing for the specific pair of variables being analyzed in a given cross-tabulation. This is less wasteful than listwise deletion but can lead to inconsistencies.
- Imputation: This involves replacing missing values with estimated values. Methods include mean/mode imputation (replacing with the average or most frequent value), regression imputation (predicting values based on other variables), or more advanced techniques like multiple imputation.
- Separate analysis of subgroups: If missing data are non-random, it might be appropriate to analyze the complete cases separately and then analyze the subgroups with missing data separately. This helps understand the potential impact of missingness on the results.
The best approach depends on the extent of missing data, its pattern (random vs. non-random), and the goals of the analysis. It’s always important to document the handling of missing data to ensure transparency and reproducibility.
Q 14. What is the chi-square test and how is it used with cross-tabulation?
The chi-square (χ²) test is a statistical test used to determine if there’s a significant association between two categorical variables. In the context of cross-tabulation, it compares the observed frequencies in each cell of the table to the frequencies that would be expected if the variables were independent. A large difference between observed and expected frequencies suggests a significant relationship.
The chi-square statistic measures this difference. A higher chi-square value indicates a larger discrepancy between observed and expected frequencies. The test then calculates a p-value, determining the probability of observing the data (or more extreme data) if there were no association between the variables. A small p-value (typically < 0.05) indicates that the association is statistically significant; meaning it's unlikely to be due to random chance.
Example: Let’s say we are testing if there is an association between gender and preferred ice cream flavor (chocolate vs. vanilla). We would conduct a chi-square test on the cross-tabulation of gender and ice cream preference. A statistically significant result would indicate that one gender might show a preference for a specific flavor significantly more than chance would predict.
Q 15. Explain the concept of degrees of freedom in a chi-square test.
Degrees of freedom (df) in a chi-square test represent the number of independent pieces of information available to estimate a parameter. Imagine you have a 2×2 contingency table. You know the row and column totals. Once you fill in one cell, the others are automatically determined. Thus, you only have one degree of freedom. In general, for a contingency table with r rows and c columns, the degrees of freedom are calculated as (r – 1)(c – 1).
For example, in a 3×2 table, you have (3-1)(2-1) = 2 degrees of freedom. This means that only two cell values are free to vary; once these are determined, the rest of the table is fixed based on the marginal totals. The degrees of freedom are crucial because they determine the shape of the chi-square distribution used to calculate the p-value.
Career Expert Tips:
- Ace those interviews! Prepare effectively by reviewing the Top 50 Most Common Interview Questions on ResumeGemini.
- Navigate your job search with confidence! Explore a wide range of Career Tips on ResumeGemini. Learn about common challenges and recommendations to overcome them.
- Craft the perfect resume! Master the Art of Resume Writing with ResumeGemini’s guide. Showcase your unique qualifications and achievements effectively.
- Don’t miss out on holiday savings! Build your dream resume with ResumeGemini’s ATS optimized templates.
Q 16. How do you interpret the p-value in a chi-square test?
The p-value in a chi-square test represents the probability of observing the obtained results (or more extreme results) if there is no association between the two categorical variables being compared. It’s a measure of evidence against the null hypothesis (that there’s no relationship).
A small p-value (typically less than 0.05) indicates strong evidence against the null hypothesis, suggesting a statistically significant association between the variables. A large p-value suggests that the observed association could easily have occurred by chance alone. It’s important to remember that a p-value does not indicate the strength of the association, only the statistical significance.
For instance, a p-value of 0.01 suggests a stronger association than a p-value of 0.08. However, the practical significance of the association needs further investigation, often by looking at the effect size (such as Cramer’s V or Phi coefficient) and the context of the study.
Q 17. What are the assumptions of the chi-square test?
The chi-square test has several important assumptions:
- Independence of observations: Each observation should be independent of the others. For example, you can’t survey the same person multiple times and include each response as a separate observation.
- Expected cell frequencies: The expected frequency for each cell in the contingency table should be at least 5. This ensures that the chi-square distribution is a reasonable approximation. If expected cell frequencies are too low, Fisher’s exact test is often a better alternative.
- Categorical data: The data used in the chi-square test must be categorical (nominal or ordinal). You can’t apply it directly to continuous data.
Violating these assumptions can lead to inaccurate results. It’s crucial to check these assumptions before conducting a chi-square test.
Q 18. What are some alternatives to the chi-square test for cross-tabulation?
Several alternatives exist to the chi-square test for cross-tabulation, depending on the specific situation and the nature of the data:
- Fisher’s exact test: Used when expected cell frequencies are low (less than 5 in one or more cells). It’s more computationally intensive but provides an exact p-value.
- Cochran-Armitage trend test: Appropriate for ordinal categorical variables when you expect a specific trend in the relationship.
- Mantel-Haenszel test: Used when analyzing the association between two categorical variables while controlling for a third categorical variable (stratification).
- Logistic regression: A powerful technique when you have one or more predictor variables and a binary outcome variable. It can handle multiple predictors and model the relationship more precisely than a simple chi-square test.
The choice of alternative depends on the specific research question and the characteristics of the data.
Q 19. How can you visualize the results of a cross-tabulation analysis?
Visualizing cross-tabulation results enhances understanding and communication. Common methods include:
- Contingency tables: The simplest way is to present the data in a well-formatted table showing the observed frequencies in each cell.
- Stacked bar charts: Ideal for comparing proportions across different categories. Each bar represents a category of one variable, and segments within the bar show the proportions of the other variable.
- Clustered bar charts: Similar to stacked bar charts, but bars are clustered for each category of one variable, making it easier to compare absolute frequencies.
- Mosaic plots: Visually represent the relative contribution of each cell to the overall table. The area of each cell is proportional to its frequency.
Choosing the appropriate visualization depends on the specific data and the message you want to convey.
Q 20. Describe a scenario where cross-tabulation would be an inappropriate analytical technique.
Cross-tabulation would be inappropriate when the variables are not categorical, or if there’s a strong dependency between observations. For example:
- Continuous variables: If you’re analyzing the relationship between height (continuous) and weight (continuous), a correlation analysis or regression would be more suitable than cross-tabulation.
- Time-series data: If the observations are dependent (e.g., stock prices over time), cross-tabulation is not appropriate, as the assumption of independence is violated. Time series analysis techniques should be used instead.
- Small sample sizes with many categories: If the sample size is too small and the number of categories is large, the expected cell frequencies may be too low for a chi-square test to be reliable. In this situation, consider a different approach.
In essence, cross-tabulation is a powerful tool but it’s not a one-size-fits-all solution. The appropriateness depends entirely on the nature of the data and the research question.
Q 21. Explain how you would present the findings of a cross-tabulation analysis to a non-technical audience.
Presenting cross-tabulation findings to a non-technical audience requires clear and concise communication, avoiding jargon. Here’s a strategy:
- Focus on the story: Begin by stating the main finding in plain language. For example, instead of saying, ‘The chi-square test showed a significant association (p<0.05) between gender and product preference,’ say, ‘Our data shows that men and women have different preferences for this product.’
- Use visualizations: A well-designed bar chart or mosaic plot is much more easily understood than a complex table of numbers.
- Avoid statistical jargon: Replace terms like ‘p-value’ with simpler explanations, such as ‘the probability that this result was due to chance is less than 5%’.
- Provide context: Explain the implications of the findings in a way that’s relevant to the audience’s needs and interests. For example, ‘This means we should consider marketing this product differently to men and women.’
- Keep it simple: Avoid overwhelming the audience with excessive detail. Highlight only the most important findings.
By focusing on storytelling and clear visualizations, you can make even complex statistical results easily understandable for a non-technical audience.
Q 22. How would you use cross-tabulation to analyze survey data?
Cross-tabulation, also known as contingency table analysis, is a powerful technique for analyzing survey data by examining the relationship between two or more categorical variables. It essentially shows the frequency distribution of observations across different categories of these variables. Think of it as creating a detailed summary table that reveals patterns and associations.
For example, imagine a survey investigating customer satisfaction with a new product. We might cross-tabulate ‘Satisfaction Level’ (e.g., Very Satisfied, Satisfied, Neutral, Dissatisfied, Very Dissatisfied) with ‘Age Group’ (e.g., 18-25, 26-35, 36-45, 46+). This would reveal if certain age groups are more or less satisfied than others. The resulting table would show the count (or percentage) of respondents in each combination of satisfaction level and age group.
To use it effectively, you would:
- Clearly define your categorical variables.
- Import your data into a statistical software package.
- Create the cross-tabulation table, specifying the variables.
- Analyze the resulting table looking for patterns and significant relationships.
- Potentially calculate percentages (row, column, or total) to facilitate interpretation and comparison.
Q 23. How do you determine the appropriate level of detail for a cross-tabulation?
Determining the appropriate level of detail for a cross-tabulation involves balancing the need for granular insights with the risk of over-complicating the analysis and obscuring meaningful patterns in noise. Too much detail can lead to tables that are unwieldy and difficult to interpret. Too little detail may mask important relationships.
The key considerations include:
- Sample Size: With smaller sample sizes, you’ll want to avoid highly granular cross-tabulations as some cells may contain very few observations, leading to unreliable results.
- Research Question: The specific question guiding your analysis will determine the necessary level of detail. A broad question might require a less granular approach, while a more focused question may demand more detail.
- Variable Characteristics: The number of categories within each variable influences complexity. Variables with many categories may necessitate collapsing categories for easier interpretation (e.g., combining several similar income brackets into broader ranges).
- Interpretability: Ultimately, the level of detail should be chosen to make the results easily understandable and actionable. If the table is too complex, it defeats the purpose of the analysis.
Iterative analysis is often necessary. You may start with a more detailed table and then simplify it based on the findings.
Q 24. How would you deal with a large dataset when performing cross-tabulation?
Handling large datasets in cross-tabulation requires efficient techniques to avoid computational bottlenecks and ensure accurate results. Standard software packages might struggle with extremely large datasets, requiring specialized approaches:
- Data Sampling: If the dataset is truly massive, a carefully chosen representative sample might suffice. This reduces the computational burden without significantly compromising accuracy if the sampling is done correctly.
- Data Aggregation: Pre-aggregate your data before creating the cross-tabulation. This means collapsing categories or creating summary variables to reduce the number of cells in the final table.
- Database Management Systems (DBMS): For exceptionally large datasets, use a DBMS like SQL Server or MySQL to perform the cross-tabulation directly within the database. This leverages the database’s optimized query engine for speed and efficiency.
SELECT variable1, variable2, COUNT(*) FROM your_table GROUP BY variable1, variable2;is a simple example of how SQL can efficiently generate cross-tabs. - Specialized Statistical Software: Packages such as SAS or R are designed to handle large datasets efficiently, offering optimized algorithms and memory management.
The choice of method depends on the size of the dataset, available resources, and the desired level of detail.
Q 25. How can cross-tabulation inform decision-making?
Cross-tabulation is invaluable for informing decision-making by providing insights into relationships between variables and helping identify key trends. The insights gained can then be utilized for various strategic and operational decisions.
Here are some examples:
- Marketing: Cross-tabulating customer demographics with purchase behavior helps target marketing campaigns effectively (e.g., targeting specific age groups with tailored promotions).
- Product Development: Analyzing user feedback (cross-tabulated with product features) allows for identifying areas for improvement and guiding product development decisions.
- Operations: Cross-tabulating defect rates with production line data identifies bottlenecks and areas requiring quality control enhancements.
- Human Resources: Cross-tabulating employee satisfaction with various factors (e.g., compensation, management style) reveals issues impacting employee morale and productivity.
In each of these cases, the cross-tabulation provides a quantitative basis for evidence-based decision-making, moving beyond intuition and guesswork.
Q 26. What software packages are you familiar with for performing cross-tabulation analysis?
I am proficient in several software packages for cross-tabulation analysis:
- SPSS: A widely used statistical software package offering robust capabilities for cross-tabulation, including chi-square tests and other statistical measures of association.
- SAS: Another powerful statistical software suite with excellent capabilities for handling large datasets and complex cross-tabulations.
- R: A versatile open-source programming language with numerous packages (e.g.,
table(),xtabs()) facilitating cross-tabulation and advanced statistical analysis. - Excel: While not as powerful as dedicated statistical packages, Excel’s pivot tables offer a convenient way to create cross-tabulations for smaller datasets.
- Python (with Pandas): Pandas, a Python library for data manipulation, provides functionality (e.g.,
pd.crosstab()) to efficiently generate cross-tabulation tables.
Q 27. Describe a time you used cross-tabulation to solve a real-world problem.
In a previous role, I worked with a client who was launching a new mobile app. They wanted to understand the factors driving user engagement. We surveyed a group of early adopters, collecting data on demographics, app usage frequency, feature preferences, and overall satisfaction.
By cross-tabulating app usage frequency with different demographic variables (age, gender, device type, etc.), we discovered a significant correlation between age group and app usage. Specifically, the 18-25 age group showed substantially higher engagement than older demographics. This insight allowed the client to refine their marketing strategy, focusing resources on reaching the 18-25 demographic and tailoring their messaging to resonate with their preferences. It also helped them prioritize features that appealed to this high-engagement segment.
Q 28. Can you explain the difference between cross-tabulation and correlation?
While both cross-tabulation and correlation analyze relationships between variables, they do so in fundamentally different ways.
Cross-tabulation analyzes the relationship between categorical variables by showing the frequency distribution of observations across different combinations of categories. It reveals patterns in the joint distribution of these variables. For example, cross-tabulating ‘Gender’ and ‘Voting Preference’ displays how many males/females voted for each candidate.
Correlation, on the other hand, analyzes the relationship between numerical variables. It measures the strength and direction of a linear relationship using a correlation coefficient (e.g., Pearson’s r). A high positive correlation indicates that as one variable increases, the other tends to increase, while a high negative correlation shows an inverse relationship. For instance, we might examine the correlation between ‘Hours Studied’ and ‘Exam Score’.
In short, cross-tabulation is for categorical data and explores joint distributions, while correlation is for numerical data and quantifies the strength of a linear relationship.
Key Topics to Learn for Cross-Tabulation Analysis Interview
- Understanding Contingency Tables: Mastering the creation and interpretation of two-way and multi-way tables, including understanding row and column percentages.
- Identifying Relationships: Learn to detect patterns, associations, and potential correlations between categorical variables through cross-tabulation.
- Statistical Significance Testing: Familiarize yourself with Chi-square tests and their application in determining the statistical significance of observed relationships within cross-tabulations.
- Practical Applications: Understand how cross-tabulation is used in market research, customer segmentation, A/B testing analysis, and other relevant fields. Be prepared to discuss real-world examples.
- Data Visualization: Practice presenting cross-tabulation results effectively using charts and graphs (e.g., clustered bar charts, heatmaps) to clearly communicate findings.
- Limitations and Misinterpretations: Understand the potential pitfalls of cross-tabulation analysis, such as Simpson’s paradox and the limitations of inferring causality.
- Advanced Techniques: Explore more advanced concepts like residual analysis for deeper insight into the relationships and potential interaction effects between variables.
Next Steps
Mastering cross-tabulation analysis is a valuable skill that significantly enhances your analytical capabilities and opens doors to numerous opportunities in data-driven roles. A strong understanding of this technique demonstrates your proficiency in data interpretation and problem-solving, making you a more competitive candidate. To maximize your job prospects, focus on building an ATS-friendly resume that highlights your skills and experience effectively. ResumeGemini can be a trusted partner in this process, providing the tools and resources to craft a compelling resume that showcases your expertise in cross-tabulation analysis. Examples of resumes tailored to this specific skillset are available within ResumeGemini to help guide you.
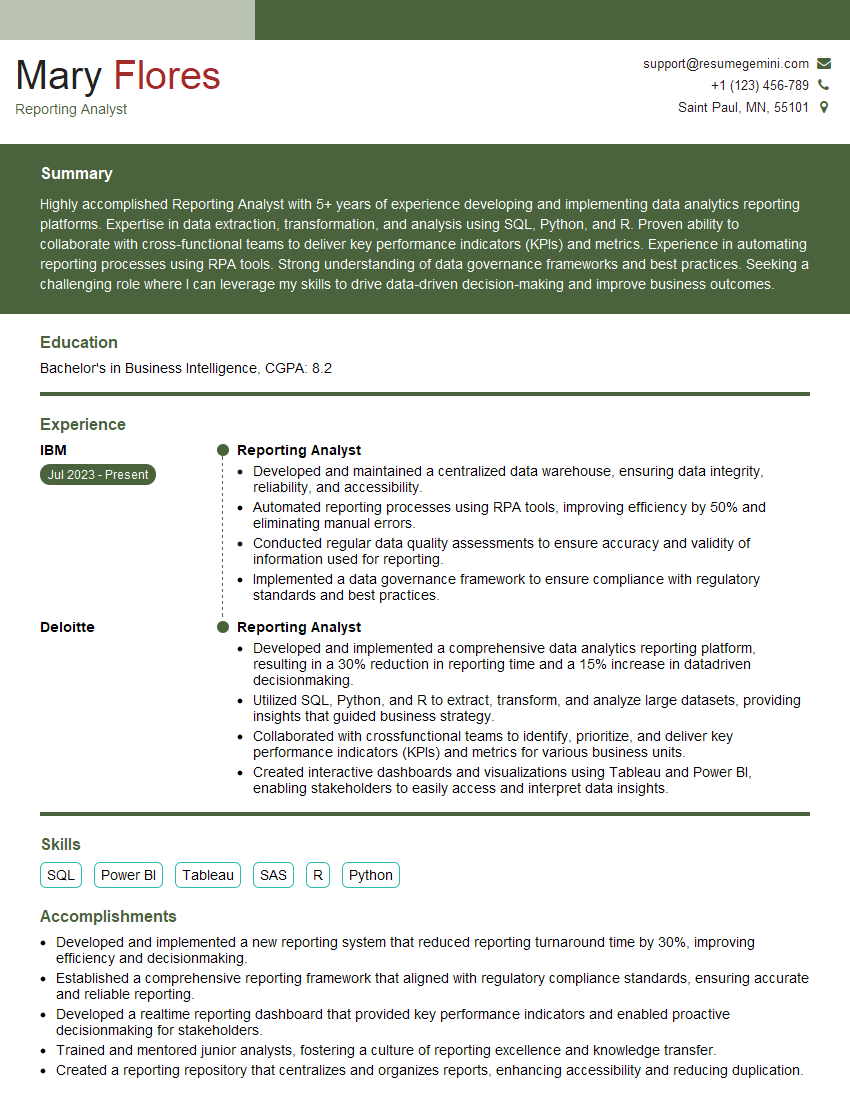
Reporting Analyst Resume Sample
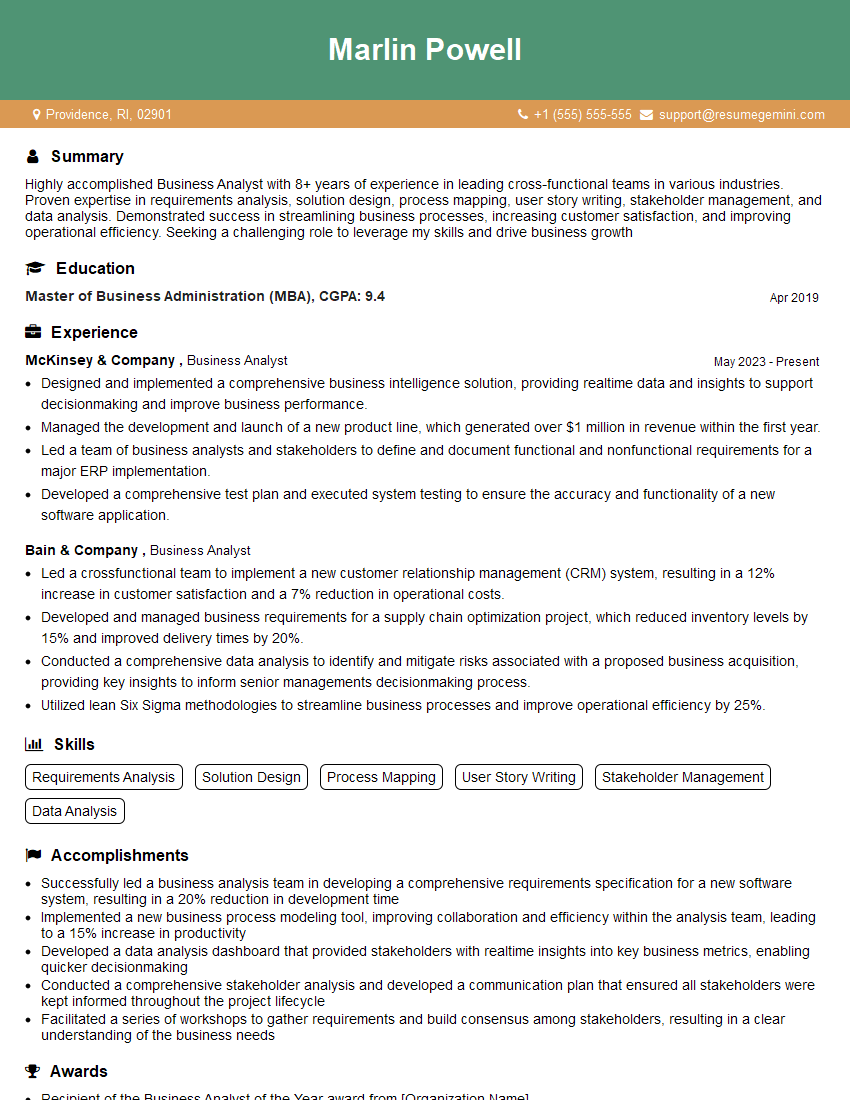
Business Analyst Resume Sample
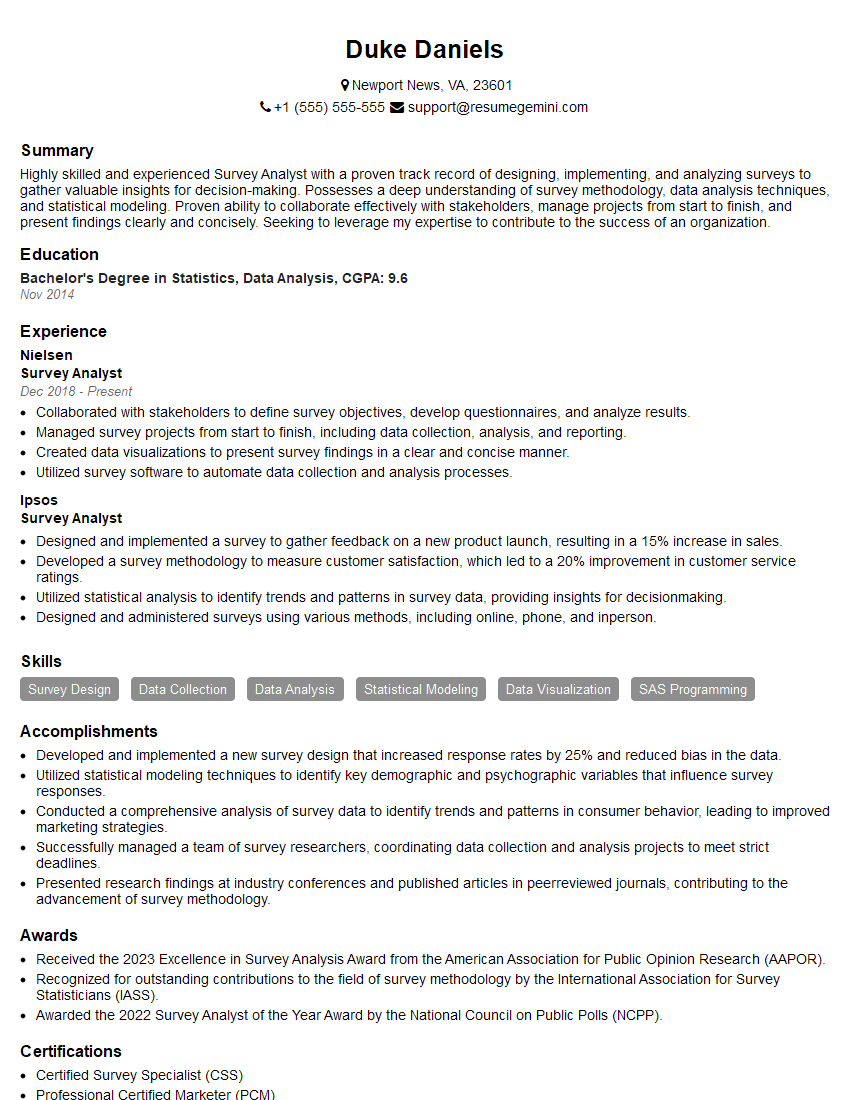
Survey Analyst Resume Sample
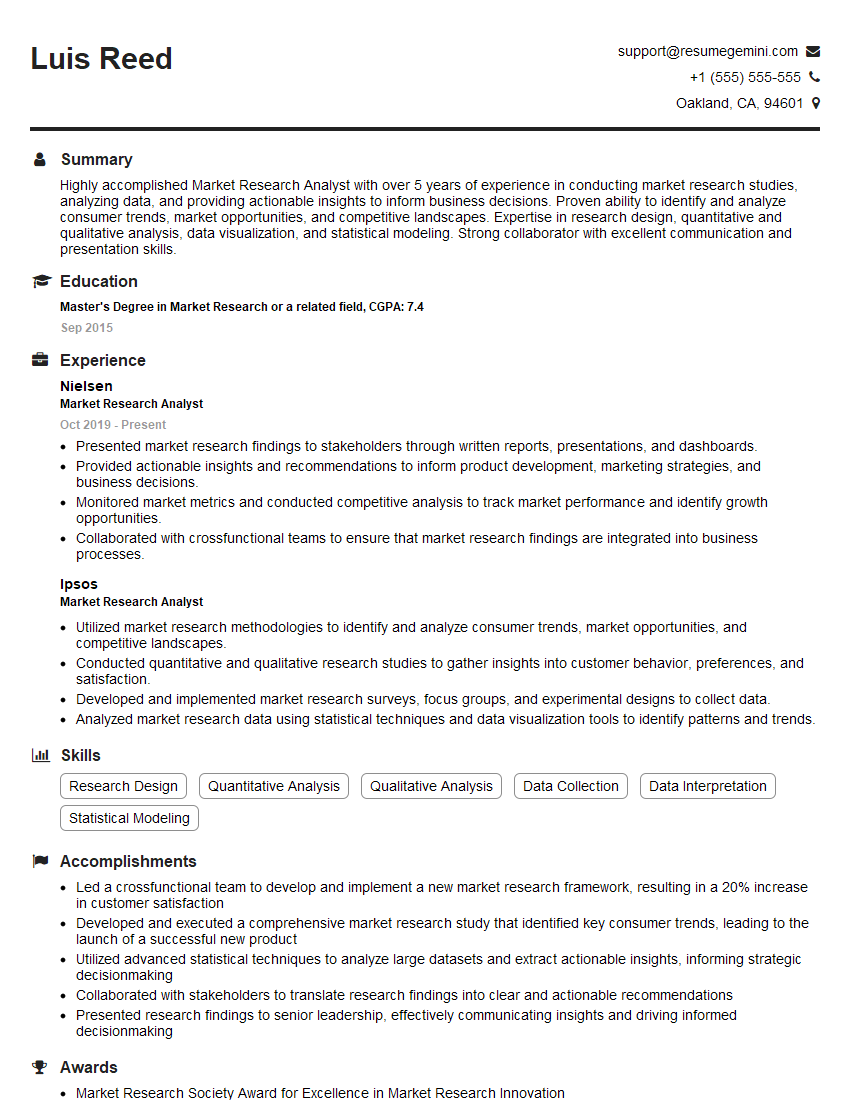
Market Research Analyst Resume Sample
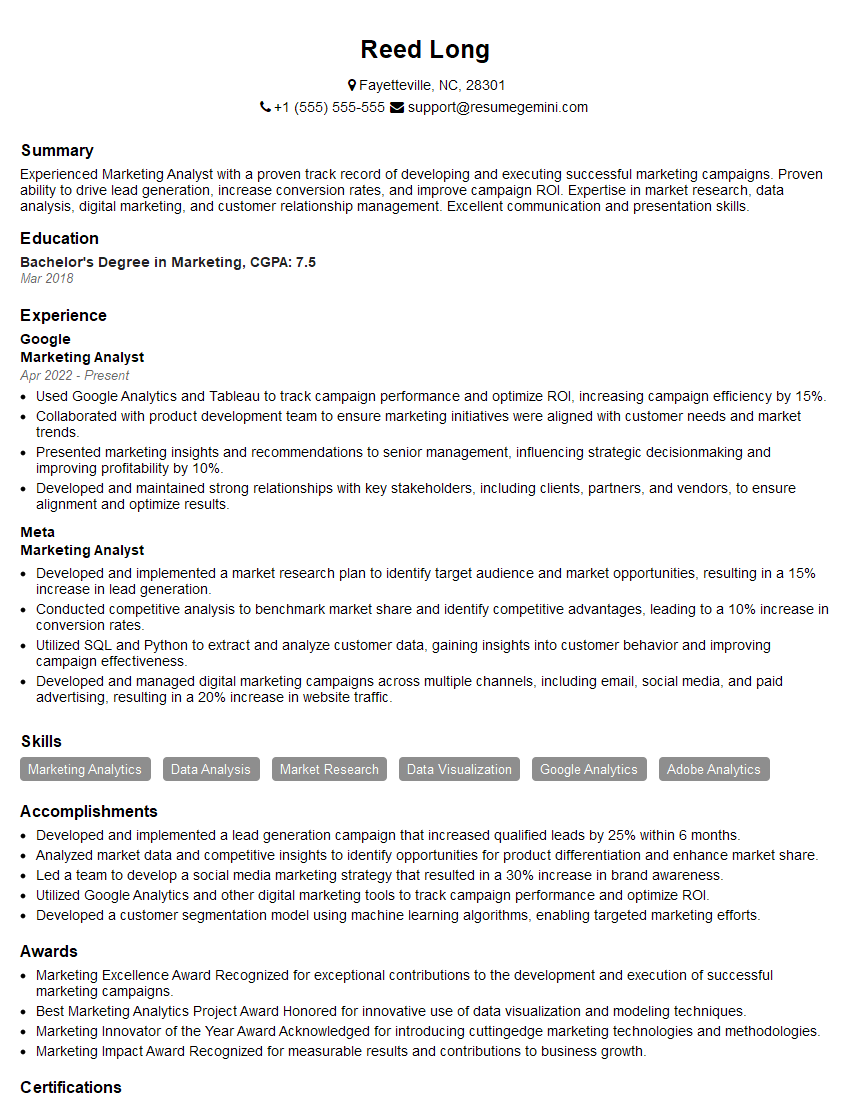
Marketing Analyst Resume Sample
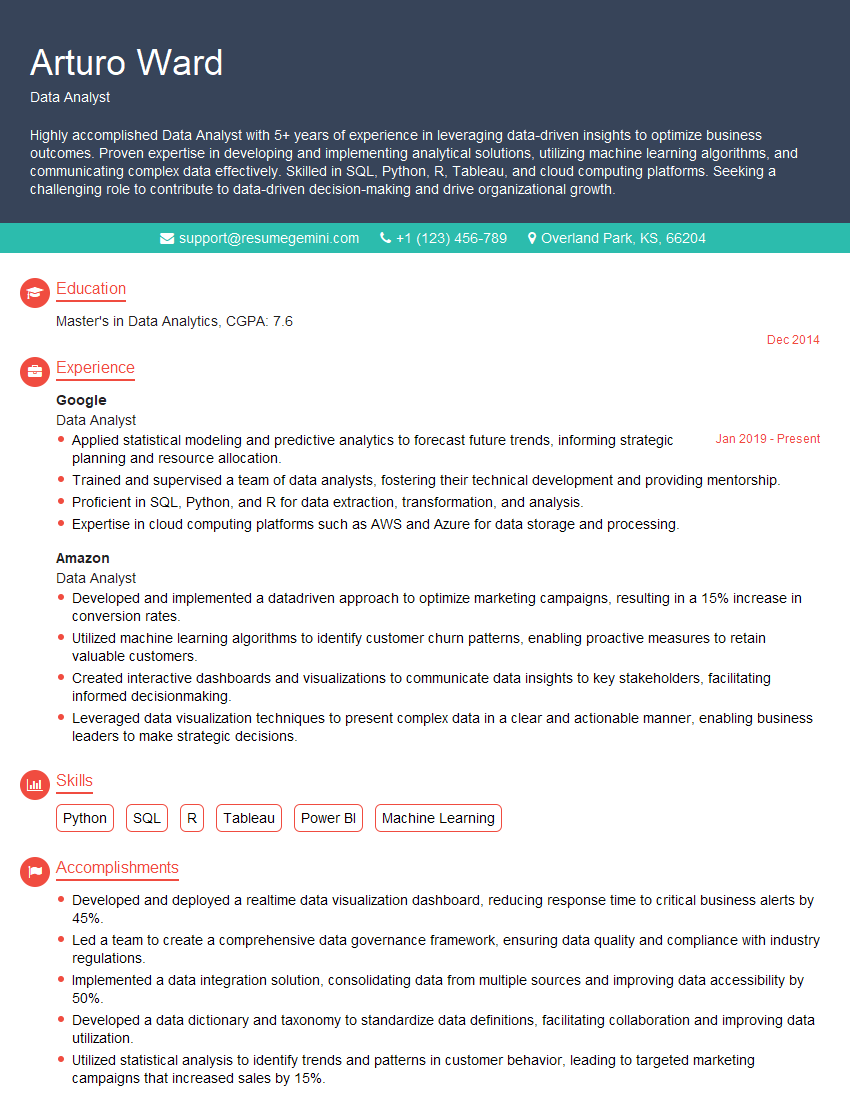
Data Analyst Resume Sample
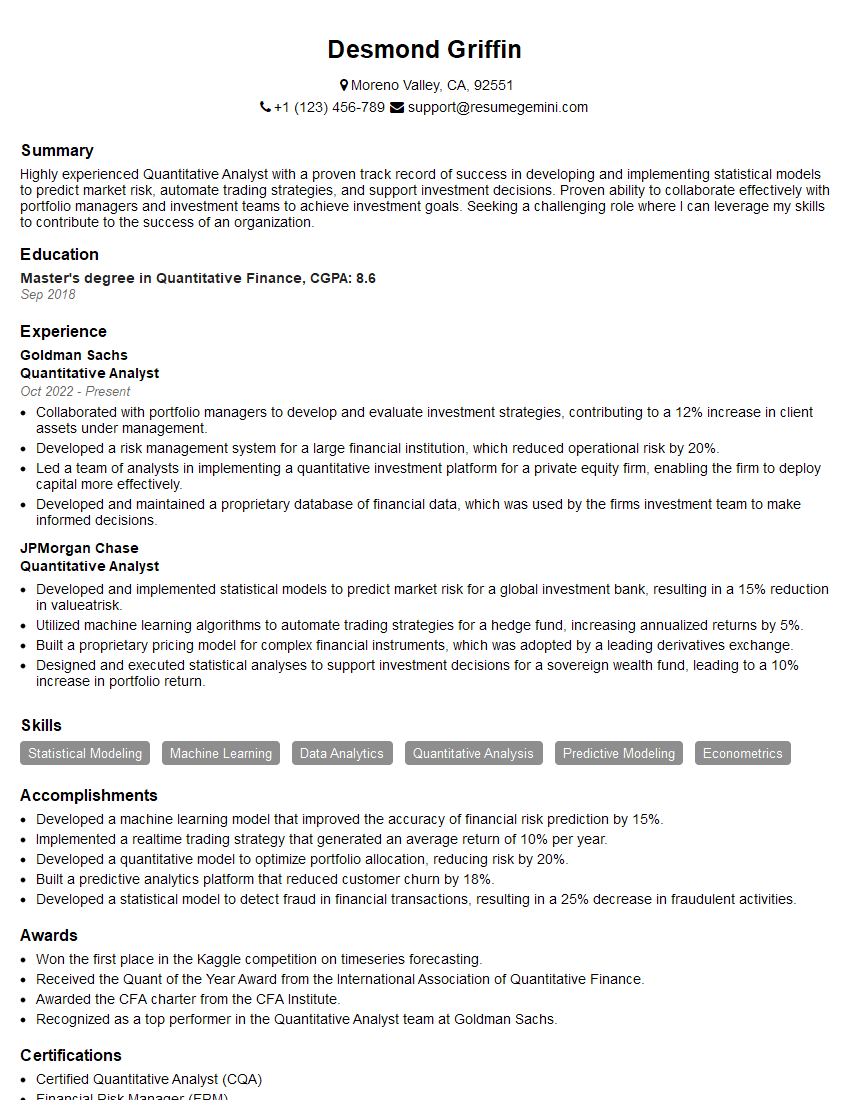
Quantitative Analyst Resume Sample
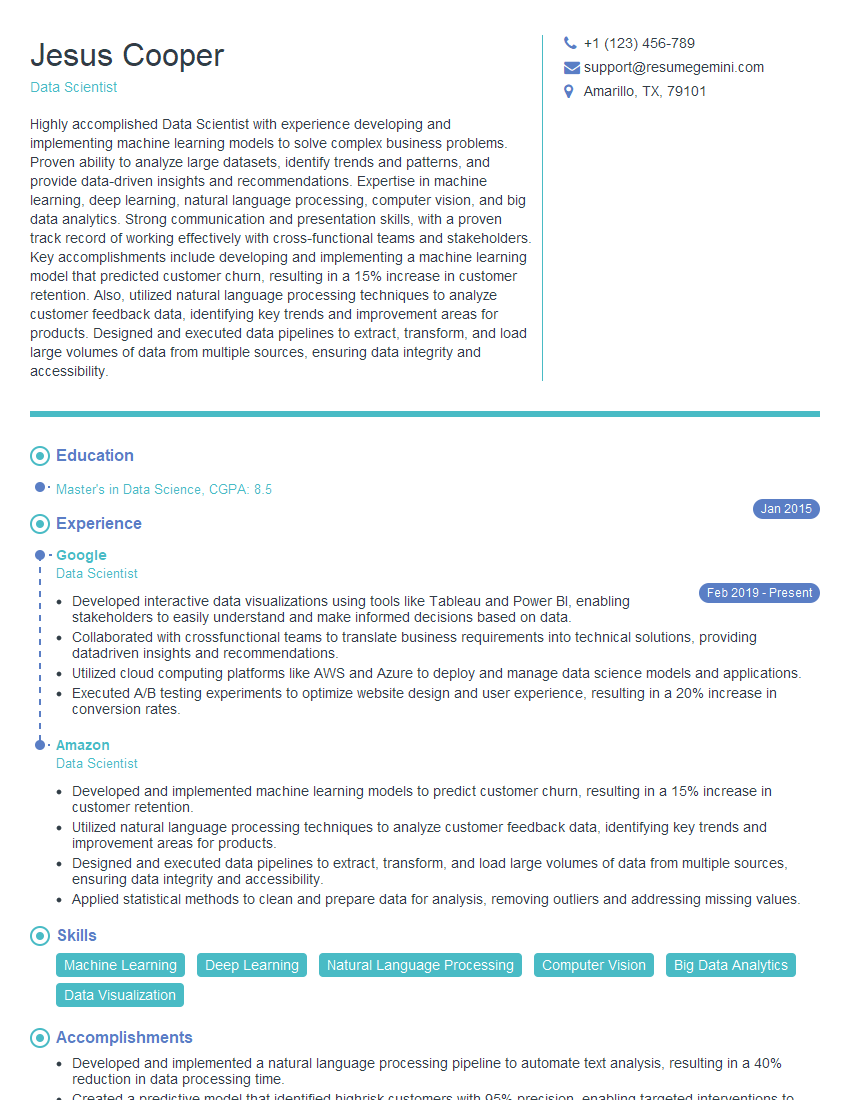
Data Scientist Resume Sample

Research Scientist Resume Sample
Database Analyst Resume Sample
Decision Support Analyst Resume Sample
Operations Analyst Resume Sample
Statistician Resume Sample
Machine Learning Engineer Resume Sample
Predictive Analyst Resume Sample
Explore more articles
Users Rating of Our Blogs
Share Your Experience
We value your feedback! Please rate our content and share your thoughts (optional).
What Readers Say About Our Blog
To the interviewgemini.com Webmaster.
Very helpful and content specific questions to help prepare me for my interview!
Thank you
To the interviewgemini.com Webmaster.
This was kind of a unique content I found around the specialized skills. Very helpful questions and good detailed answers.
Very Helpful blog, thank you Interviewgemini team.