Interviews are more than just a Q&A session—they’re a chance to prove your worth. This blog dives into essential Data Gathering interview questions and expert tips to help you align your answers with what hiring managers are looking for. Start preparing to shine!
Questions Asked in Data Gathering Interview
Q 1. Explain the difference between structured and unstructured data.
The core difference between structured and unstructured data lies in its organization and format. Structured data is highly organized and easily searchable because it resides in a predefined format like a relational database. Think of it like a neatly organized filing cabinet with clearly labeled folders and files. Each piece of information fits into a specific field or column, making it perfect for analysis with traditional tools. Examples include data in spreadsheets (CSV, XLSX), SQL databases, and NoSQL databases with predefined schemas.
Unstructured data, on the other hand, lacks a predefined format. It’s like a messy pile of papers – images, videos, audio files, text documents (like emails or word processing documents), and social media posts. This makes searching and analyzing this data more complex and often requires specialized techniques. Consider trying to find a specific piece of information within a mountain of unsorted documents; this is the challenge posed by unstructured data.
In a nutshell: structured data is easily processed by computers, whereas unstructured data requires more sophisticated techniques for analysis and interpretation.
Q 2. Describe various data gathering methods and their applications.
Data gathering methods are diverse, each suited to different contexts and data types. Here are some prominent examples:
- Surveys: Used for collecting quantitative and qualitative data from a target population. For example, a customer satisfaction survey collects feedback about a product or service.
- Interviews: Provide in-depth insights through direct conversations. They can be structured (with pre-defined questions) or unstructured (allowing for open-ended discussion). Imagine interviewing candidates for a job to assess their skills and experience.
- Observations: Involve systematically watching and recording behaviors or events. For instance, observing customer traffic flow in a retail store to optimize layout.
- Experiments: Involve manipulating variables to test a hypothesis. A/B testing in website design is a prime example, comparing two different versions of a page to see which performs better.
- Web Scraping: Extracting data from websites automatically. Imagine gathering product information from e-commerce sites to build a price comparison tool.
- APIs (Application Programming Interfaces): Accessing data from other applications or services. For example, using a Twitter API to gather tweets related to a specific hashtag.
- Databases: Retrieving data from organized databases such as SQL or NoSQL databases. This is fundamental for business intelligence and data analysis projects.
The choice of method often depends on factors like research objectives, budget, time constraints, and the type of data required.
Q 3. What are the ethical considerations in data gathering?
Ethical considerations in data gathering are paramount. We must prioritize privacy, security, and fairness. Key aspects include:
- Informed Consent: Individuals should be fully aware of how their data will be used and have the right to opt out.
- Data Minimization: Collect only the necessary data. Avoid collecting excessive or irrelevant information.
- Data Security: Protect data from unauthorized access, use, disclosure, disruption, modification, or destruction.
- Transparency: Be open about data collection practices. Explain clearly how the data is used and protected.
- Anonymization and Pseudonymization: Techniques to remove or mask identifying information to protect individual privacy.
- Bias Mitigation: Actively address potential biases in data collection methods and datasets. This ensures fair and equitable outcomes.
Failing to consider these ethics can lead to legal issues, reputational damage, and erosion of public trust.
Q 4. How do you ensure data quality during the collection process?
Ensuring data quality is crucial. It involves a multi-faceted approach starting from the design phase:
- Define clear data requirements: Specify the data needed, its format, and quality standards upfront.
- Use validated data entry methods: Implement data validation rules (e.g., range checks, data type checks) to prevent errors.
- Employ data cleaning techniques: Handle missing values, outliers, and inconsistencies in the data. This might involve imputation (filling in missing values) or outlier removal.
- Regular data audits: Conduct periodic checks to identify and correct data quality issues. This might involve reviewing data completeness, accuracy, consistency, and timeliness.
- Use appropriate data collection tools: Select tools that offer data validation features and facilitate efficient data entry.
- Train data collectors: Provide thorough training to data collectors on data collection procedures and quality standards.
Proactive quality control measures are more cost-effective than dealing with poor data quality later in the analysis phase.
Q 5. What techniques do you use to handle missing data?
Missing data is a common challenge. Strategies to handle it depend on the nature and extent of the missingness:
- Deletion: Removing rows or columns with missing data. This is simple but can lead to significant information loss, especially with a large amount of missing data. Use this sparingly.
- Imputation: Replacing missing values with estimated values. Methods include mean/median/mode imputation (simple but can distort data), regression imputation (predicts missing values based on other variables), and k-Nearest Neighbors (finds similar data points to estimate missing values).
- Model-based imputation: Using machine learning models to predict missing values based on patterns in the data. This is usually more robust than simple methods.
- Multiple imputation: Creating multiple plausible imputed datasets and then combining the results. This handles uncertainty in the imputation process better.
The best approach depends on the amount of missing data, the pattern of missingness, and the impact on the analysis. It’s often necessary to explore multiple strategies and compare the results.
Q 6. How do you identify and address biases in data collection?
Addressing biases is crucial for data integrity. The process involves:
- Identifying potential sources of bias: Carefully examine data collection methods, sampling techniques, and data definitions for potential biases. For example, a survey conducted only online might exclude individuals without internet access, leading to sampling bias.
- Employing representative sampling techniques: Use techniques like stratified sampling or cluster sampling to ensure a representative sample of the population.
- Using objective data collection methods: Minimize subjective judgment in data collection. Use standardized procedures and tools.
- Preprocessing techniques: Use data transformation techniques such as standardization, normalization, or weighting to mitigate bias in the data.
- Careful interpretation of results: Acknowledge potential limitations and biases when interpreting the findings. Clearly state any potential biases identified and their impact on the results.
Remember that eliminating all bias is nearly impossible, but by acknowledging and addressing potential biases, we strive for more accurate and reliable insights.
Q 7. Explain your experience with different data sources (databases, APIs, web scraping).
My experience encompasses a wide range of data sources. I’ve extensively worked with:
- Relational Databases (SQL): I’m proficient in querying and manipulating data from SQL databases like MySQL, PostgreSQL, and SQL Server using SQL. I’ve managed large datasets, optimized queries for performance, and designed database schemas for various projects. For example, I built a data warehouse for a client using SQL Server to integrate data from various operational databases.
- NoSQL Databases: I have experience working with NoSQL databases such as MongoDB and Cassandra, particularly useful for handling large volumes of unstructured or semi-structured data. For instance, I used MongoDB to store and analyze user activity data for a social media platform.
- APIs: I’ve effectively integrated data from various APIs, including those for social media platforms, weather services, and payment gateways. I’m comfortable using RESTful APIs and handling JSON or XML responses. Recently, I integrated a payment processing API into an e-commerce application.
- Web Scraping: I’ve used tools like Beautiful Soup and Scrapy in Python to extract data from websites, handling challenges like dynamic content, pagination, and website structure changes. For instance, I scraped product information from multiple e-commerce sites to create a price comparison engine.
My ability to work across these varied sources allows me to collect comprehensive datasets, tailoring the approach to the specific characteristics of each data source.
Q 8. Describe your experience with data cleaning and preprocessing techniques.
Data cleaning and preprocessing are crucial steps in any data gathering project, ensuring the data is accurate, consistent, and ready for analysis. It’s like preparing ingredients before cooking – you wouldn’t start making a cake with rotten eggs, would you? My experience encompasses a wide range of techniques. This includes:
- Handling Missing Values: I employ various methods depending on the context, such as imputation (filling in missing values using mean, median, mode, or more sophisticated algorithms like k-Nearest Neighbors), or removal of rows/columns with excessive missing data. For example, if a customer survey has many missing responses for a particular question, it might be wise to remove that question or flag those responses for exclusion.
- Outlier Detection and Treatment: Outliers, or extreme values, can skew results. I use techniques like box plots, scatter plots, and Z-score calculations to identify outliers. The treatment depends on the nature of the outlier. Sometimes, it’s appropriate to remove them; other times, capping (replacing extreme values with a less extreme value) or transformation (applying a logarithmic or other transformation) are better options. Imagine analyzing house prices – a single mansion worth $10 million would significantly skew average prices.
- Data Transformation: This involves converting data into a suitable format for analysis. This might include converting categorical variables into numerical ones using one-hot encoding or label encoding, standardizing or normalizing numerical features to have a similar scale, or dealing with inconsistent data formats (e.g., converting dates into a standard format).
- Data Consistency and Deduplication: I ensure data consistency by addressing inconsistencies in spelling, formatting, and units. Deduplication is crucial to eliminate duplicate entries, preventing overrepresentation and skewed analysis.
I choose the appropriate methods based on the data’s characteristics and the project’s goals. A thorough understanding of the data and its context is paramount in ensuring effective cleaning and preprocessing.
Q 9. How do you determine the appropriate sample size for a data gathering project?
Determining the appropriate sample size is vital for accurate and reliable results without unnecessary costs or time investment. It’s a balance between precision and practicality. Several factors influence sample size determination:
- Population Size: Larger populations require larger samples, but the increase is not linear. For very large populations, the sample size may only need to increase marginally.
- Desired Margin of Error: A smaller margin of error (more precision) requires a larger sample size. This reflects how much variability you’re willing to accept in your estimates.
- Confidence Level: The confidence level indicates the probability that your results will fall within the margin of error (e.g., 95% confidence means you’re 95% sure your estimate is accurate). Higher confidence levels require larger sample sizes.
- Population Variability: Higher variability within the population requires a larger sample size. Imagine you’re surveying customer satisfaction – a highly diverse customer base will necessitate a larger sample compared to a more homogenous one.
I often use sample size calculators or statistical power analysis techniques to determine the appropriate sample size. These tools consider the above factors and provide a scientifically justified sample size.
Q 10. What are the key performance indicators (KPIs) you use to evaluate data quality?
Evaluating data quality is crucial for ensuring the reliability of any analysis. Key Performance Indicators (KPIs) I use include:
- Completeness: The percentage of data points that are not missing. High completeness indicates a robust dataset.
- Accuracy: The percentage of data points that are correct. This might involve comparing against known values or using validation techniques.
- Consistency: The degree to which data is uniform and free from contradictions. This checks for inconsistencies in data formats or values.
- Validity: Whether the data accurately represents the real-world phenomenon being measured. This often involves comparing data against domain knowledge or established benchmarks.
- Uniqueness: The absence of duplicate entries. Duplicates can skew analysis.
- Timeliness: The currency of the data; how recent it is. For some applications, timely data is critical.
I regularly monitor these KPIs throughout the data gathering process. Tracking these metrics helps identify and address issues early on, resulting in higher-quality data and more reliable insights.
Q 11. How do you handle large datasets efficiently?
Handling large datasets efficiently requires strategic approaches. My strategies involve:
- Data Sampling: Analyzing a representative subset of the data for initial exploration and testing. This allows faster prototyping and testing of algorithms before processing the entire dataset.
- Distributed Computing: Utilizing frameworks like Apache Spark or Hadoop to distribute processing across multiple machines, significantly reducing processing time for large datasets.
- Data Optimization: Employing techniques to reduce data size without sacrificing important information, such as data compression or feature selection.
- Database Optimization: Ensuring the database is properly indexed and tuned for efficient querying. This often involves creating appropriate indexes and using optimized query strategies.
- Incremental Processing: Processing data in batches or increments instead of all at once. This approach is particularly useful for streaming data.
The choice of method depends on the dataset’s size, structure, and the specific analytical tasks. For instance, I might use sampling for exploratory analysis and then switch to distributed computing for more comprehensive model training.
Q 12. What tools and technologies are you proficient in for data gathering?
My proficiency in data gathering tools and technologies spans various categories:
- Programming Languages: Python (with libraries like Pandas, NumPy, and Scrapy), R
- Data Extraction Tools: Web scraping tools (Selenium, Beautiful Soup), APIs, ETL (Extract, Transform, Load) tools like Apache Kafka and Informatica.
- Databases: SQL (MySQL, PostgreSQL, SQL Server), NoSQL (MongoDB, Cassandra)
- Cloud Platforms: AWS (Amazon Web Services), Google Cloud Platform (GCP), Azure
- Data Visualization Tools: Tableau, Power BI, Matplotlib, Seaborn
I choose the most appropriate tools depending on the specific data source, data format, and project requirements. For example, I’d use web scraping for unstructured data from websites, while I’d use APIs for structured data from online services.
Q 13. Explain your experience with data visualization tools.
Data visualization is key to communicating insights effectively. My experience includes:
- Tableau and Power BI: These are powerful business intelligence tools for creating interactive dashboards and reports for stakeholders. I’ve used them to create compelling visualizations from complex datasets, translating raw data into actionable stories.
- Matplotlib and Seaborn (Python): These libraries offer greater control for creating publication-quality visualizations tailored for specific analysis. They are particularly valuable for creating custom plots and graphs not readily available in business intelligence tools.
- Choosing the Right Chart Type: I understand the strengths of different chart types (bar charts, line charts, scatter plots, histograms, etc.) and select the most appropriate chart for the data and message. A poorly chosen chart can misrepresent data, so making the correct choice is critical.
Effective data visualization goes beyond simply creating charts; it’s about communicating a clear and concise narrative that drives understanding and action. I always consider the audience and the key insights I want to communicate when creating visualizations.
Q 14. Describe your experience with SQL and its role in data gathering.
SQL is fundamental to data gathering, especially when dealing with relational databases. My experience encompasses:
- Data Extraction: Writing efficient SQL queries to extract relevant data from databases. This includes using joins, subqueries, and aggregate functions to retrieve the necessary information.
- Data Cleaning: Using SQL for data cleaning tasks like identifying and removing duplicates, handling missing values, and enforcing data consistency. For example, I might use
UPDATEstatements to correct data orDELETEstatements to remove problematic rows. - Data Transformation: Performing data transformations within SQL, such as converting data types, calculating new fields, and creating summary tables.
- Database Management: Designing and maintaining databases, ensuring data integrity and efficiency. This involves schema design and query optimization.
For example, I might use a query like this to extract customer data from a database:
SELECT customer_id, name, email FROM customers WHERE country = 'USA';SQL allows me to efficiently process large datasets residing in relational databases, making it an indispensable tool in my data gathering arsenal.
Q 15. How do you ensure data security and privacy during data gathering?
Data security and privacy are paramount during data gathering. It’s not just about complying with regulations like GDPR or CCPA; it’s about building trust and protecting sensitive information. My approach involves a multi-layered strategy:
- Data Minimization: Only collect the data absolutely necessary for the project. Avoid unnecessary information collection to reduce the risk of breaches.
- Encryption: Data should be encrypted both in transit (using HTTPS) and at rest (using database encryption). This renders the data unreadable to unauthorized individuals, even if a breach occurs.
- Access Control: Implement strict access control measures, using role-based access control (RBAC) to limit who can access and modify the data. Only authorized personnel should have access, based on their job responsibilities.
- Anonymization/Pseudonymization: When possible, anonymize or pseudonymize data to remove personally identifiable information (PII). This significantly reduces privacy risks.
- Secure Storage: Data should be stored in secure, well-maintained servers or cloud platforms with appropriate security measures in place, including regular security audits and penetration testing.
- Data Loss Prevention (DLP): Employ DLP tools to monitor and prevent sensitive data from leaving the organization’s controlled environment.
- Consent and Transparency: Always obtain informed consent from individuals before collecting their data and be transparent about how the data will be used. Clearly communicate your privacy policy.
For example, in a recent project involving customer survey data, we implemented end-to-end encryption and used hashed identifiers instead of directly storing email addresses or names to maintain anonymity.
Career Expert Tips:
- Ace those interviews! Prepare effectively by reviewing the Top 50 Most Common Interview Questions on ResumeGemini.
- Navigate your job search with confidence! Explore a wide range of Career Tips on ResumeGemini. Learn about common challenges and recommendations to overcome them.
- Craft the perfect resume! Master the Art of Resume Writing with ResumeGemini’s guide. Showcase your unique qualifications and achievements effectively.
- Don’t miss out on holiday savings! Build your dream resume with ResumeGemini’s ATS optimized templates.
Q 16. What is your experience with data integration techniques?
Data integration is the process of combining data from diverse sources into a unified view. My experience spans various techniques, including:
- ETL (Extract, Transform, Load): This is a classic approach. I’ve used tools like Informatica PowerCenter and Talend to extract data from various sources (databases, APIs, flat files), transform it to a consistent format, and load it into a target data warehouse or lake.
- ELT (Extract, Load, Transform): This approach loads raw data into a data lake first, then performs transformations as needed. This is beneficial for handling large, unstructured datasets. I’ve used cloud-based data lakes like AWS S3 and Azure Data Lake Storage, leveraging tools like Spark for data transformations.
- API Integration: I’m proficient in integrating data from various APIs using RESTful services and SDKs. This allows for real-time data integration and automation.
- Data Virtualization: This technique creates a unified view of data without actually moving or copying the data. This is helpful for combining data from numerous sources without significant performance overhead. I’ve worked with tools that support data virtualization, such as Denodo.
In a previous project, I integrated customer data from a CRM system, sales data from an ERP system, and website analytics data to create a 360-degree view of the customer, allowing for more effective marketing campaigns.
Q 17. How do you validate the accuracy and reliability of gathered data?
Validating data accuracy and reliability is crucial. My approach involves a combination of techniques:
- Source Validation: Assessing the credibility and trustworthiness of the data sources. This includes checking data quality metrics, understanding data collection methodologies, and verifying the source’s reputation.
- Data Profiling: Analyzing the data to identify inconsistencies, outliers, and missing values. Tools like Python libraries (pandas, NumPy) are essential for this process.
- Data Cleansing: Correcting or removing inaccurate, incomplete, or irrelevant data. This might involve techniques like imputation (filling in missing values), outlier removal, and data standardization.
- Cross-Validation: Comparing data from multiple sources to identify discrepancies and inconsistencies. This helps ensure data accuracy and identify potential errors.
- Schema Validation: Ensuring that the data conforms to the expected data structure and format. This can be achieved through schema definition languages like JSON Schema or XML Schema.
For instance, in a project involving sensor data, I used statistical methods to detect anomalies and developed data quality rules to ensure data accuracy and consistency before incorporating it into our analytics pipeline.
Q 18. How do you handle conflicting data from different sources?
Conflicting data from different sources is a common challenge. Resolving these conflicts requires a careful and methodical approach:
- Identify the Conflict: Clearly define the nature and extent of the conflict. Understand which data points are in disagreement and from which sources.
- Prioritize Data Sources: Assign weights or priorities to different sources based on their reliability and accuracy. This is based on understanding the data sources and their trustworthiness. Higher-quality sources should generally be given more weight.
- Data Reconciliation: Develop a strategy to reconcile conflicting data. This could involve using statistical methods (e.g., averaging, weighted averaging) or applying business rules to determine the most accurate value.
- Manual Review: For complex or critical conflicts, manual review by subject matter experts might be necessary to make informed decisions.
- Documentation: Meticulously document the resolution process, including the rationale behind the choices made. This ensures transparency and allows for easier auditing in the future.
In one project, we had conflicting customer address information from different systems. We prioritized data from our CRM system, as it was regularly updated, and manually reviewed and corrected discrepancies with data from other sources.
Q 19. Explain your experience with data warehousing and data lakes.
Data warehousing and data lakes are both crucial for storing and managing large datasets, but they serve different purposes. My experience includes working with both:
- Data Warehousing: I’ve worked extensively with data warehouses, designing and implementing them using technologies like Snowflake and Redshift. Data warehouses are schema-on-write, meaning data is structured and organized before being loaded. They are optimized for analytical querying and reporting. I understand the importance of dimensional modeling and ETL processes in the context of data warehousing.
- Data Lakes: I’ve used cloud-based data lakes (AWS S3, Azure Data Lake Storage) for storing raw, unstructured data. Data lakes are schema-on-read; data is organized and structured only when needed for analysis. This flexibility allows for handling diverse data types. I am familiar with using tools like Spark and Hive for processing and analyzing data in a data lake.
In a recent project, we used a hybrid approach, leveraging a data lake for storing raw data and a data warehouse for storing structured, curated data for analytical reporting.
Q 20. What is your experience with data governance and compliance?
Data governance and compliance are critical for ensuring data quality, integrity, and adherence to regulations. My experience includes:
- Developing data governance policies and procedures: Creating guidelines for data collection, storage, access, and usage, ensuring alignment with industry best practices and legal requirements.
- Data quality management: Implementing processes for monitoring and improving data quality, including data profiling, cleansing, and validation.
- Compliance with regulations: Ensuring compliance with relevant data privacy regulations such as GDPR, CCPA, HIPAA, etc. This includes implementing data security measures, obtaining necessary consents, and managing data subject requests.
- Metadata management: Implementing a system for managing metadata, providing information about the data’s origin, meaning, and quality.
- Data lineage tracking: Tracking the flow of data from its source to its destination, facilitating data governance and auditing.
In a previous role, I was instrumental in developing and implementing a data governance framework for a healthcare organization, ensuring compliance with HIPAA regulations and improving data quality.
Q 21. Describe a time you had to overcome a challenge in data gathering.
In one project, we faced a significant challenge gathering data from legacy systems. These systems were outdated, poorly documented, and had inconsistent data formats. Our initial attempts to extract data directly were unsuccessful due to system instability and data corruption.
To overcome this, we adopted a multi-pronged approach:
- Data Mapping: We meticulously mapped the data fields across different systems to identify inconsistencies and redundancies.
- Data Transformation: We developed custom scripts to transform the data into a consistent format, handling missing values and inconsistencies.
- Incremental Extraction: Instead of trying to extract all data at once, we implemented an incremental approach, extracting data in smaller batches to reduce the load on the legacy systems and improve reliability.
- Collaboration: We collaborated closely with the IT team responsible for maintaining the legacy systems to gain a better understanding of the system architecture and data structures. This collaborative approach was crucial for identifying and resolving technical issues.
This phased approach allowed us to successfully extract and integrate the data, ultimately enabling us to conduct the necessary analyses.
Q 22. How do you prioritize data gathering tasks in a project?
Prioritizing data gathering tasks requires a strategic approach that balances urgency, importance, and resource availability. I typically employ a combination of methods, starting with a clear understanding of project goals and objectives. This involves:
- Defining project scope and deliverables: A precise definition clarifies which data is crucial and which is secondary. For instance, in a customer satisfaction survey, data on demographics might be secondary to feedback on product features.
- Dependency analysis: Identifying dependencies between tasks is essential. Some data points might be prerequisites for others. For example, website traffic analysis might inform a subsequent customer segmentation exercise.
- Risk assessment: I evaluate potential challenges and delays. Data sources that are unreliable or difficult to access are prioritized lower unless crucial. For example, manual data entry from outdated systems carries a higher risk of errors and should be approached with caution.
- Resource allocation: Balancing available resources (time, personnel, tools) against task complexity is key. High-impact, low-effort tasks should be tackled early, building momentum. For example, readily accessible web APIs are better tackled before complex data extraction from legacy systems.
- Using prioritization frameworks: Methodologies like MoSCoW (Must have, Should have, Could have, Won’t have) or Eisenhower Matrix (Urgent/Important) offer structured approaches to decision-making.
Ultimately, the prioritization process is iterative. I regularly review and adjust the plan based on new information and evolving project needs.
Q 23. How do you communicate data findings to non-technical audiences?
Communicating data findings to non-technical audiences requires translating complex information into clear, concise, and engaging narratives. This involves avoiding jargon and focusing on the ‘so what?’ – the implications of the data. Here’s my approach:
- Visualizations are king: Charts, graphs, and infographics are far more effective than tables of numbers. I use tools like Tableau or Power BI to create visually appealing dashboards.
- Storytelling: Instead of simply presenting data points, I create a narrative around the findings, highlighting key trends and insights. Think of it as a detective story, revealing the clues (data) and their implications.
- Focus on the key takeaways: Highlighting the 2-3 most significant findings ensures the audience grasps the essential messages.
- Analogies and metaphors: Relating data to everyday experiences makes complex ideas more understandable. For instance, comparing website traffic growth to the growth of a plant can help non-technical people visualize the trend.
- Interactive elements: In presentations, I incorporate interactive elements like polls or quizzes to keep the audience engaged.
Ultimately, effective communication is about understanding the audience and tailoring the message to their level of understanding. Practice makes perfect!
Q 24. What are your strategies for managing data volume and velocity?
Managing data volume and velocity is a significant challenge in today’s data-rich environment. My strategies focus on efficient storage, processing, and analysis. These include:
- Data warehousing and data lakes: For large volumes, a well-designed data warehouse or data lake provides scalable storage and efficient retrieval. This involves careful schema design and indexing strategies.
- Big data technologies: Tools like Hadoop, Spark, and cloud-based services (AWS, Azure, GCP) allow for parallel processing of large datasets, overcoming the velocity challenge.
- Data streaming: Real-time data processing using technologies like Kafka or Apache Flink is essential when dealing with high-velocity data streams.
- Data sampling and aggregation: Reducing data volume by using representative samples or aggregating data into summaries can significantly improve processing speed without compromising insights. For example, instead of analyzing every transaction, aggregate daily sales figures.
- Data compression: Techniques like gzip or zlib can reduce storage space and improve transfer speeds.
Choosing the right technology stack depends on the specific needs of the project. For example, a small project might use a relational database, while a large-scale data analytics project would require a big data platform.
Q 25. Describe your experience with different data formats (CSV, JSON, XML).
I have extensive experience working with various data formats, including CSV, JSON, and XML. Each has its strengths and weaknesses:
- CSV (Comma Separated Values): Simple, widely supported, and easy to import into spreadsheets and databases. However, it lacks schema definition and can be difficult to parse for complex data structures.
Example: name,age,city John,30,New York Jane,25,London - JSON (JavaScript Object Notation): Lightweight, human-readable, and widely used for web APIs. Its hierarchical structure makes it suitable for complex data.
Example: {"name": "John", "age": 30, "city": "New York"} - XML (Extensible Markup Language): More verbose than JSON but offers strong schema validation and is well-suited for structured data exchange.
Example:John 30 New York
My experience extends to using programming languages (Python, R) and libraries (Pandas, json, xml.etree.ElementTree) to effectively read, process, and transform data from these formats. The choice of format depends on the source and application – a web API will likely use JSON, while a bulk data upload might use CSV.
Q 26. How do you choose the most appropriate data gathering method for a specific project?
Selecting the appropriate data gathering method is crucial for project success. The best method depends on the nature of the data, project goals, and available resources. Factors to consider include:
- Data source: Is the data readily available online, stored in databases, or requires manual collection?
- Data type: Is it structured, semi-structured, or unstructured?
- Data volume and velocity: Will the data volume be manageable or require sophisticated techniques?
- Budget and time constraints: Some methods are more expensive and time-consuming than others.
- Data quality requirements: Some methods offer higher data quality than others.
Possible methods include:
- Web scraping: For publicly available online data.
- APIs: For structured data from web services.
- Databases: For structured data residing in databases (SQL, NoSQL).
- Surveys and questionnaires: For collecting primary data from individuals.
- Interviews and focus groups: For in-depth qualitative data.
- Sensor data: For real-time data streams from physical devices.
Often, a combination of methods is necessary to obtain a comprehensive dataset. For example, a market research project might involve web scraping, surveys, and interviews.
Q 27. What is your experience with automated data gathering techniques?
Automated data gathering is crucial for efficiency and scalability. My experience includes leveraging several techniques:
- Web scraping with tools like Scrapy and Beautiful Soup (Python): Automating data extraction from websites. This includes handling pagination, dynamic content, and respecting robots.txt.
- APIs and SDKs: Programmatically accessing data from various sources (e.g., social media APIs, weather APIs). This involves understanding API documentation, authentication, and rate limiting.
- ETL (Extract, Transform, Load) processes: Using tools like Apache Airflow or cloud-based services to automate the entire data pipeline, from extraction to loading into a data warehouse. This often involves scripting and scheduling tasks.
- Database queries: Using SQL or other database languages to retrieve data from relational or NoSQL databases. Efficient querying is crucial for performance, particularly with large datasets.
- RPA (Robotic Process Automation): Automating repetitive tasks involving data entry or manipulation from various sources, including applications and spreadsheets.
Automation not only saves time and resources but also reduces human error. For example, automatically downloading daily stock prices eliminates manual entry and ensures consistency.
Q 28. Explain your understanding of data modeling and its relevance to data gathering.
Data modeling is the process of creating a visual representation of data structures and their relationships. It’s crucial for effective data gathering because a well-defined model ensures you collect the right data in the right format. This prevents inconsistencies and improves data quality.
- Conceptual modeling: Creates a high-level overview of the data entities and their relationships, independent of any specific database technology. Entities are described by their attributes.
- Logical modeling: Translates the conceptual model into a format suitable for a specific database management system (DBMS), defining data types, keys, and constraints.
- Physical modeling: Deals with the physical implementation of the database, including storage structures, indexes, and performance optimization.
Before starting data gathering, I would develop a data model to identify the necessary data points, relationships between them, and the desired data structure. This ensures consistency, simplifies data integration, and reduces redundancy. For example, a customer database would include entities like customers, orders, and products, with appropriate relationships defined.
In essence, data modeling provides a blueprint for data gathering, guiding the entire process and ensuring the collected data aligns with project goals.
Key Topics to Learn for Data Gathering Interview
- Data Sources & Selection: Understanding various data sources (databases, APIs, web scraping, surveys, etc.) and choosing the most appropriate source for a given task. Practical application: Evaluating the trade-offs between using a readily available dataset versus collecting original data.
- Data Cleaning & Preprocessing: Techniques for handling missing values, outliers, and inconsistencies in data. Practical application: Implementing data cleaning strategies using Python libraries like Pandas to prepare data for analysis.
- Data Validation & Quality Control: Methods for ensuring data accuracy and reliability. Practical application: Designing and implementing checks to identify and correct errors during the data gathering process.
- Data Ethics & Privacy: Understanding ethical considerations and legal requirements related to data collection, storage, and usage (GDPR, CCPA, etc.). Practical application: Discussing the ethical implications of using specific data sources and ensuring compliance with relevant regulations.
- Data Governance & Management: Principles and practices for managing data throughout its lifecycle. Practical application: Describing a system for tracking data provenance and ensuring data quality over time.
- Data Modeling & Representation: Choosing appropriate data structures and formats for effective storage and analysis. Practical application: Explaining the benefits of different database models (relational, NoSQL) for specific use cases.
- Tools & Technologies: Familiarity with relevant tools and technologies for data gathering (e.g., SQL, Python scripting, web scraping tools). Practical application: Describing your experience using specific tools for a previous project.
Next Steps
Mastering data gathering is crucial for career advancement in virtually any data-driven field. A strong understanding of these concepts will significantly improve your interview performance and open doors to exciting opportunities. To maximize your job prospects, invest time in creating an ATS-friendly resume that showcases your skills and experience effectively. ResumeGemini is a trusted resource to help you build a professional and impactful resume. They provide examples of resumes tailored to Data Gathering roles that can serve as excellent templates and inspiration. Take the next step in your career journey and craft a compelling resume that gets you noticed.
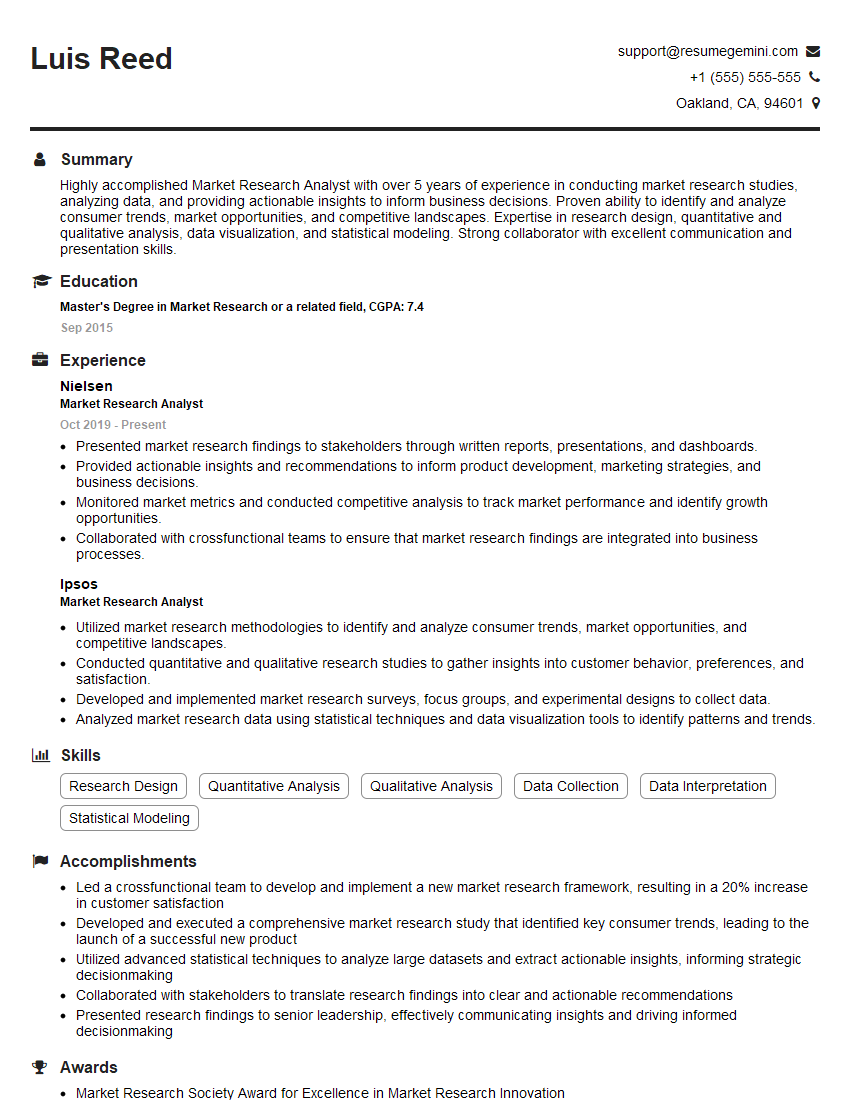
Market Research Analyst Resume Sample
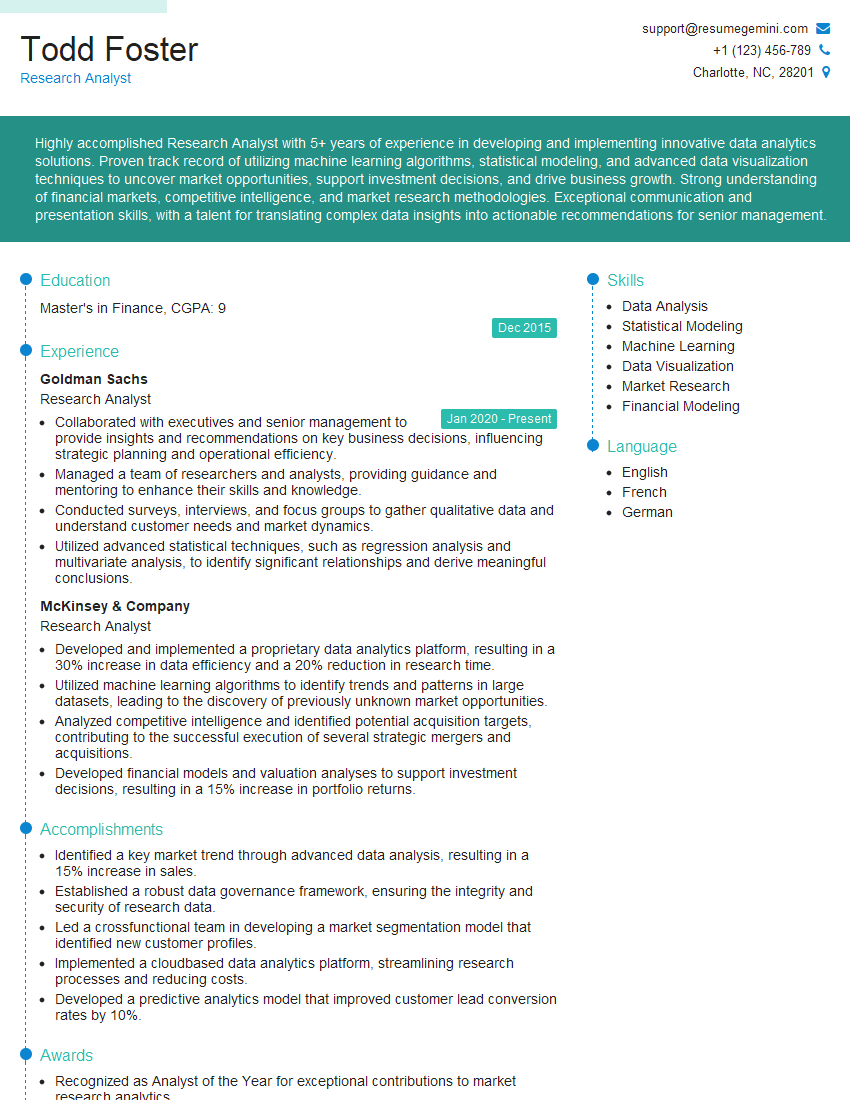
Research Analyst Resume Sample
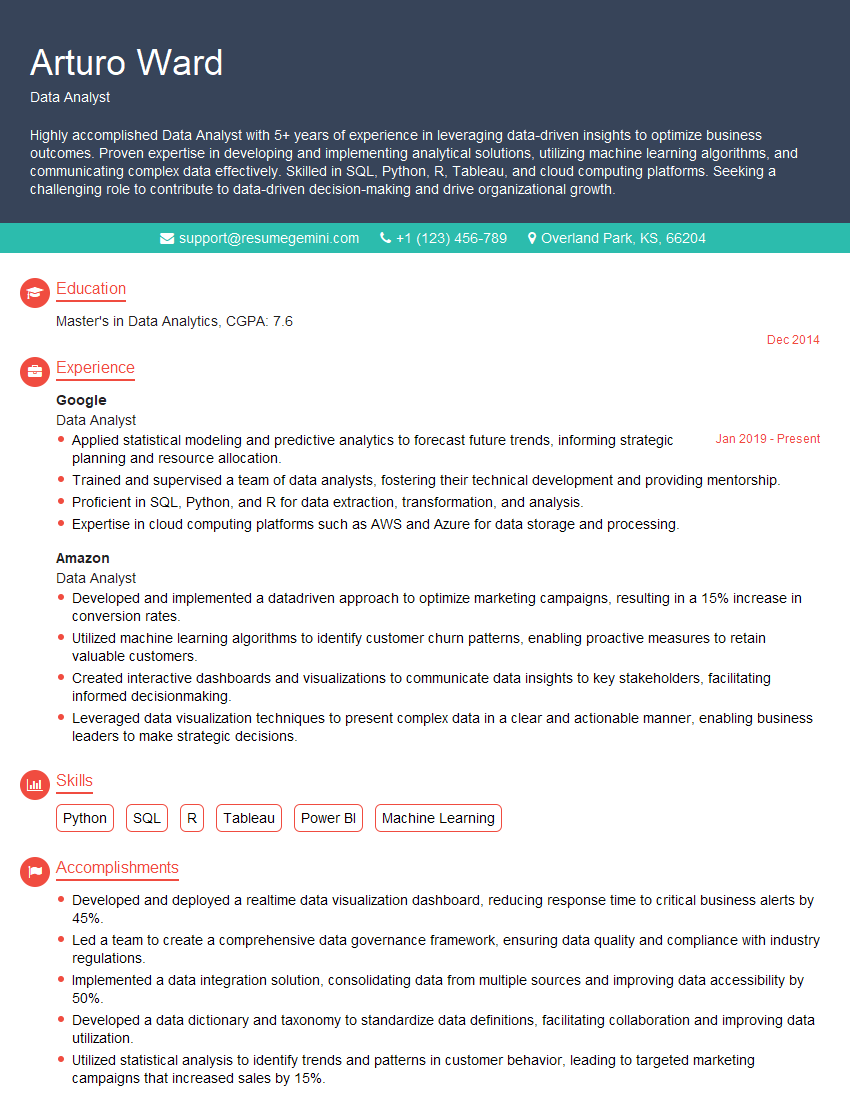
Data Analyst Resume Sample
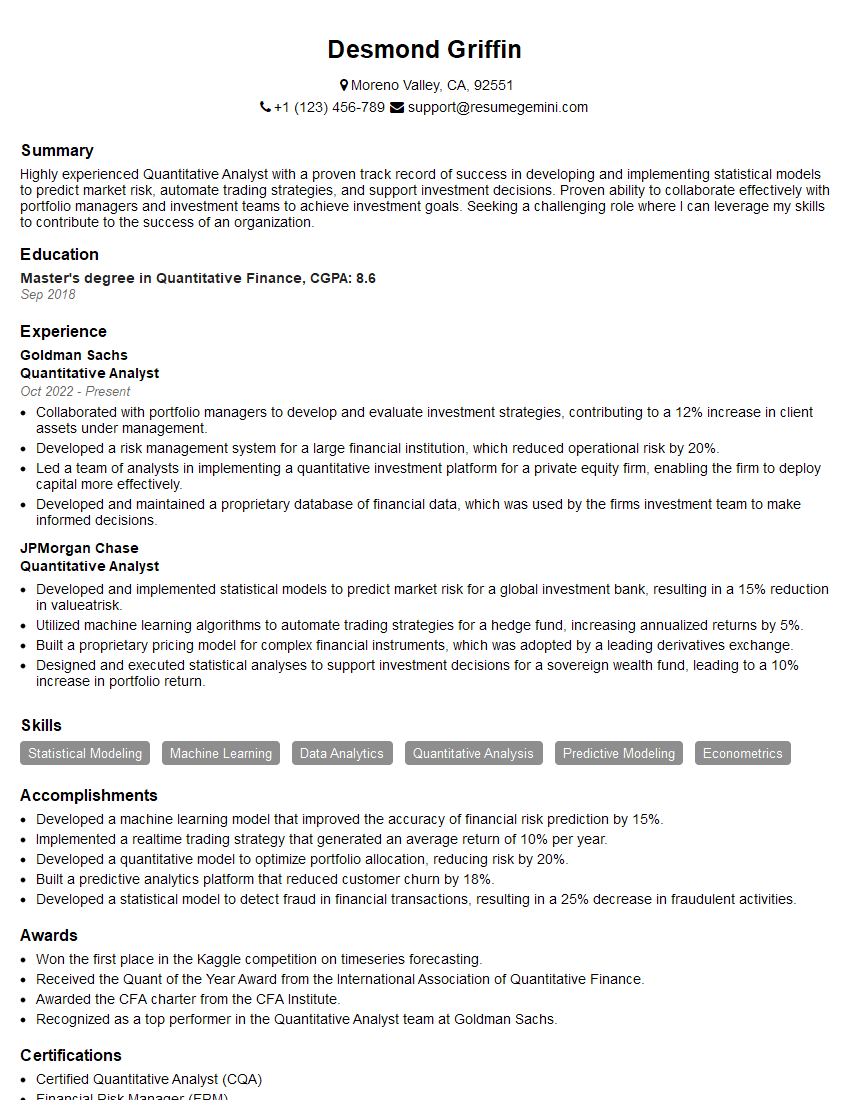
Quantitative Analyst Resume Sample
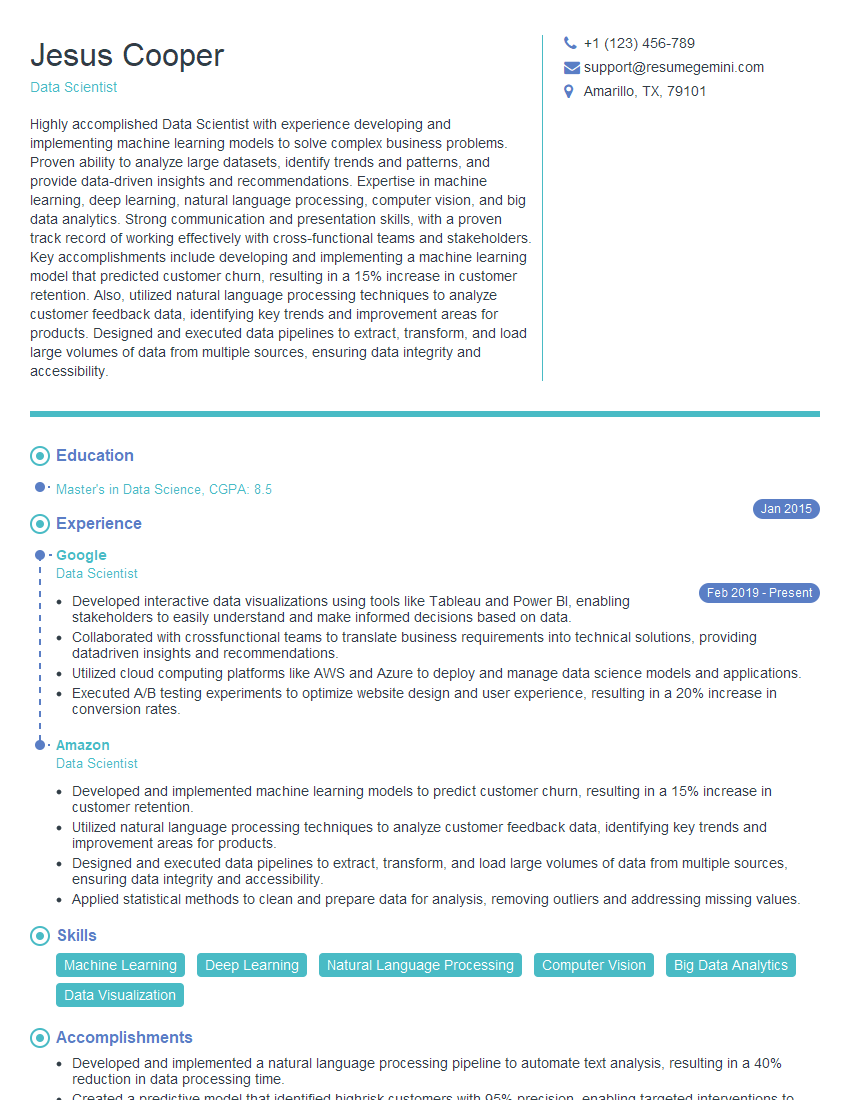
Data Scientist Resume Sample
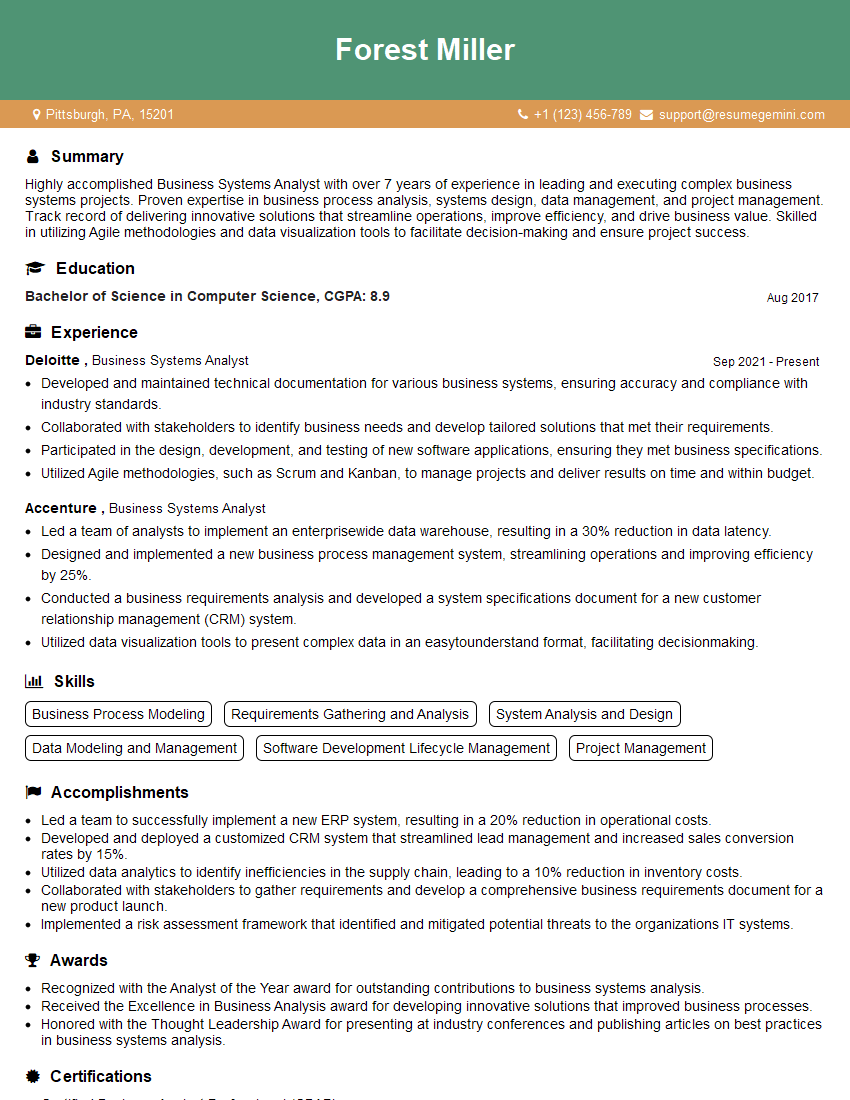
Business Systems Analyst Resume Sample
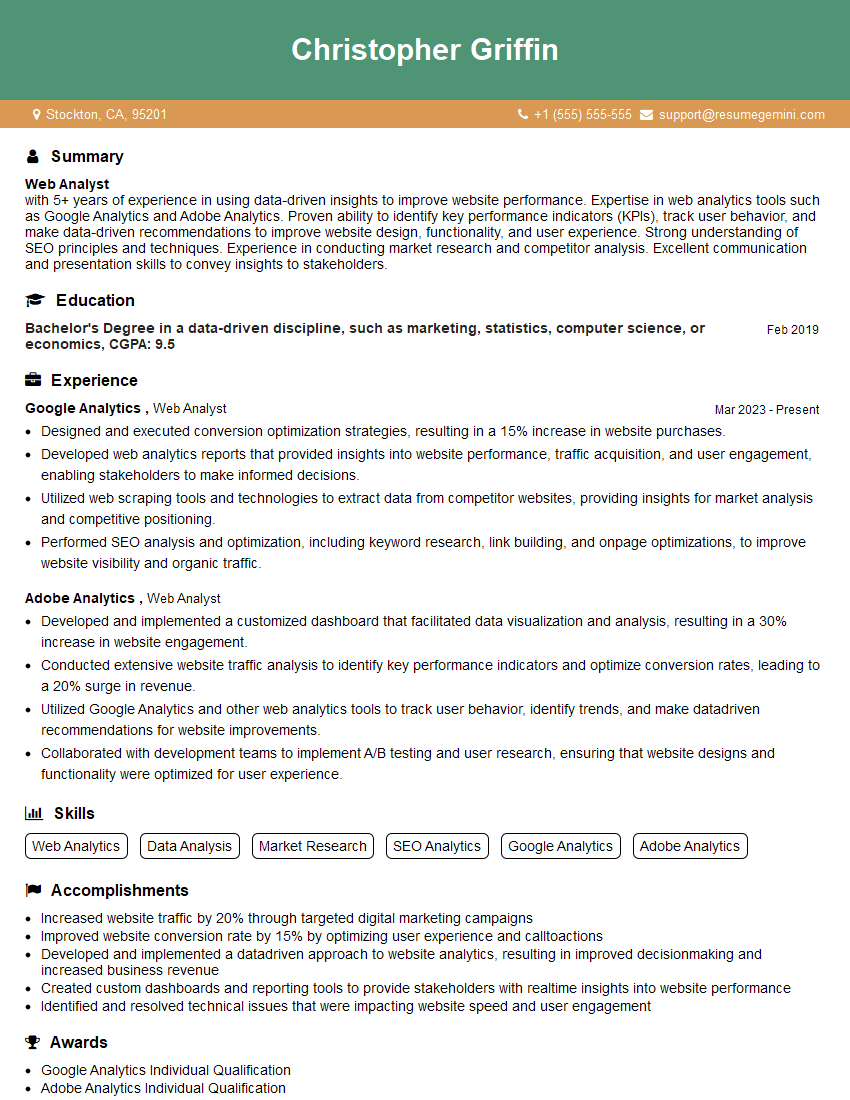
Web Analyst Resume Sample
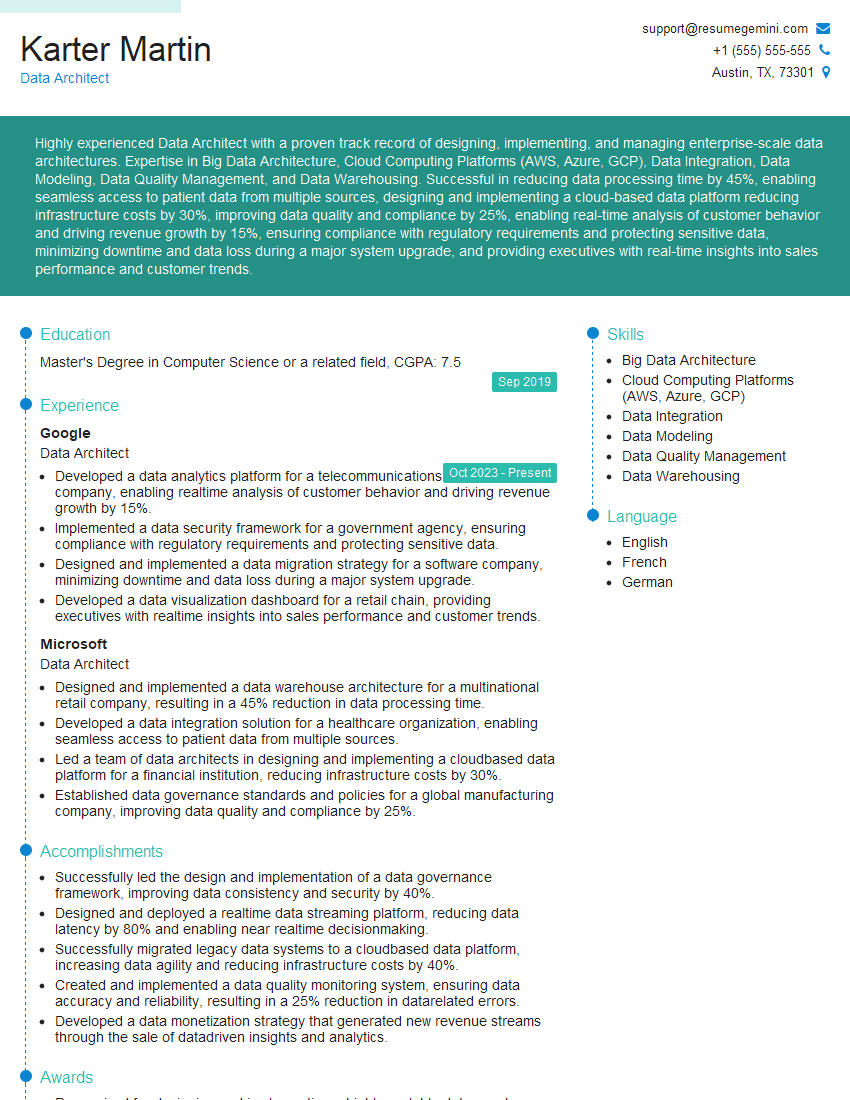
Data Architect Resume Sample
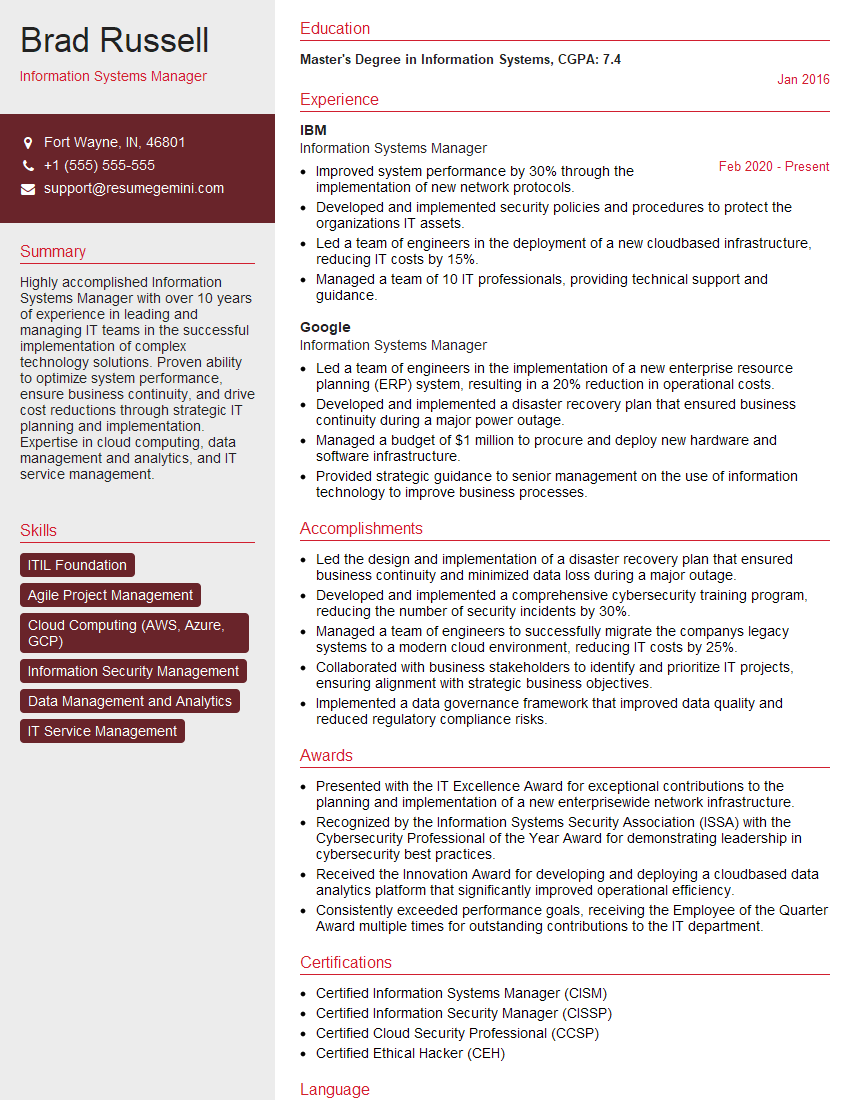
Information Systems Manager Resume Sample
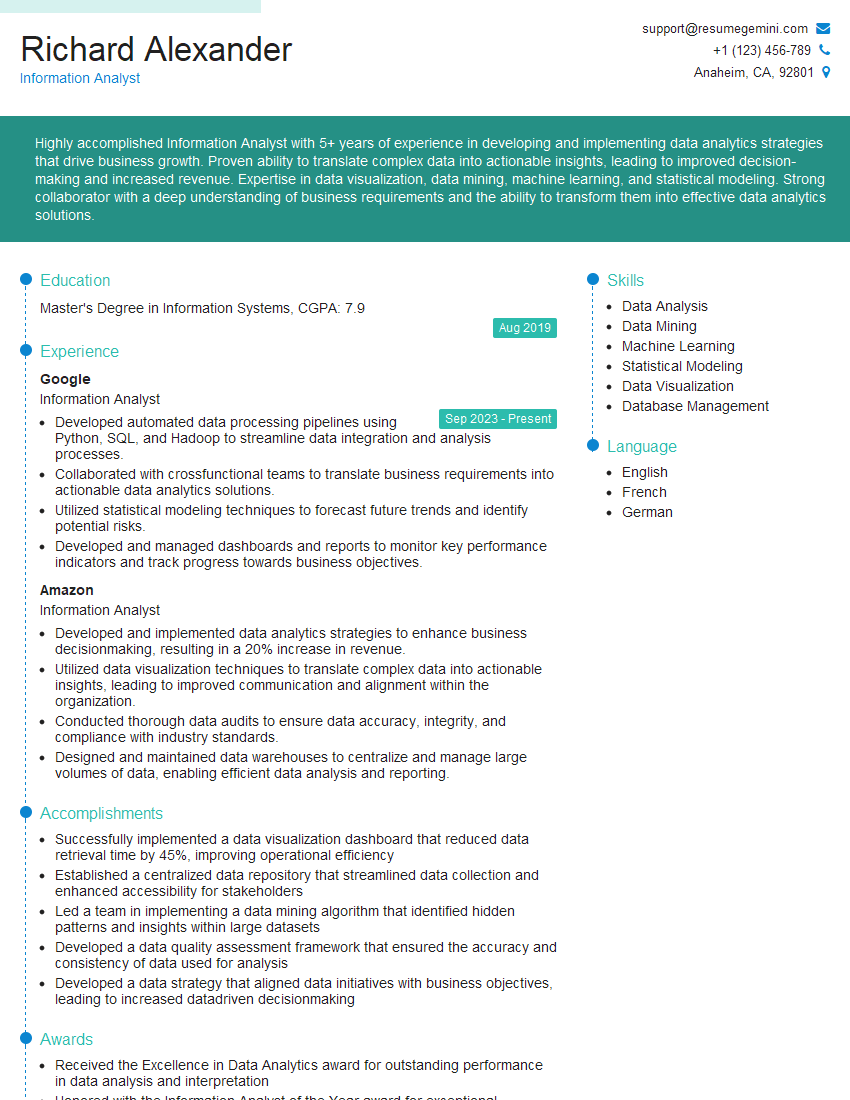
Information Analyst Resume Sample
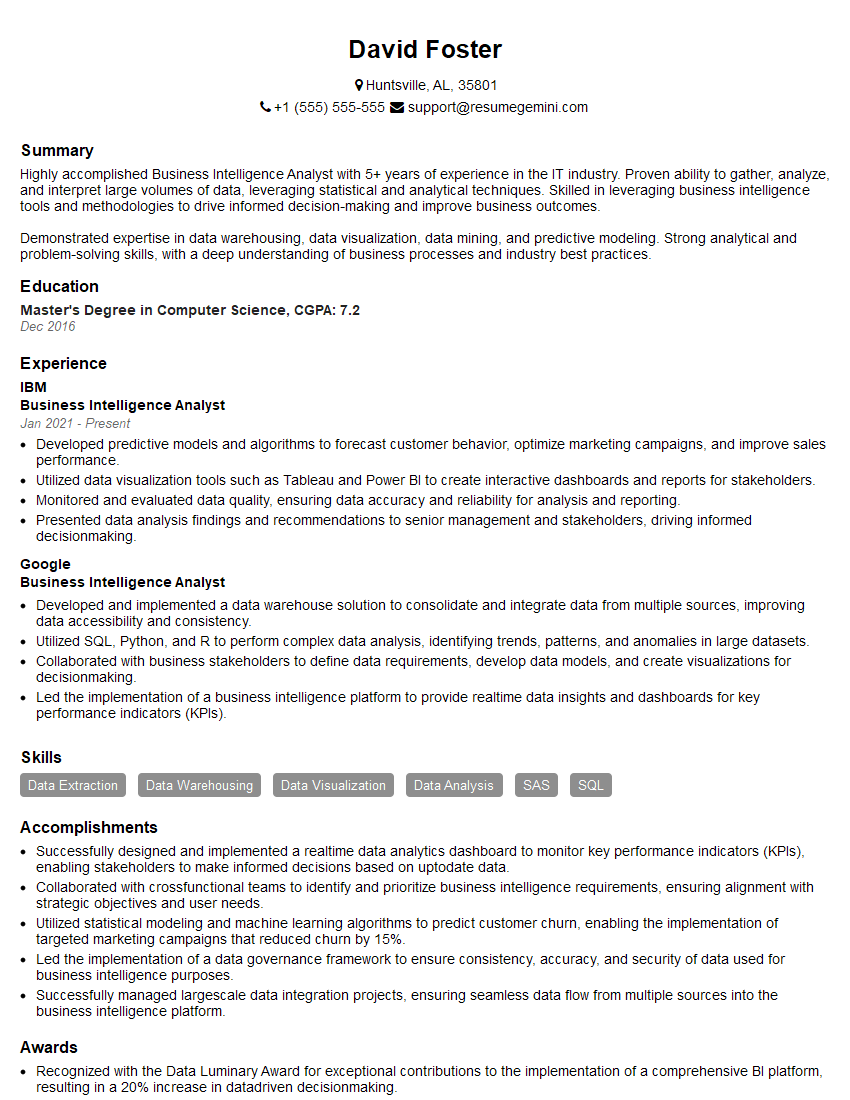
Business Intelligence Analyst Resume Sample
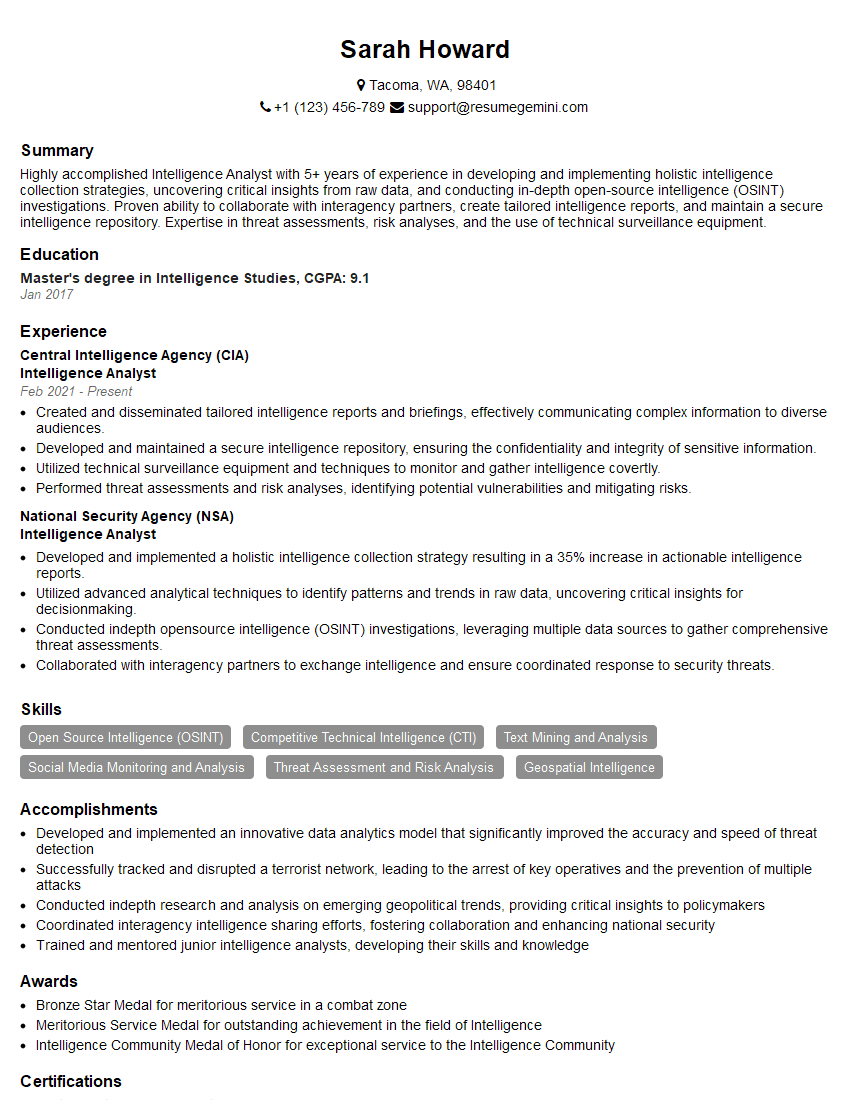
Intelligence Analyst Resume Sample
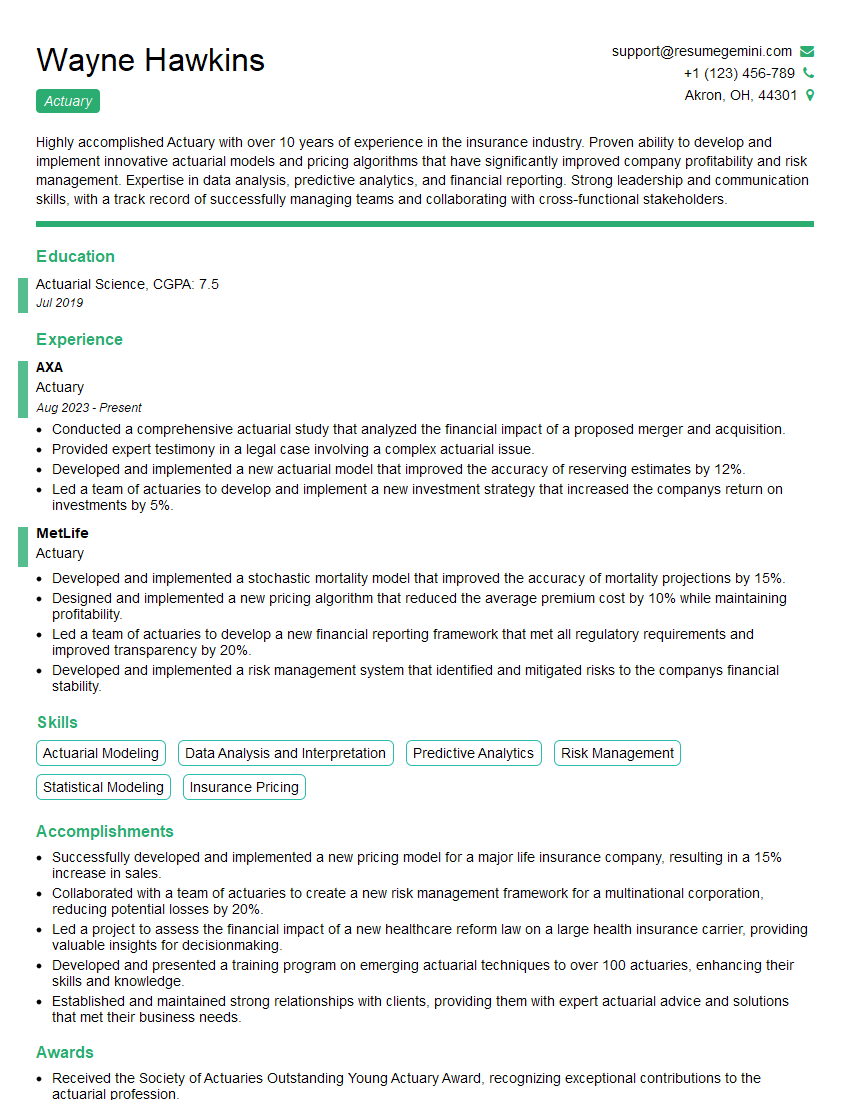
Actuary Resume Sample

Operations Research Analyst Resume Sample
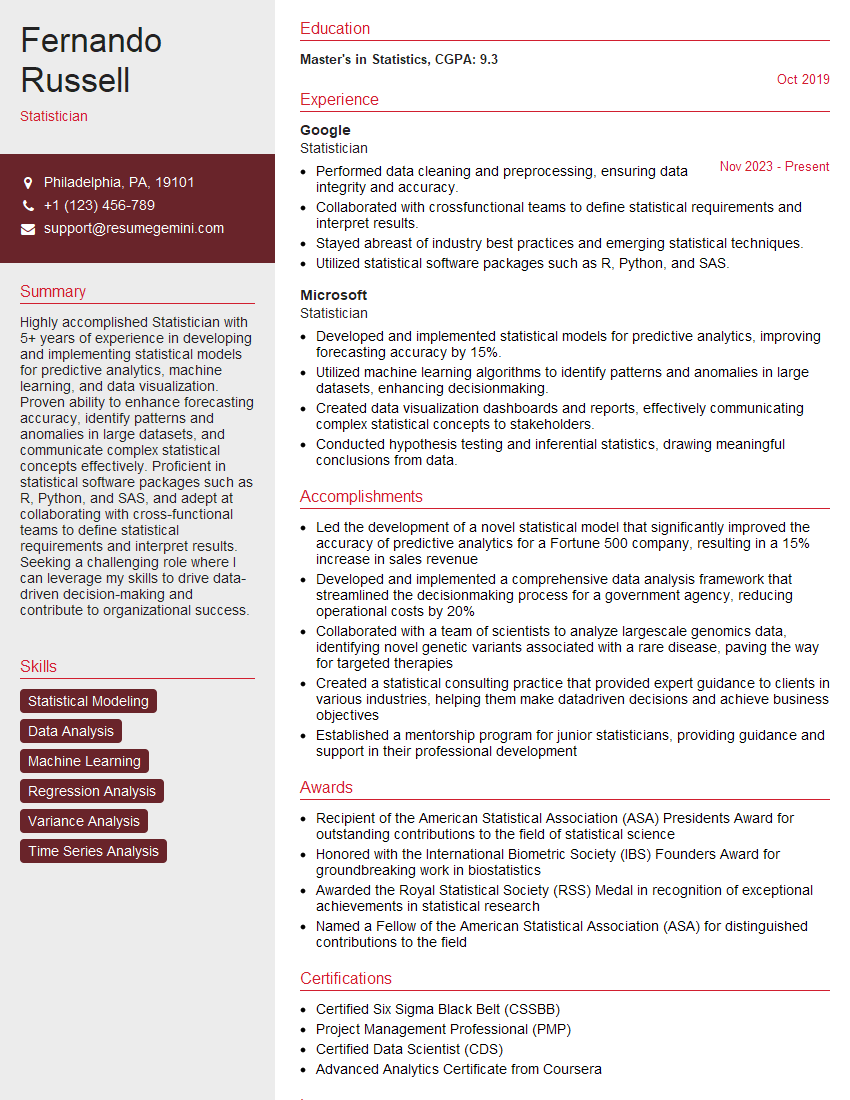
Statistician Resume Sample
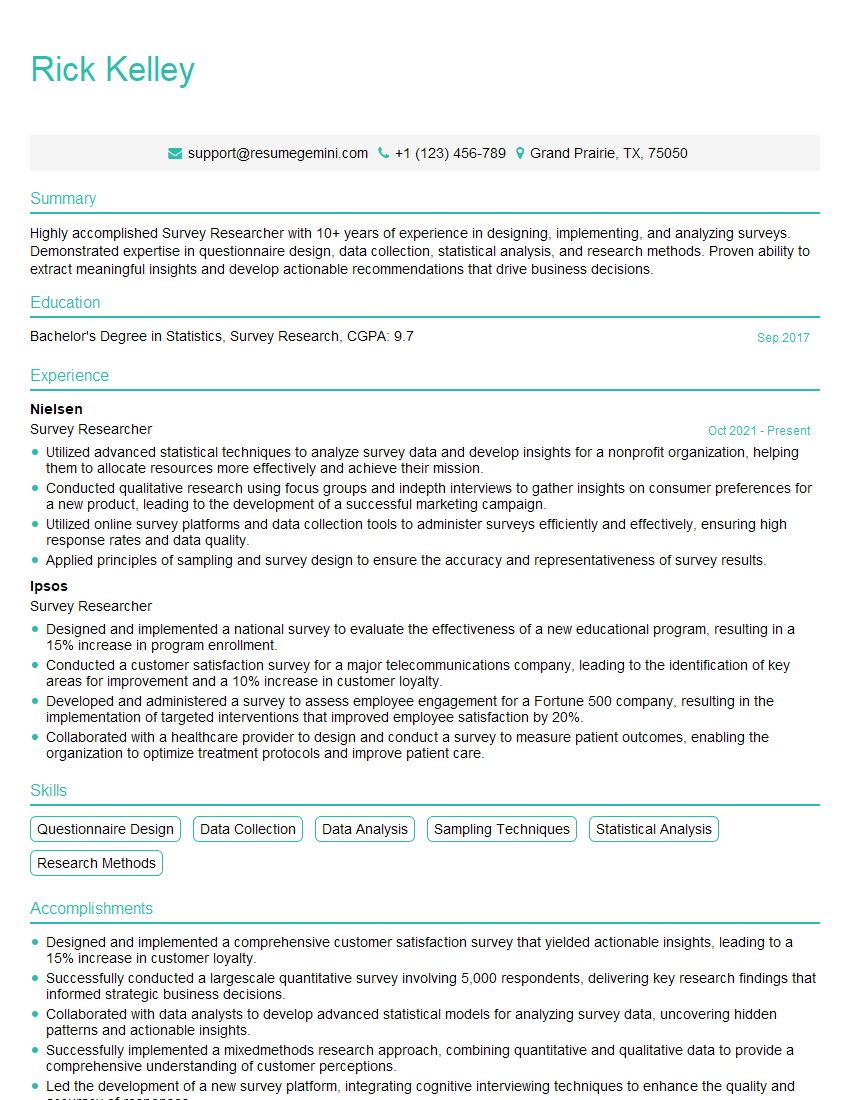
Survey Researcher Resume Sample
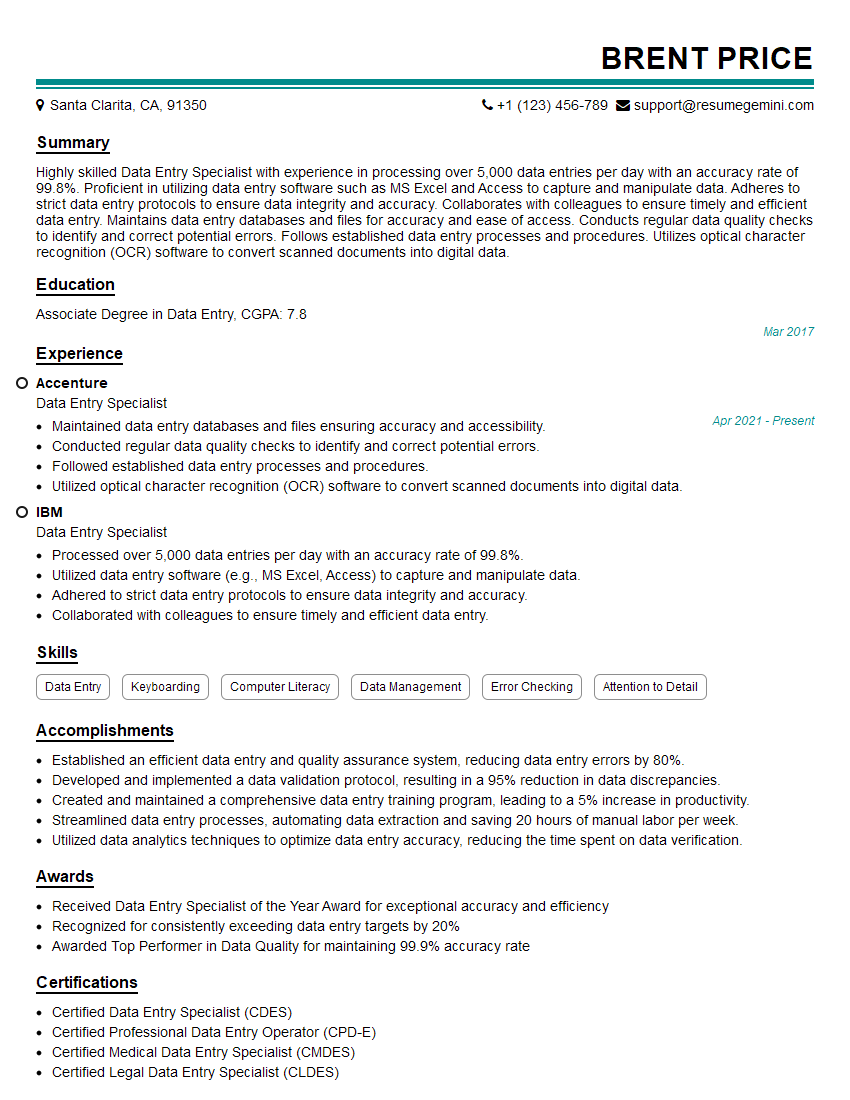
Data Entry Specialist Resume Sample
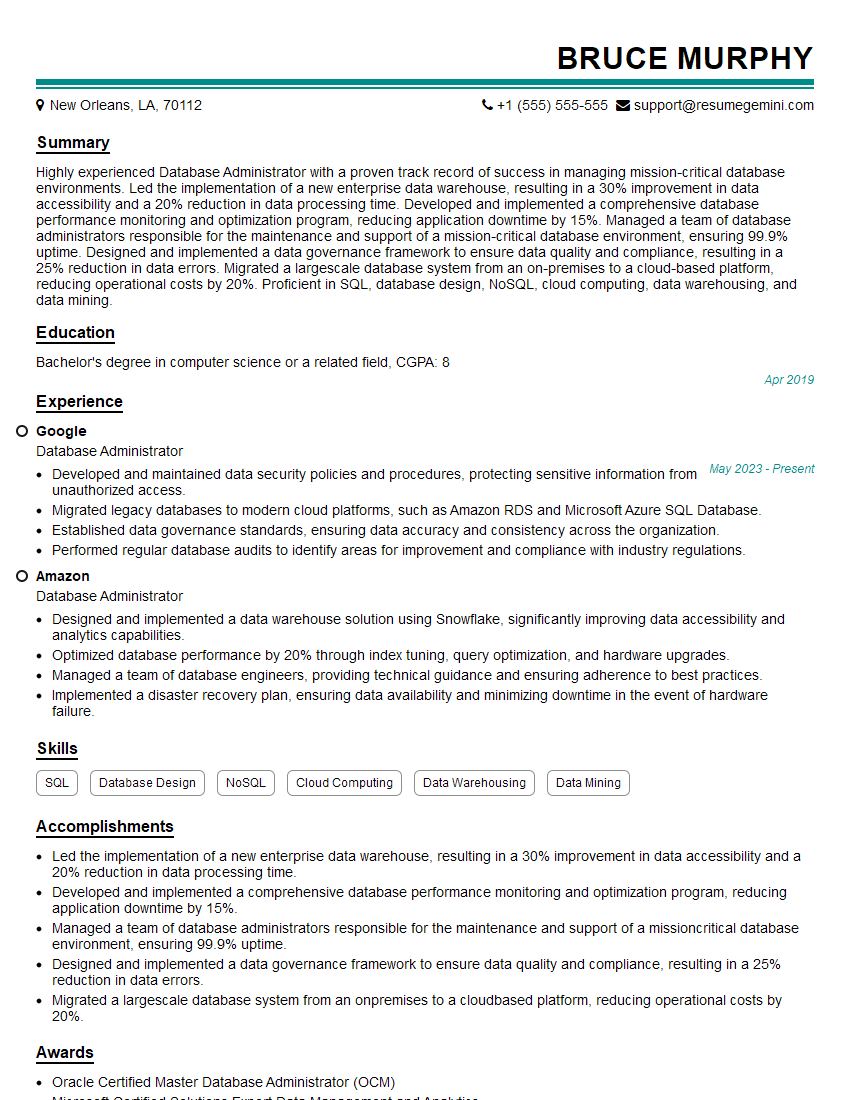
Database Administrator Resume Sample
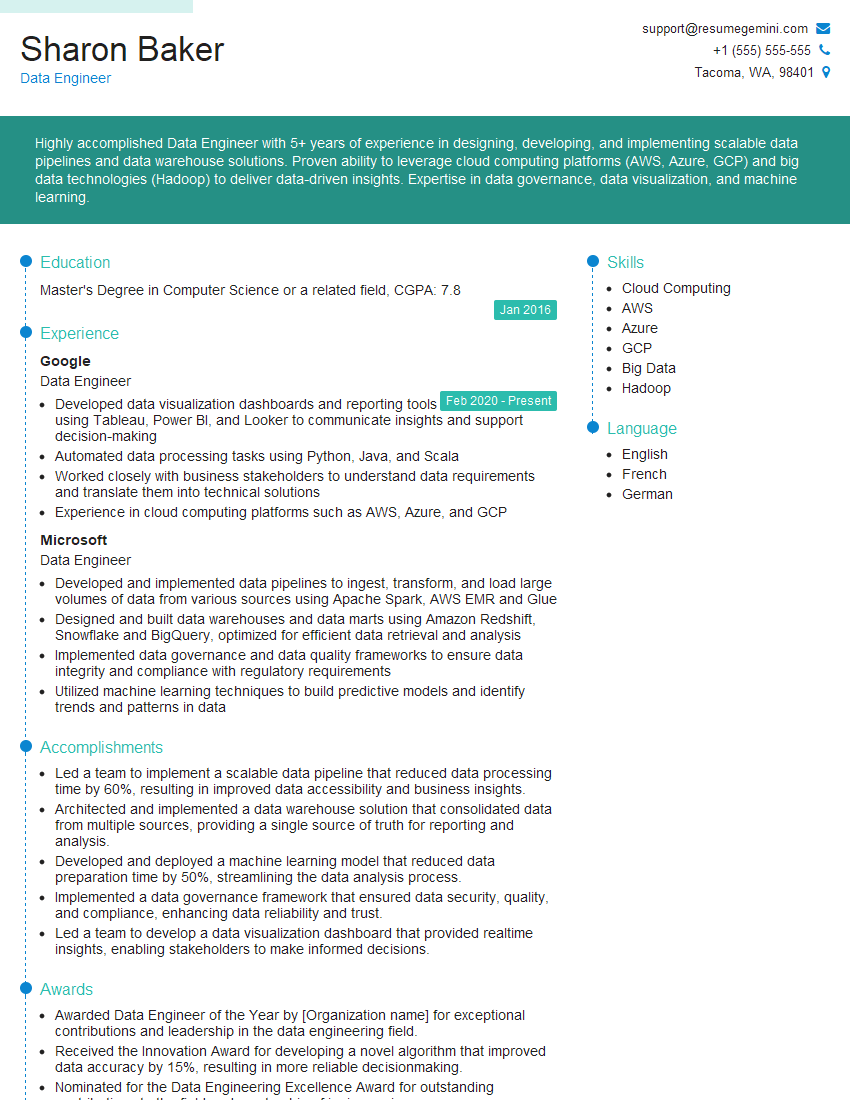
Data Engineer Resume Sample
- Market Research Analyst
- Research Analyst
- Data Analyst
- Quantitative Analyst
- Data Scientist
- Business Systems Analyst
- Web Analyst
- Data Architect
- Information Systems Manager
- Information Analyst
- Business Intelligence Analyst
- Intelligence Analyst
- Actuary
- Operations Research Analyst
- Statistician
- Survey Researcher
- Data Entry Specialist
- Database Administrator
- Data Engineer
Explore more articles
Users Rating of Our Blogs
Share Your Experience
We value your feedback! Please rate our content and share your thoughts (optional).
What Readers Say About Our Blog
To the interviewgemini.com Webmaster.
Very helpful and content specific questions to help prepare me for my interview!
Thank you
To the interviewgemini.com Webmaster.
This was kind of a unique content I found around the specialized skills. Very helpful questions and good detailed answers.
Very Helpful blog, thank you Interviewgemini team.