The thought of an interview can be nerve-wracking, but the right preparation can make all the difference. Explore this comprehensive guide to Electrocardiogram (ECG) interview questions and gain the confidence you need to showcase your abilities and secure the role.
Questions Asked in Electrocardiogram (ECG) Interview
Q 1. What are the standard ECG leads and their placement?
The standard 12-lead ECG uses ten electrodes placed on the patient’s limbs and chest to record electrical activity from different angles of the heart. This provides a comprehensive view of the heart’s electrical function.
- Limb Leads (4): These leads are bipolar, meaning they measure the difference in electrical potential between two points. They are placed on the wrists and ankles: Right Arm (RA), Left Arm (LA), Right Leg (RL), and Left Leg (LL). RL serves as a ground.
- Chest Leads (6): These are unipolar leads, measuring the electrical potential at a single point on the chest relative to a zero potential reference derived from the limb leads. They are placed as follows: V1 (fourth intercostal space, right sternal border), V2 (fourth intercostal space, left sternal border), V3 (midway between V2 and V4), V4 (fifth intercostal space, mid-clavicular line), V5 (fifth intercostal space, anterior axillary line), V6 (fifth intercostal space, mid-axillary line).
Accurate lead placement is crucial for correct ECG interpretation. Even a slightly misplaced electrode can significantly alter the waveforms and lead to misdiagnosis.
Q 2. Describe the normal ECG waveform components (P wave, QRS complex, T wave).
The normal ECG waveform comprises several key components representing different phases of the cardiac cycle:
- P wave: Represents atrial depolarization (electrical activation of the atria). It’s usually small, upright, and rounded. Think of it as the ‘atria contracting’ signal.
- QRS complex: Represents ventricular depolarization (electrical activation of the ventricles). It’s typically taller and more complex than the P wave, reflecting the larger mass of ventricular muscle. This is the ‘ventricles contracting’ signal.
- T wave: Represents ventricular repolarization (electrical recovery of the ventricles). It’s usually upright and broader than the P wave, but smaller than the QRS complex. This is the ‘ventricles relaxing’ signal.
The intervals between these waves (PR interval, QRS duration, QT interval) provide further information about conduction times and are equally important in ECG interpretation.
Q 3. Explain the different types of arrhythmias and their ECG characteristics.
Arrhythmias are irregularities in the heart’s rhythm. They can originate in the atria, ventricles, or the conduction pathways between them. ECG characteristics vary widely depending on the type of arrhythmia:
- Sinus Tachycardia: Increased heart rate (>100 bpm); normal P waves, QRS complexes, and intervals.
- Sinus Bradycardia: Decreased heart rate (<60 bpm); normal P waves, QRS complexes, and intervals.
- Atrial Fibrillation (AFib): Irregularly irregular rhythm; absent P waves replaced by fibrillatory waves; QRS complexes usually normal unless other conduction abnormalities are present.
- Atrial Flutter: Regular, rapid atrial rhythm (250-350 bpm); characteristic sawtooth pattern of flutter waves; QRS complexes may be normal or abnormal depending on conduction.
- Ventricular Tachycardia (V-tach): Rapid heart rate (>100 bpm) originating in the ventricles; wide and bizarre QRS complexes; often life-threatening.
- Ventricular Fibrillation (V-fib): Chaotic, disorganized ventricular activity; no recognizable QRS complexes; life-threatening, requires immediate defibrillation.
- Heart Blocks: Various types of blocks disrupt the electrical conduction pathway between atria and ventricles, leading to prolonged PR intervals (first-degree AV block), dropped QRS complexes (second-degree AV block), or complete absence of ventricular activation (third-degree AV block).
Correctly identifying the arrhythmia from the ECG is crucial for appropriate treatment.
Q 4. How do you identify atrial fibrillation on an ECG?
Atrial fibrillation (AFib) is identified on an ECG by the absence of discernible P waves and the presence of irregularly irregular R-R intervals. Instead of regular P waves, there are chaotic fibrillatory waves (f waves) before each QRS complex. The rhythm is described as irregularly irregular because the time between each heartbeat varies unpredictably. This erratic electrical activity leads to an inefficient atrial contraction, affecting ventricular filling and potentially leading to blood clots.
Q 5. How do you identify a myocardial infarction on an ECG?
Identifying a myocardial infarction (MI, or heart attack) on an ECG involves looking for characteristic changes, particularly ST-segment elevation (STEMI) or ST-segment depression (NSTEMI). STEMI is characterized by an elevation of the ST segment of at least 1 mm in at least two contiguous leads. This elevation represents the ongoing myocardial injury and indicates a significant blockage of a coronary artery. NSTEMI shows ST-segment depression or T-wave inversion, often associated with less severe blockage or partial occlusion.
Other ECG findings in MI might include the presence of pathological Q waves (deep Q waves), indicating myocardial necrosis (death of heart muscle). The presence, location and extent of these changes help to pinpoint the affected area of the heart.
Q 6. What are the common causes of ST-segment elevation?
ST-segment elevation is primarily associated with acute myocardial infarction (STEMI), meaning a significant blockage of a coronary artery causing ongoing heart muscle damage. However, other conditions can also cause ST-segment elevation:
- Pericarditis: Inflammation of the sac surrounding the heart (pericardium) can cause diffuse ST-segment elevation.
- Early repolarization: A benign condition that causes ST-segment elevation but lacks other signs of myocardial injury.
- Left ventricular hypertrophy: Enlargement of the left ventricle may sometimes lead to ST-segment changes in certain leads.
- Myocarditis: Inflammation of the heart muscle can cause ST-segment changes resembling MI but with a different clinical picture.
- Benign early repolarization: Often seen in young, healthy athletes with prominent J-points and upwardly sloped ST segments.
It is crucial to differentiate between these conditions based on the complete clinical picture, including symptoms, blood tests, and other imaging studies.
Q 7. Explain the significance of different ST-segment and T-wave changes.
ST-segment and T-wave changes provide valuable information about myocardial ischemia (reduced blood flow to the heart), injury, and infarction.
- ST-segment elevation: Indicates acute myocardial injury (STEMI). The location of the elevation helps pinpoint the affected area of the heart.
- ST-segment depression: Indicates myocardial ischemia (reduced blood flow to the heart). May be seen in unstable angina or NSTEMI.
- T-wave inversion: Often reflects myocardial ischemia or previous myocardial infarction (scarring). May also be seen in electrolyte imbalances or other cardiac conditions.
- Hyperacute T waves: Tall, peaked T waves can be an early sign of myocardial ischemia preceding ST-segment elevation.
Interpretation of these changes requires careful consideration of the overall ECG, patient history, and clinical context. Specific patterns and the presence of other abnormalities, like Q waves, are critical for diagnosis.
Q 8. How do you interpret a prolonged QT interval?
A prolonged QT interval on an electrocardiogram (ECG) refers to a longer than normal time for the ventricles to repolarize after contraction. Think of it like this: the ventricles are the heart’s powerful pumping chambers. Repolarization is the recovery phase after they’ve squeezed. A prolonged QT means this recovery takes too long. This prolongation is measured in milliseconds, and the exact cutoff for ‘prolonged’ depends on the patient’s heart rate and other factors, often guided by specific formulas or nomograms.
The significance lies in its association with an increased risk of a dangerous arrhythmia called torsades de pointes, which can degenerate into ventricular fibrillation (a life-threatening irregular heartbeat). Many factors can cause a prolonged QT, including certain medications (like some antiarrhythmics, antibiotics, and antipsychotics), electrolyte imbalances (particularly low potassium or magnesium), and inherited conditions.
Interpreting a prolonged QT requires careful consideration of the patient’s medical history, current medications, and other ECG findings. It’s not a diagnosis in itself but a significant warning sign that necessitates further investigation and potentially intervention to reduce the risk of potentially fatal arrhythmias.
Q 9. What is the significance of a bundle branch block on an ECG?
A bundle branch block (BBB) on an ECG indicates a delay or blockage in the electrical conduction pathway within the heart’s ventricles. Imagine the heart’s electrical system as a network of wires delivering signals that coordinate the contractions. A BBB means one of these ‘wires’ (the right or left bundle branch) is malfunctioning. This leads to delayed activation of one ventricle relative to the other.
On the ECG, a BBB manifests as widened QRS complexes (the part representing ventricular depolarization). A right bundle branch block (RBBB) typically shows a widened QRS with characteristic RSR’ pattern in the V1 lead. A left bundle branch block (LBBB) presents with a widened QRS complex and characteristic changes in the precordial leads (V leads).
The significance of a BBB is that it indicates potential underlying heart disease. While some BBBS may be benign and asymptomatic, they can indicate structural heart disease, such as coronary artery disease, cardiomyopathy, or previous myocardial infarction (heart attack). Moreover, BBBs can predispose individuals to more serious arrhythmias. The presence of a BBB requires further evaluation to determine the underlying cause.
Q 10. How do you differentiate between supraventricular and ventricular tachycardias?
Differentiating between supraventricular tachycardia (SVT) and ventricular tachycardia (VT) is crucial as their treatments differ significantly. Both involve rapid heart rates, but the origin of the abnormal rhythm is different.
SVT originates above the ventricles (in the atria or atrioventricular node), while VT originates in the ventricles. The key differences on ECG include:
- QRS Complex Width: In SVT, the QRS complexes are typically narrow (less than 0.12 seconds), reflecting normal ventricular activation. In VT, the QRS complexes are usually wide (more than 0.12 seconds) due to abnormal ventricular activation.
- P Waves: In SVT, P waves might be visible but often distorted or buried within the QRS complexes. In VT, P waves are usually absent or dissociated from the QRS complexes (meaning the atria and ventricles beat independently).
- Rate: Both SVT and VT can have very fast heart rates; however, VT rates tend to be higher.
Further analysis, such as looking for specific patterns (e.g., AV dissociation in VT or characteristic SVT rhythms like AV nodal reentrant tachycardia) can be helpful. Sometimes, additional diagnostic tools like electrophysiology studies may be needed for definitive diagnosis.
Example: A patient presenting with a rapid heart rate and wide QRS complexes is more suggestive of VT than SVT. A patient with a rapid heart rate and narrow QRS complexes, potentially with visible P waves, is more likely to have SVT. However, exceptions exist, reinforcing the need for careful ECG interpretation and clinical correlation.
Q 11. Describe the process of ECG artifact identification and correction.
ECG artifact identification and correction are critical steps in accurate ECG interpretation. Artifacts are unwanted signals or noise that obscure the underlying cardiac rhythm. These artifacts can arise from various sources, including patient movement, electrode displacement, muscle tremor, electrical interference (from nearby equipment), and power-line interference.
Identification: Recognizing artifacts requires experience. Common artifacts appear as erratic waves, unusual amplitudes, or repetitive patterns that don’t correlate with the typical ECG waveforms. For example, 60-cycle interference appears as a regular, high-frequency interference pattern superimposed on the ECG. Muscle tremor causes irregular, high-frequency waves, often more prominent in limb leads.
Correction: The most effective correction is prevention! Careful electrode placement, patient education to remain still, minimizing electrical interference, and using appropriate grounding techniques are crucial. If artifacts are present despite these precautions, certain approaches can help. These include:
- Replotting the ECG: Sometimes a simple replotting with better electrode placement and patient cooperation will significantly reduce artifacts.
- Digital filtering: Specialized software can filter out certain frequency components that correspond to specific artifacts.
- Manual correction: In some instances, experienced technicians can manually correct obvious artifacts, however this is often unreliable and should be done with caution.
It’s important to note that aggressive filtering can also remove subtle but important cardiac signals, emphasizing the importance of balance and clinical correlation.
Q 12. What is the role of ECG in diagnosing various cardiac conditions?
The ECG plays a vital role in diagnosing various cardiac conditions. It provides a real-time snapshot of the heart’s electrical activity, which allows clinicians to identify abnormalities in rate, rhythm, and conduction.
Conditions diagnosed using ECG:
- Arrhythmias: ECG is the primary tool for diagnosing many arrhythmias, including atrial fibrillation, ventricular tachycardia, bradycardia, and heart blocks.
- Ischemic heart disease (IHD): ECG changes such as ST-segment elevation or depression, T-wave inversions, and Q waves can indicate myocardial ischemia (reduced blood flow) or infarction (heart attack).
- Hypertrophy: ECG helps to assess ventricular or atrial hypertrophy (enlargement) by looking at voltage changes and QRS complex morphology.
- Electrolyte imbalances: Changes in the ECG waveform pattern can suggest abnormalities in potassium, magnesium, or calcium levels.
- Congenital heart defects: Certain ECG patterns may be associated with congenital anomalies.
While the ECG provides valuable information, it’s crucial to remember that it’s often only one piece of the diagnostic puzzle. Clinical presentation, physical exam, and other tests (like echocardiograms and cardiac enzymes) are necessary to formulate a complete diagnosis.
Q 13. Explain the differences between a 12-lead ECG and a rhythm strip.
A 12-lead ECG and a rhythm strip both provide information about the heart’s electrical activity, but they differ significantly in their scope and purpose.
12-lead ECG: This is the standard ECG used for comprehensive cardiac evaluation. It uses 12 different lead placements on the chest and limbs to provide a multi-angled view of the heart’s electrical activity. This allows for assessment of the heart’s rhythm, conduction, and the presence of ischemia or infarction across various parts of the myocardium (heart muscle). Imagine it as a detailed map of the heart’s electrical activity.
Rhythm strip: A rhythm strip is a continuous recording of one or two leads from the ECG, typically showing a longer duration of the rhythm. It’s essentially a zoomed-in view of a single lead, focused primarily on assessing heart rate and rhythm. It’s particularly useful for detecting subtle variations in heart rate or rhythm abnormalities that might not be immediately apparent in a standard 12-lead ECG.
In essence, the 12-lead ECG provides a comprehensive spatial view, while the rhythm strip provides a detailed temporal view of the cardiac rhythm.
Q 14. What are the limitations of ECG in diagnosing cardiac problems?
While an ECG is a valuable diagnostic tool, it has limitations. It’s crucial to be aware of these limitations when interpreting the results.
Limitations:
- Normal ECG does not rule out disease: A normal ECG doesn’t exclude the possibility of significant cardiac disease. Many conditions, such as early-stage coronary artery disease or some cardiomyopathies, may not manifest characteristic changes on ECG.
- Sensitivity and Specificity: ECG findings may not be sufficiently sensitive or specific for certain conditions. For example, ST-segment changes can be subtle or nonspecific, requiring correlation with clinical information and other diagnostic tests.
- Interference and Artifacts: Artifacts can significantly affect the accuracy of ECG interpretation, making it difficult to identify the underlying cardiac rhythm or abnormalities.
- Limited Information: ECG primarily shows the electrical activity; it doesn’t directly assess other aspects of cardiac function, such as myocardial contractility (how effectively the heart pumps) or valvular function.
- Operator Dependence: The accuracy of ECG interpretation depends on the experience and expertise of the person reading the tracing.
Therefore, ECG interpretation should always be done in conjunction with the patient’s clinical history, physical exam, and other appropriate investigations to provide a comprehensive diagnosis.
Q 15. Describe your experience with ECG equipment and software.
My experience with ECG equipment and software spans over ten years, encompassing various models from leading manufacturers like GE, Philips, and Schiller. I’m proficient in operating both standard 12-lead ECG machines and advanced systems with functionalities like arrhythmia analysis and interpretation software. This includes experience with both standalone devices and those integrated into larger Electronic Health Record (EHR) systems. I’m familiar with the intricacies of lead placement, artifact identification and mitigation, and the nuances of different software interfaces for data review and reporting. For example, I’ve extensively utilized GE MAC 5500 and Philips IntelliVue systems, gaining experience with their specific operational procedures and data analysis capabilities. Furthermore, my experience extends to utilizing interpretation software such as those found within EHR systems, which allows for automated analysis and reporting of ECG findings to assist clinicians in making faster and more informed diagnoses.
Career Expert Tips:
- Ace those interviews! Prepare effectively by reviewing the Top 50 Most Common Interview Questions on ResumeGemini.
- Navigate your job search with confidence! Explore a wide range of Career Tips on ResumeGemini. Learn about common challenges and recommendations to overcome them.
- Craft the perfect resume! Master the Art of Resume Writing with ResumeGemini’s guide. Showcase your unique qualifications and achievements effectively.
- Don’t miss out on holiday savings! Build your dream resume with ResumeGemini’s ATS optimized templates.
Q 16. How do you ensure patient safety during ECG procedures?
Patient safety is paramount during ECG procedures. This starts with proper hand hygiene and the use of clean electrodes and cables. I always verify patient identity using two identifiers before proceeding. Explaining the procedure clearly and reassuringly to the patient is crucial, especially for those who might be anxious. For patients with compromised skin integrity or those receiving oxygen therapy, I adjust my techniques accordingly to prevent skin irritation or accidental disconnection of oxygen lines. I consistently monitor the patient’s vital signs during the procedure and immediately address any adverse reactions. The proper grounding of the ECG machine is essential to reduce the risk of electrical shock. For example, if a patient experiences discomfort or displays signs of distress, I immediately stop the procedure and inform the attending physician. This proactive approach, combined with adherence to infection control protocols, ensures a safe and efficient ECG procedure.
Q 17. How do you handle challenging or difficult ECG interpretations?
Challenging ECG interpretations often involve artifacts, poor signal quality, or unusual rhythms. My approach involves a systematic process: First, I meticulously review the ECG tracing for artifacts such as muscle tremor, wandering baseline, or 60 Hz interference. I then carefully analyze the rhythm, noting the rate, regularity, and morphology of the P waves, QRS complexes, and T waves. If the initial interpretation is inconclusive, I utilize advanced features in the ECG software, such as measurement tools and rhythm analysis algorithms. Finally, if uncertainties remain, I consult ECG interpretation guidelines and relevant medical literature, often seeking consultation with a cardiologist or experienced ECG technician. For instance, a poorly defined QRS complex could indicate a bundle branch block, but it’s crucial to rule out other possibilities. I document all findings and uncertainties clearly in the report, allowing the physician to make an informed decision.
Q 18. What is your understanding of Holter monitoring and event recorders?
Holter monitoring and event recorders are ambulatory ECG systems that provide continuous or event-triggered ECG recordings. A Holter monitor records a continuous ECG for 24-48 hours, allowing for detection of intermittent arrhythmias. Event recorders, on the other hand, record ECG data only when triggered by the patient (using a button) or when certain arrhythmias are detected automatically. They are useful for detecting infrequent or paroxysmal events. My understanding encompasses the proper application and interpretation of data from both systems, including artifact identification and differentiation between various arrhythmias. For example, I understand that the interpretation of a Holter monitor necessitates careful review of the entire recording to detect subtle changes in rhythm or ST-segment alterations. In contrast, the interpretation of an event recorder focuses on the specific events recorded during activation. Understanding the limitations of each system is key to accurate diagnosis.
Q 19. How do you communicate ECG findings to physicians and other healthcare professionals?
Communicating ECG findings requires clear, concise, and accurate reporting. I utilize a standardized format that includes patient demographics, date and time of the ECG, lead configuration, rhythm analysis, and any significant abnormalities (e.g., ST-segment changes, arrhythmias, conduction delays). I avoid medical jargon when communicating with non-medical personnel, explaining findings in plain language. For physicians, I provide a detailed report that includes measurements, interpretations, and potential differential diagnoses. I ensure that all reports are readily accessible within the EHR system. For example, if I find evidence of ST-segment elevation, I clearly state this and highlight its potential implications for a possible myocardial infarction, emphasizing the urgency for immediate medical attention. Effective communication ensures timely intervention and appropriate patient care.
Q 20. Explain your knowledge of different ECG paper speeds and sensitivities.
ECG paper speed and sensitivity affect the appearance of the ECG tracing. Standard paper speed is 25 mm/sec, meaning that 1 second of ECG data is represented by 25 mm of paper. A faster speed (e.g., 50 mm/sec) is sometimes used to analyze rapid rhythms more clearly. Sensitivity refers to the amplitude of the waveform; standard sensitivity is 10 mm/mV. A higher sensitivity (e.g., 20 mm/mV) amplifies the signal, making small changes easier to see. For example, a faster paper speed is beneficial for analysing rapid atrial fibrillation, whereas a higher sensitivity might be used to assess subtle ST-segment changes. Understanding how these settings influence the ECG tracing is crucial for accurate interpretation.
Q 21. How do you troubleshoot common ECG machine problems?
Troubleshooting ECG machine problems often involves a systematic approach. I first check for obvious issues like power supply, lead wire connections, and electrode placement. I then assess the ECG tracing for artifacts, such as muscle tremor or 60 Hz interference, which may indicate poor lead placement or electrical interference. If problems persist, I check the machine’s internal settings and calibration. If needed, I consult the machine’s manual or contact technical support. For example, a wandering baseline might be resolved by ensuring good electrode contact or improving patient positioning; while a completely flatline could suggest a malfunctioning machine or disconnected leads. Documenting all troubleshooting steps is crucial for maintaining equipment records and ensuring quality control.
Q 22. What are some examples of ECG artifacts and how are they caused?
ECG artifacts are disturbances on an electrocardiogram that are not related to the heart’s electrical activity. They can obscure the true underlying rhythm and lead to misdiagnosis. Think of them as noise interfering with the clean signal of the heart’s electrical impulses.
- Wandering Baseline: This artifact is a gradual upward or downward drift of the baseline, often caused by poor electrode contact, patient movement, or a wet or dirty electrode. Imagine the tracing slowly meandering away from the center line.
- Muscle Tremor: This shows up as high-frequency, small-amplitude oscillations, often caused by the patient shivering, moving, or having a muscle condition. It’s like a small, rapid vibration on the ECG tracing.
- AC Interference: This appears as regularly spaced, high-frequency waves, usually caused by electrical interference from nearby equipment like computers or monitors. It looks like a series of small, evenly spaced teeth on the tracing.
- Electrode-related artifacts: These are a broad category including things like poorly applied electrodes leading to erratic signals, or movement of the electrode wires causing breaks in the signal.
- Somatic Interference: This is caused by muscle movement of the patient, often during an ECG. It can result in irregular lines and spikes.
Identifying and mitigating these artifacts requires careful electrode placement, ensuring good skin preparation, and minimizing patient movement during recording. In many cases, re-recording the ECG after addressing these issues is necessary for an accurate interpretation.
Q 23. Describe your experience working in a fast-paced healthcare environment.
In my previous role at a busy tertiary care hospital, I regularly worked in a high-pressure environment dealing with a rapid influx of patients needing urgent ECG interpretation. This demanded a calm and efficient approach to prioritization. I became adept at quickly assessing ECGs to identify life-threatening rhythms such as ventricular fibrillation or tachycardia, while simultaneously managing multiple tasks including charting, communicating with the attending physicians, and coordinating patient care with the nursing staff. Multitasking and clear communication were paramount in ensuring prompt and effective treatment for patients suffering from acute cardiac events.
For example, during one particularly hectic shift, we had several simultaneous emergencies including a patient experiencing chest pain and another presenting with a suspected arrhythmia. I swiftly performed the ECGs, accurately interpreted the critical results within minutes, and communicated the findings to the attending physician. The team’s coordinated efforts led to the timely interventions, preventing further complications.
Q 24. How do you stay updated with the latest advancements in ECG technology?
Staying current in the dynamic field of ECG technology requires a multi-pronged approach. I actively participate in continuing medical education (CME) courses and workshops focused on advancements in ECG interpretation and technology. I regularly attend conferences and webinars presented by leading cardiologists and experts in the field. I also subscribe to several peer-reviewed journals, including the Journal of the American College of Cardiology and the Heart Rhythm, which publish cutting-edge research and clinical updates. Additionally, I actively engage in online communities and forums where professionals share their experiences and knowledge. This ongoing engagement keeps me at the forefront of the latest developments in ECG techniques and algorithm improvements within automated ECG interpretation software.
Q 25. What is your approach to continuous learning in cardiology?
My approach to continuous learning in cardiology is rooted in a combination of formal education and self-directed learning. I actively pursue formal CME courses and workshops related to ECG interpretation, arrhythmia management, and the latest advancements in cardiac diagnostics. Additionally, I am always looking for opportunities to expand my practical experience by taking on challenging cases and seeking mentorship from senior cardiologists. This includes regular review of difficult ECGs and engaging in discussions of different interpretations and management plans. This method fosters a culture of continuous improvement and enhances my ability to provide high-quality care.
Q 26. Explain your knowledge of basic cardiac anatomy and physiology.
Understanding basic cardiac anatomy and physiology is fundamental to accurate ECG interpretation. The heart is a four-chambered pump composed of the right and left atria and ventricles. The sinoatrial (SA) node, the heart’s natural pacemaker, initiates the electrical impulse that causes the heart to contract. This impulse spreads through the atria, the atrioventricular (AV) node, the bundle of His, bundle branches, and Purkinje fibers, causing coordinated contraction of the ventricles. The ECG reflects the electrical activity generated by this conduction system.
Understanding the relationship between the electrical activity and the mechanical function of the heart is critical. For instance, the P wave represents atrial depolarization, the QRS complex ventricular depolarization, and the T wave ventricular repolarization. Delays or abnormalities in these waves often reflect underlying structural or functional heart issues. A firm grasp of the normal ECG tracing and the deviations indicative of pathology is essential for accurate diagnosis and patient management.
Q 27. Describe a situation where you had to make a quick decision based on an ECG reading.
One day, I received an ECG from a patient experiencing sudden onset of chest pain and shortness of breath. The ECG showed a wide complex tachycardia with features suggestive of ventricular tachycardia (VT). VT can lead to cardiac arrest if not promptly treated. Based on my assessment of the rhythm, I immediately notified the attending physician and the critical care team. The patient was quickly transferred to the cardiac catheterization laboratory for urgent intervention. This quick response, stemming from the immediate recognition of the life-threatening rhythm in the ECG, likely saved the patient’s life. The rapid recognition and response were crucial in averting a potentially fatal outcome.
Q 28. How do you prioritize tasks and manage your time effectively in a busy cardiac unit?
In a busy cardiac unit, effective task prioritization and time management are crucial. My approach involves a combination of strategies. First, I utilize a system for triaging ECGs based on urgency. Life-threatening rhythms (like VT or VF) are prioritized immediately. Second, I utilize workflow optimization techniques to maximize efficiency. This involves streamlining my workflow, delegating tasks appropriately, and using technology to aid in reporting and analysis. Finally, I practice mindful time management, concentrating my efforts on high-impact activities. Clear communication with the team is vital – ensuring everyone understands priorities and roles. This allows for efficient response and effective use of the entire team’s expertise. This coordinated approach enables me to manage my time effectively in high-pressure situations and provide high-quality care to all patients.
Key Topics to Learn for Electrocardiogram (ECG) Interview
- Cardiac Conduction System: Understand the pathway of electrical impulses through the heart, including the sinoatrial (SA) node, atrioventricular (AV) node, bundle of His, and Purkinje fibers. Consider the physiological implications of abnormalities in each area.
- ECG Waveforms and Intervals: Master the interpretation of P waves, QRS complexes, T waves, and intervals like PR interval, QRS duration, and QT interval. Practice identifying normal variations and common abnormalities.
- Arrhythmia Recognition: Develop proficiency in recognizing various arrhythmias, including sinus rhythm variations, atrial fibrillation, atrial flutter, ventricular tachycardia, and heart blocks. Learn to differentiate these conditions based on ECG characteristics.
- Ischemia and Infarction: Understand the ECG changes associated with myocardial ischemia and infarction, including ST segment elevation, ST segment depression, T wave inversions, and Q waves. Practice differentiating STEMI from NSTEMI.
- Electrolyte Imbalances: Learn how electrolyte imbalances (e.g., potassium, calcium, magnesium) affect the ECG tracing and how to identify these patterns.
- ECG Artifact Recognition: Become familiar with common artifacts that can interfere with ECG interpretation and how to differentiate them from actual cardiac events.
- Practical Application: Think through scenarios where you would use ECG interpretation in clinical practice, such as in emergency situations, patient monitoring, and diagnostic testing. Consider the clinical decision-making process based on ECG findings.
- Advanced ECG Concepts (for Senior Roles): Depending on your target role, prepare to discuss topics such as vectorcardiography, advanced arrhythmia analysis, and the interpretation of stress tests or other cardiac diagnostic tools.
Next Steps
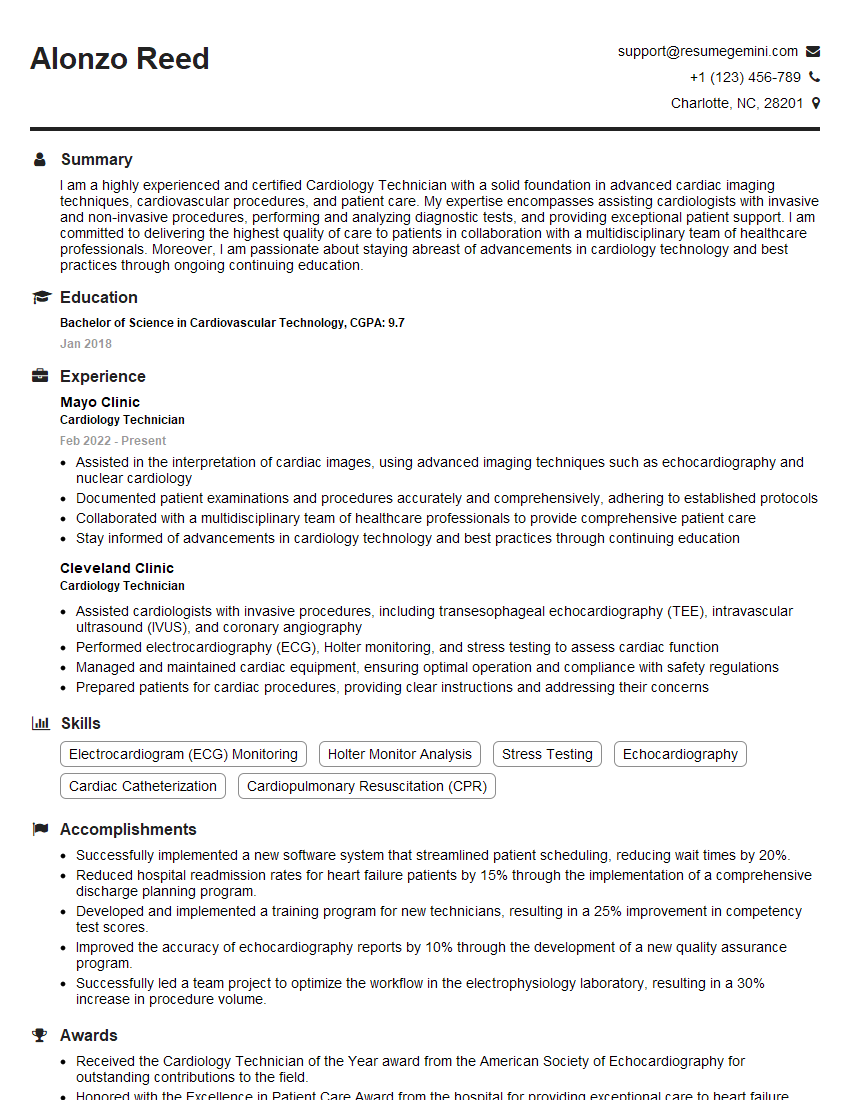
Mastering Electrocardiogram (ECG) interpretation is crucial for career advancement in many healthcare fields. A strong understanding of ECGs significantly enhances your diagnostic skills and clinical decision-making abilities, making you a highly valuable asset to any healthcare team. To maximize your job prospects, create a resume that effectively showcases your ECG expertise to Applicant Tracking Systems (ATS). ResumeGemini is a trusted resource for building professional, ATS-friendly resumes. They offer examples of resumes tailored to Electrocardiogram (ECG) roles – use their tools to create a winning application and make your skills shine!



Explore more articles
Users Rating of Our Blogs
Share Your Experience
We value your feedback! Please rate our content and share your thoughts (optional).
What Readers Say About Our Blog
To the interviewgemini.com Webmaster.
Very helpful and content specific questions to help prepare me for my interview!
Thank you
To the interviewgemini.com Webmaster.
This was kind of a unique content I found around the specialized skills. Very helpful questions and good detailed answers.
Very Helpful blog, thank you Interviewgemini team.