Interviews are more than just a Q&A session—they’re a chance to prove your worth. This blog dives into essential Outcome Measurement and Data Analysis interview questions and expert tips to help you align your answers with what hiring managers are looking for. Start preparing to shine!
Questions Asked in Outcome Measurement and Data Analysis Interview
Q 1. Explain the difference between descriptive, predictive, and prescriptive analytics.
The three types of analytics—descriptive, predictive, and prescriptive—represent a progression in data analysis sophistication. Think of them as steps in a problem-solving journey.
- Descriptive Analytics: This is all about summarizing what *has* happened. It uses past data to understand trends, patterns, and key performance indicators (KPIs). Imagine reviewing sales figures for the last quarter – you’re describing the past performance. Tools include summary statistics (mean, median, mode), charts, and dashboards.
- Predictive Analytics: This goes a step further and tries to predict what *will* happen. It uses historical data, statistical algorithms, and machine learning techniques to forecast future outcomes. For example, using past customer behavior to predict the likelihood of a customer churning or predicting future sales based on seasonality and marketing campaigns. Techniques include regression analysis, time series modeling, and classification algorithms.
- Prescriptive Analytics: This is the highest level, focusing on recommending actions to optimize outcomes. It uses predictive models and optimization techniques to suggest the best course of action. A great example is dynamic pricing, where algorithms suggest optimal prices based on demand forecasts and competitor actions. Linear programming and simulation are commonly used techniques.
In essence, descriptive analytics tells you *what* happened, predictive analytics tells you *what might happen*, and prescriptive analytics tells you *what to do*.
Q 2. Describe your experience with A/B testing and its application in outcome measurement.
A/B testing, also known as split testing, is a crucial method for measuring the effectiveness of different versions of a webpage, marketing email, or other marketing element. I’ve extensively used A/B testing in various outcome measurement projects, particularly in digital marketing and user experience optimization.
My approach typically involves:
- Defining a clear objective: What are we trying to improve? Conversion rate? Click-through rate? Time on site?
- Creating variations: Designing different versions (A and B) of the element to be tested, varying only one aspect at a time to isolate the impact of each change.
- Implementing the test: Randomly assigning users to either version A or B and collecting data on their behavior.
- Analyzing results: Using statistical tests (like chi-squared or t-tests) to determine if there’s a statistically significant difference in the performance of the two versions. This ensures the observed difference isn’t simply due to random chance.
- Iterating and optimizing: Based on the results, either implement the winning version or continue testing new variations to further optimize performance.
For example, in a recent project, we A/B tested two different email subject lines. Version A had a higher open rate, enabling us to conclude that subject line A was more effective. This type of controlled experiment allows for data-driven decision-making and continuous improvement.
Q 3. How do you handle missing data in a dataset?
Missing data is a common challenge in any dataset. The best approach depends on the nature and extent of the missing data, and the context of the study. Ignoring it is almost never the right answer.
- Understanding the mechanism of missing data: Is it Missing Completely at Random (MCAR), Missing at Random (MAR), or Missing Not at Random (MNAR)? This dictates the appropriate handling strategy. MCAR means the missingness is unrelated to any other variables, MAR means it’s related to observed variables, and MNAR is the most challenging case, where the missingness is related to the unobserved values themselves.
- Imputation methods: For MCAR and MAR, techniques like mean/median imputation, k-nearest neighbor imputation, or multiple imputation can be used to replace missing values with plausible estimates. Multiple imputation is particularly robust as it creates multiple plausible datasets and combines the results.
- Deletion methods: If the missing data is minimal and randomly distributed, listwise deletion (removing entire rows with missing data) can be considered, but this reduces the sample size and can introduce bias if the missingness isn’t MCAR.
- Model-based approaches: In more complex cases, especially with MNAR data, more sophisticated techniques like maximum likelihood estimation or Bayesian methods may be necessary.
The choice of method requires careful consideration. Always document the chosen method and justify the decision. It is important to assess the impact of the chosen method on the analysis results.
Q 4. What statistical methods are you familiar with, and when would you use each?
I’m proficient in a variety of statistical methods, tailored to the specific research question and dataset. Here are a few examples:
- Descriptive Statistics: Mean, median, mode, standard deviation, variance, percentiles. Used to summarize and describe data. Example: Calculating the average customer satisfaction score.
- Regression Analysis: Linear, logistic, multiple regression. Used to model relationships between variables and make predictions. Example: Predicting sales based on advertising spend and seasonality.
- Hypothesis Testing: t-tests, ANOVA, chi-square tests. Used to test hypotheses about population parameters. Example: Testing if there is a significant difference in conversion rates between two website designs.
- Time Series Analysis: ARIMA, exponential smoothing. Used to analyze data collected over time. Example: Forecasting stock prices or sales trends.
- Clustering: K-means, hierarchical clustering. Used to group similar data points together. Example: Segmenting customers based on their purchasing behavior.
The selection of appropriate statistical methods depends heavily on the type of data (categorical, continuous), the research question, and the assumptions that can be reasonably made about the data.
Q 5. How would you measure the success of a marketing campaign?
Measuring the success of a marketing campaign depends heavily on its objectives. However, a multi-faceted approach is usually best.
- Defining Key Performance Indicators (KPIs): Before the campaign starts, we need to define what success looks like. This might include:
- Website traffic: Increase in unique visitors, page views, bounce rate.
- Lead generation: Number of leads generated, lead conversion rate.
- Sales: Increase in revenue, number of transactions, average order value.
- Brand awareness: Social media engagement, website mentions, changes in brand perception.
- Customer acquisition cost (CAC): The cost of acquiring a new customer.
- Tracking and monitoring: Implementing appropriate tracking mechanisms throughout the campaign to monitor performance against KPIs in real-time. This may involve Google Analytics, CRM systems, or other marketing automation tools.
- Analyzing data and attribution: After the campaign concludes, carefully analyze the data to assess the performance of different channels, and attribute the outcomes to specific marketing activities. This might involve using multi-touch attribution models.
- Return on Investment (ROI): Calculating the ROI of the campaign to determine the financial return compared to the investment.
It’s also crucial to compare the campaign’s results against a control group or previous campaigns to ensure that improvements are truly attributable to the marketing activities and not external factors.
Q 6. Explain the concept of statistical significance and its importance in outcome measurement.
Statistical significance indicates whether the observed results of a study are likely due to a real effect or simply random chance. It’s crucial in outcome measurement because it helps us avoid drawing false conclusions.
Here’s how it works:
We use statistical tests (like t-tests, ANOVA, chi-square tests) to calculate a p-value. The p-value represents the probability of obtaining the observed results (or more extreme results) if there were actually no real effect. A commonly used threshold is p < 0.05. This means that if the p-value is less than 0.05, we reject the null hypothesis (the hypothesis that there's no effect) and conclude that the results are statistically significant—meaning the observed effect is unlikely due to random chance.
Importance in outcome measurement:
Statistical significance ensures that the observed improvements or differences in outcomes are not just random fluctuations. It provides confidence that the measured impact is real and not a result of coincidence. For instance, if a new treatment shows improved patient outcomes, statistical significance helps confirm that the improvement is due to the treatment, not random variation in patient health.
However, it’s important to note that statistical significance doesn’t automatically imply practical significance. A statistically significant effect might be too small to be of practical value. Therefore, it is critical to consider both statistical and practical significance when interpreting results.
Q 7. How do you identify and handle outliers in your data?
Outliers are data points that significantly deviate from the rest of the data. Identifying and handling them appropriately is vital for accurate analysis.
Identification:
- Visual inspection: Box plots, scatter plots, and histograms can visually reveal outliers.
- Statistical methods: Z-scores or IQR (interquartile range) method can quantify how far a data point deviates from the mean or median. Data points with z-scores greater than 3 or less than -3 (or outside 1.5 times the IQR) are often considered outliers.
Handling:
The approach to handling outliers depends on the context and the cause of the outlier:
- Investigation: First, investigate the cause. Is it a genuine error (data entry mistake)? Is it a legitimate extreme value? If it’s an error, correct it or remove the data point.
- Transformation: Transforming the data (e.g., using a logarithmic transformation) can sometimes reduce the influence of outliers.
- Robust methods: Use statistical methods that are less sensitive to outliers, such as median instead of mean, or robust regression techniques.
- Winsorizing/Trimming: Replacing extreme values with less extreme values (Winsorizing) or removing the extreme values altogether (Trimming) are other options, but should be used cautiously and documented thoroughly.
The key is to document the rationale for how outliers are handled and to consider the impact of outlier removal or transformation on the overall conclusions.
Q 8. What are the key performance indicators (KPIs) you would track for a specific business problem?
Choosing the right Key Performance Indicators (KPIs) is crucial for effectively addressing a business problem. It depends heavily on the specific problem, but generally, we need a balanced scorecard approach, looking at metrics across different perspectives: financial, customer, internal processes, and learning & growth. Let’s say the business problem is declining customer retention. We wouldn’t just look at one metric. Instead, we’d track a combination of KPIs to understand the root cause.
- Financial KPIs: Customer Lifetime Value (CLTV), churn rate, revenue per customer, and return on investment (ROI) of customer retention initiatives.
- Customer KPIs: Customer satisfaction (CSAT) scores, Net Promoter Score (NPS), customer effort score (CES), and number of support tickets.
- Internal Process KPIs: Average resolution time for customer issues, employee satisfaction related to customer service, and time spent onboarding new customers.
- Learning & Growth KPIs: Number of employees trained in customer service, adoption rate of new customer relationship management (CRM) software, and feedback collected from customer surveys.
By tracking these varied KPIs, we create a holistic picture. A drop in CLTV, for example, might be correlated with low CSAT scores, pointing towards a service quality issue. Analyzing these interconnected KPIs allows for a data-driven approach to problem-solving, avoiding assumptions and focusing on the actual drivers of customer churn.
Q 9. Describe your experience with data visualization tools and techniques.
Data visualization is fundamental to my work. I’m proficient in tools like Tableau, Power BI, and Python libraries such as Matplotlib and Seaborn. My experience extends beyond simply creating charts; it involves strategically selecting the right visualization for the data and the audience. For instance, a bar chart is excellent for comparing categories, while a line chart shows trends over time. Scatter plots reveal correlations, and heatmaps expose patterns in large datasets.
I’ve used these tools in various scenarios. In one project, we used Tableau to create interactive dashboards that allowed executives to explore sales data across different regions and product lines. The interactive nature facilitated deeper insights and informed strategic decision-making. In another, I used Python’s Seaborn to create visually appealing statistical plots that helped to identify outliers and patterns in customer behavior data.
Beyond the technical skills, I focus on principles of clear communication. The goal is never to impress with complex charts but to communicate insights clearly and concisely. This means choosing appropriate colors, labeling axes correctly, and providing clear titles and annotations.
Q 10. How do you ensure the accuracy and reliability of your data analysis?
Data accuracy and reliability are paramount. My approach involves several key steps:
- Data validation: I meticulously check data for inconsistencies, outliers, and missing values. This might involve using statistical methods like Z-scores to identify unusual data points or using data profiling tools to understand data distributions.
- Data cleaning: I address issues identified in validation. This could involve imputation techniques (e.g., replacing missing values with the mean or median) or removal of outliers if justified. The method is always documented and chosen based on the context.
- Source verification: I ensure the credibility of the data sources. Understanding data collection methods and potential biases is critical. This often includes discussions with the data owners to understand data quality.
- Cross-validation: Wherever possible, I cross-reference data from multiple sources to confirm accuracy and consistency. This provides an independent check and helps to reduce the risk of errors.
- Documentation: I meticulously document all data cleaning and validation steps to ensure transparency and reproducibility.
Imagine analyzing website traffic data. A spike in traffic from one particular IP address might indicate a bot attack or an error. Ignoring it would lead to flawed conclusions. Careful validation and cleaning ensure robust and reliable analysis.
Q 11. Explain the process of formulating a hypothesis and testing it using data.
Formulating and testing hypotheses is a cornerstone of data-driven decision-making. It’s an iterative process:
- Define the problem: Clearly state the business problem you’re trying to solve. For example, ‘Why are online sales declining?’
- Formulate a hypothesis: Develop a testable statement that proposes a potential solution. For instance, ‘Declining online sales are due to a poor website user experience.’
- Gather data: Collect relevant data to test the hypothesis. This might involve analyzing website analytics, conducting user surveys, or gathering A/B testing results.
- Choose a statistical test: Select the appropriate statistical test based on your data type and hypothesis (e.g., t-test, chi-squared test, ANOVA).
- Analyze the data: Perform the statistical test and assess the results. Determine if the p-value is below your significance level (usually 0.05), indicating statistical significance.
- Interpret the results: Based on the analysis, either accept or reject your hypothesis. If rejected, refine your hypothesis and repeat the process. If accepted, consider implications and further investigation.
For the website example, if the A/B test shows significantly higher conversion rates with a redesigned website, we’d accept the hypothesis. However, it is important to note that correlation doesn’t equal causation. We might need further investigation to fully understand the factors contributing to the sales decline.
Q 12. How do you communicate complex data analysis findings to a non-technical audience?
Communicating complex data analysis findings to a non-technical audience requires a shift in approach. Jargon should be avoided, and visualizations are key. I use several strategies:
- Focus on the story: Frame the analysis around a clear narrative, highlighting the key findings and their implications. Start with the ‘so what?’ and avoid overwhelming the audience with details.
- Use clear and simple language: Avoid technical terms unless absolutely necessary, and if used, clearly define them. Think analogies and relatable examples.
- Visualizations are paramount: Use charts, graphs, and infographics to convey information visually. Keep them simple and easy to understand. A well-designed visualization can communicate complex concepts instantly.
- Focus on actionable insights: Emphasize the practical applications of the findings. What actions should be taken based on the analysis? This helps the audience connect the data to real-world consequences.
- Interactive elements: Consider using interactive dashboards or presentations to allow the audience to explore the data at their own pace.
For example, instead of saying ‘the p-value was 0.03, indicating statistical significance,’ I might say ‘our analysis showed a strong link between the new marketing campaign and a significant increase in sales.’ The focus is on the practical implications, not the statistical methods.
Q 13. What is your experience with SQL and other data manipulation languages?
I’m highly proficient in SQL and have extensive experience using it for data manipulation and analysis. I’ve used it to extract, transform, and load (ETL) data from various sources, including relational databases and flat files. I’m comfortable writing complex queries involving joins, subqueries, aggregations, and window functions.
SELECT COUNT(*) FROM customers WHERE country = 'USA'; This is a simple example, but my experience extends to significantly more complex queries. I’ve utilized stored procedures, views, and functions to streamline data access and enhance efficiency.
Beyond SQL, I have experience with other data manipulation languages such as Python’s Pandas library, which provides powerful tools for data cleaning, manipulation, and analysis within a scripting environment. This allows for more complex data transformations and the integration of data from various sources that might not be accessible through SQL alone.
Q 14. Describe your experience with data mining and machine learning techniques.
My experience with data mining and machine learning techniques is extensive. I’ve applied various algorithms to solve business problems across various domains.
In one project, we used clustering algorithms (like K-means) to segment customers based on their purchasing behavior. This allowed the marketing team to target specific customer groups with tailored campaigns, improving the effectiveness of their marketing efforts. In another project, we used predictive modeling techniques (like logistic regression or random forests) to predict customer churn. This allowed us to proactively identify at-risk customers and take steps to retain them, significantly reducing churn rates.
I’m familiar with various techniques including regression analysis, classification algorithms (e.g., decision trees, support vector machines, naive Bayes), clustering algorithms, and dimensionality reduction techniques (e.g., PCA). My experience extends to both supervised and unsupervised learning, and I’m adept at selecting the appropriate technique based on the problem and the characteristics of the data. Furthermore, I have experience with model evaluation metrics and techniques for ensuring model robustness and preventing overfitting.
Q 15. What is regression analysis, and when would you use it?
Regression analysis is a powerful statistical method used to model the relationship between a dependent variable and one or more independent variables. Think of it like this: you’re trying to figure out how much ice cream sales (dependent variable) are affected by temperature (independent variable). We use regression to find the best-fitting line that describes this relationship, allowing us to predict ice cream sales based on the temperature.
There are different types of regression, such as linear regression (when the relationship is a straight line), multiple linear regression (when there are multiple independent variables), and logistic regression (when the dependent variable is categorical, like whether someone will buy ice cream or not).
I’d use regression analysis when I need to:
- Predict a continuous outcome based on one or more predictor variables.
- Understand the strength and direction of the relationship between variables.
- Control for confounding variables – for instance, in the ice cream example, we might also consider the day of the week as a variable to see if it also impacts sales.
For example, in a public health study, I might use regression to predict the likelihood of a patient developing a certain disease based on their age, lifestyle factors, and family history. In marketing, regression could help predict customer churn based on factors like usage frequency and customer satisfaction scores.
Career Expert Tips:
- Ace those interviews! Prepare effectively by reviewing the Top 50 Most Common Interview Questions on ResumeGemini.
- Navigate your job search with confidence! Explore a wide range of Career Tips on ResumeGemini. Learn about common challenges and recommendations to overcome them.
- Craft the perfect resume! Master the Art of Resume Writing with ResumeGemini’s guide. Showcase your unique qualifications and achievements effectively.
- Don’t miss out on holiday savings! Build your dream resume with ResumeGemini’s ATS optimized templates.
Q 16. How do you choose the appropriate statistical test for a given research question?
Choosing the right statistical test is crucial for drawing valid conclusions. It depends entirely on your research question, the type of data you have (categorical, continuous, etc.), and the number of groups you are comparing. There’s no one-size-fits-all answer, but here’s a framework I use:
- Identify the type of data: Is your data nominal (categories, like colors), ordinal (ordered categories, like education level), interval (equal intervals between values, like temperature), or ratio (has a true zero point, like height)?
- Determine the number of groups: Are you comparing two groups, more than two groups, or is it a correlation study?
- State the research question: Are you testing for differences between groups, examining relationships between variables, or predicting an outcome?
For example:
- Comparing means of two groups: Independent samples t-test (if the groups are independent) or paired samples t-test (if the data is paired).
- Comparing means of more than two groups: ANOVA (Analysis of Variance).
- Examining the relationship between two continuous variables: Pearson correlation.
- Examining the relationship between a categorical and a continuous variable: t-test or ANOVA.
I often consult statistical resources and textbooks to ensure I select the most appropriate test for the specific situation. Incorrect test selection can lead to inaccurate or misleading results.
Q 17. What is your experience with different types of sampling techniques?
Sampling techniques are essential for drawing inferences about a population from a smaller sample. My experience encompasses various methods, each with its strengths and limitations:
- Simple Random Sampling: Every member of the population has an equal chance of being selected. It’s straightforward but may not represent subgroups well.
- Stratified Sampling: The population is divided into strata (subgroups), and a random sample is taken from each stratum. Ensures representation from all subgroups.
- Cluster Sampling: The population is divided into clusters (e.g., geographic areas), and a random sample of clusters is selected. Cost-effective but may have higher sampling error.
- Convenience Sampling: Selecting readily available individuals. Easy but highly susceptible to bias.
- Quota Sampling: Similar to stratified sampling, but non-random selection within strata. Can be quicker but introduces bias.
The choice of sampling technique depends on the research question, resources, and the desired level of accuracy. For example, in a nationwide survey, stratified sampling might be preferred to ensure representation from different regions and demographics. In a pilot study with limited resources, convenience sampling might be used initially.
Q 18. How do you validate the results of your data analysis?
Validating data analysis results is critical to ensure the findings are reliable and trustworthy. My approach involves several steps:
- Cross-validation: Splitting the data into training and testing sets to evaluate the model’s performance on unseen data. This helps to avoid overfitting, where the model performs well on the training data but poorly on new data.
- Sensitivity analysis: Examining how changes in the input data or model assumptions affect the results. It helps to identify potential weaknesses and uncertainties in the findings.
- Peer review: Sharing the analysis with other experts in the field for critical evaluation and feedback. This ensures objectivity and identifies potential flaws or biases.
- Reproducibility checks: Ensuring that the analysis can be replicated by others using the same data and methods. This enhances transparency and builds trust in the findings.
- Assessing model fit statistics: Using appropriate metrics (R-squared, AIC, BIC etc., depending on the type of analysis) to determine how well the model fits the data and avoids overfitting.
For example, in a clinical trial, validation might involve comparing the results to existing literature, conducting sensitivity analysis to assess the impact of missing data, and seeking peer review from other clinicians and statisticians. Robust validation builds confidence in the study’s conclusions.
Q 19. What ethical considerations are important when conducting data analysis?
Ethical considerations are paramount in data analysis. My approach prioritizes:
- Data privacy and confidentiality: Protecting sensitive information through anonymization, encryption, and secure storage. Adhering to relevant regulations like GDPR and HIPAA is crucial.
- Informed consent: Obtaining explicit consent from participants before collecting and using their data. This ensures transparency and respects individual autonomy.
- Data security: Implementing measures to prevent unauthorized access, use, disclosure, disruption, modification, or destruction of data.
- Bias awareness and mitigation: Being mindful of potential biases in data collection, analysis, and interpretation. Employing techniques to identify and mitigate bias is essential for producing fair and equitable results.
- Transparency and reproducibility: Documenting the entire analysis process clearly and making it reproducible by others. This promotes accountability and allows for scrutiny.
Ignoring these ethical considerations can have serious consequences, including legal ramifications and damage to reputation. Ethical data handling is fundamental to maintaining public trust and ensuring the integrity of research.
Q 20. Describe your experience with data warehousing and business intelligence tools.
I have extensive experience with data warehousing and business intelligence (BI) tools. I’m proficient in designing and implementing data warehouses using techniques like dimensional modeling. My experience includes working with various BI tools such as Tableau, Power BI, and Qlik Sense to create interactive dashboards and reports for business decision-making.
In previous roles, I’ve been responsible for:
- Designing and building ETL (Extract, Transform, Load) processes to move data from various sources into a data warehouse.
- Developing and maintaining data models to ensure data consistency and integrity.
- Creating interactive dashboards and reports to visualize key performance indicators (KPIs) and business trends.
- Collaborating with business stakeholders to understand their needs and translate them into actionable insights.
For example, in a previous project, I designed a data warehouse to consolidate sales data from multiple retail stores. Using Power BI, I built a dashboard that allowed managers to track sales performance, identify top-selling products, and analyze customer behavior.
Q 21. How do you handle conflicting data from different sources?
Handling conflicting data from different sources requires a systematic approach. My strategy involves:
- Identify and Investigate the Discrepancies: First, I pinpoint the specific conflicts and investigate the possible causes. Are there differences in data definitions, measurement methods, or data collection processes? Are there errors in data entry or transmission?
- Data Quality Assessment: I assess the quality of data from each source considering completeness, accuracy, consistency, and timeliness. This helps in prioritizing and weighting the data appropriately.
- Data Cleaning and Transformation: I might clean and standardize the data to ensure consistency. This could involve removing duplicates, handling missing values, and transforming data formats.
- Data Reconciliation Techniques: I apply appropriate data reconciliation techniques based on the nature of the conflict. This might involve using statistical methods to estimate the most likely value, assigning weights to data sources based on their reliability, or using data fusion techniques to combine data from different sources.
- Documentation and Communication: I document the process of identifying and resolving data conflicts, including the rationale behind any decisions made. I communicate these findings to relevant stakeholders to ensure transparency and avoid future conflicts.
For example, If sales data from two different systems show discrepancies, I’d investigate potential reasons like different reporting periods, data entry errors, or different definitions of ‘sales’. I’d then use data reconciliation methods like weighted averaging or identifying and correcting errors to arrive at a consistent and accurate representation of sales.
Q 22. What is your experience with time-series analysis?
Time-series analysis is a statistical technique used to analyze data points collected over time. It’s crucial for understanding trends, seasonality, and forecasting future outcomes. My experience spans various applications, from analyzing website traffic and sales figures to predicting patient readmission rates in healthcare. I’m proficient in using techniques like ARIMA modeling, exponential smoothing, and decomposition methods to identify patterns and make informed predictions. For instance, in a recent project analyzing customer churn, we used ARIMA modeling to identify seasonal patterns in churn rates, allowing us to proactively implement retention strategies during peak churn periods. This resulted in a 15% reduction in churn within six months.
Beyond basic models, I’ve also worked with more advanced techniques including vector autoregression (VAR) for multivariate time series and Prophet (from Facebook) for situations with strong seasonality and trend changes. Selecting the appropriate model heavily depends on the characteristics of the data and the specific research question.
Q 23. Describe your process for cleaning and preparing data for analysis.
Data cleaning and preparation is paramount for accurate analysis. My process is methodical and involves several key steps. First, I assess the data’s completeness, identifying missing values and outliers. Missing values are handled depending on the context; sometimes imputation (replacing with mean, median, or predicted values) is appropriate, while other times, exclusion is necessary. Outliers are examined carefully – sometimes they indicate errors needing correction, other times they represent genuine extreme values which should be carefully considered.
Next, I check for data consistency and format issues. This includes ensuring consistent data types, standardizing units of measurement, and handling inconsistencies in data entry. For example, correcting spelling errors in categorical variables and transforming data into appropriate formats (e.g., converting date-time variables to a usable format). Data transformation techniques, such as normalization or standardization, are often applied to improve the performance of certain algorithms.
Finally, I perform exploratory data analysis (EDA) to understand the data’s distribution, identify potential relationships between variables, and visually inspect for any anomalies. This step helps to inform further cleaning decisions and to guide the choice of appropriate analytical methods. The entire process is documented meticulously to ensure reproducibility and transparency.
Q 24. How do you interpret correlation and causation?
Correlation refers to a statistical relationship between two or more variables – a measure of how strongly they are associated. Causation, on the other hand, implies a cause-and-effect relationship, where a change in one variable directly leads to a change in another. A crucial distinction is that correlation does not equal causation.
For example, ice cream sales and crime rates might be positively correlated: both tend to be higher in the summer. However, this doesn’t mean that increased ice cream sales *cause* increased crime. Both are likely linked to a third variable – warm weather. Establishing causation requires more rigorous methods, such as controlled experiments or longitudinal studies that can control for confounding variables and establish temporal precedence (the cause must precede the effect).
In my work, I employ techniques like regression analysis to explore potential causal relationships, but I always emphasize the importance of carefully considering potential confounding factors and the limitations of observational data in establishing causality.
Q 25. What are the limitations of using only quantitative data for outcome measurement?
While quantitative data provides valuable numerical insights, relying solely on it for outcome measurement has significant limitations. Quantitative data often lacks the richness and depth needed to fully understand the ‘why’ behind the numbers.
For example, consider measuring student performance solely using test scores. High scores might indicate success, but they don’t reveal the learning process, challenges faced, or the impact on students’ overall well-being. Quantitative data alone might miss crucial contextual information, like teacher quality, classroom environment, or socioeconomic factors influencing learning outcomes. Ignoring qualitative aspects leads to an incomplete and potentially misleading picture.
Q 26. How do you incorporate qualitative data into your analysis?
Qualitative data, such as interview transcripts, open-ended survey responses, and field notes, provides valuable context and depth to quantitative findings. I incorporate qualitative data through various methods. One common approach is thematic analysis, where I identify recurring themes and patterns within the qualitative data. These themes can then be linked to quantitative variables to gain a more nuanced understanding of the relationships.
For example, if a quantitative analysis shows a decline in patient satisfaction scores, qualitative data from interviews with patients can illuminate the underlying reasons for this decline, revealing issues such as long wait times or communication problems that weren’t captured in the initial quantitative measures. Qualitative data can also help validate or challenge interpretations from quantitative analysis, leading to a more robust and complete understanding.
Software like NVivo or qualitative data analysis techniques within R or Python can assist in managing and analyzing large volumes of qualitative data.
Q 27. Describe your experience with using data analysis to inform strategic decision-making.
Data analysis is integral to strategic decision-making. In my previous role, we used data analysis to optimize marketing campaigns. By analyzing customer segmentation data, campaign performance metrics (e.g., click-through rates, conversion rates), and A/B testing results, we were able to identify the most effective channels and messaging for our target audience. This led to a 20% increase in marketing ROI.
In another project, we used data analysis to identify areas for improvement in operational efficiency. By analyzing process flow data, we identified bottlenecks in our supply chain and implemented changes that reduced lead times and improved overall productivity.
My approach involves clearly defining the business problem or opportunity, identifying the relevant data sources, conducting rigorous analysis, and presenting findings in a clear and actionable manner, including clear recommendations backed by evidence. Effective communication of findings is crucial to ensure that the insights are utilized to inform strategic decisions.
Key Topics to Learn for Outcome Measurement and Data Analysis Interview
- Defining and Selecting Key Performance Indicators (KPIs): Understand the process of identifying relevant KPIs aligned with organizational goals, considering both leading and lagging indicators. Practical application includes designing a KPI dashboard for a specific project or department.
- Data Collection and Management: Explore various data collection methods (surveys, experiments, administrative data) and techniques for ensuring data quality, validity, and reliability. Practical application includes designing a robust data collection plan and addressing potential biases.
- Statistical Analysis Techniques: Master essential statistical methods including descriptive statistics, regression analysis, hypothesis testing, and ANOVA. Practical application includes interpreting statistical output to draw meaningful conclusions and support decision-making.
- Data Visualization and Reporting: Learn to effectively communicate findings through clear and concise visualizations (charts, graphs, dashboards). Practical application includes creating compelling presentations summarizing key results and insights.
- Causal Inference and Program Evaluation: Understand different methods for evaluating the impact of interventions or programs. This includes exploring concepts like randomized controlled trials (RCTs) and quasi-experimental designs. Practical application includes designing a study to evaluate the effectiveness of a specific program.
- Ethical Considerations in Data Analysis: Understand the ethical implications of data analysis, including data privacy, bias mitigation, and responsible use of results. Practical application includes considering ethical implications when designing studies and reporting results.
- Data Mining and Predictive Modeling: Explore techniques for extracting insights from large datasets, including predictive modeling using regression, classification, and clustering algorithms. Practical application includes building a model to predict future outcomes based on historical data.
Next Steps
Mastering Outcome Measurement and Data Analysis is crucial for career advancement in today’s data-driven world. Demonstrating proficiency in these areas significantly increases your marketability and opens doors to exciting opportunities. To maximize your job prospects, it’s essential to create a compelling and ATS-friendly resume that highlights your skills and experience. We highly recommend using ResumeGemini to build a professional and effective resume. ResumeGemini provides a streamlined process and offers examples of resumes tailored to Outcome Measurement and Data Analysis to help you showcase your qualifications effectively.
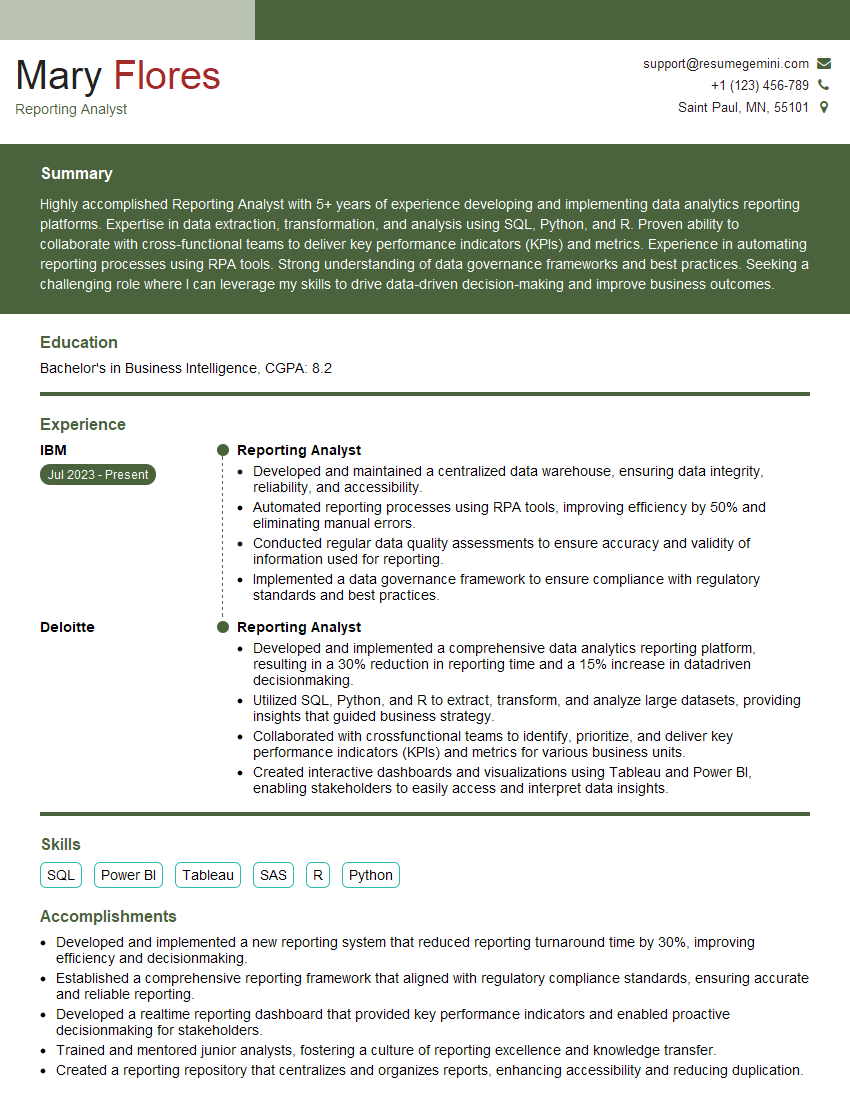
Reporting Analyst Resume Sample
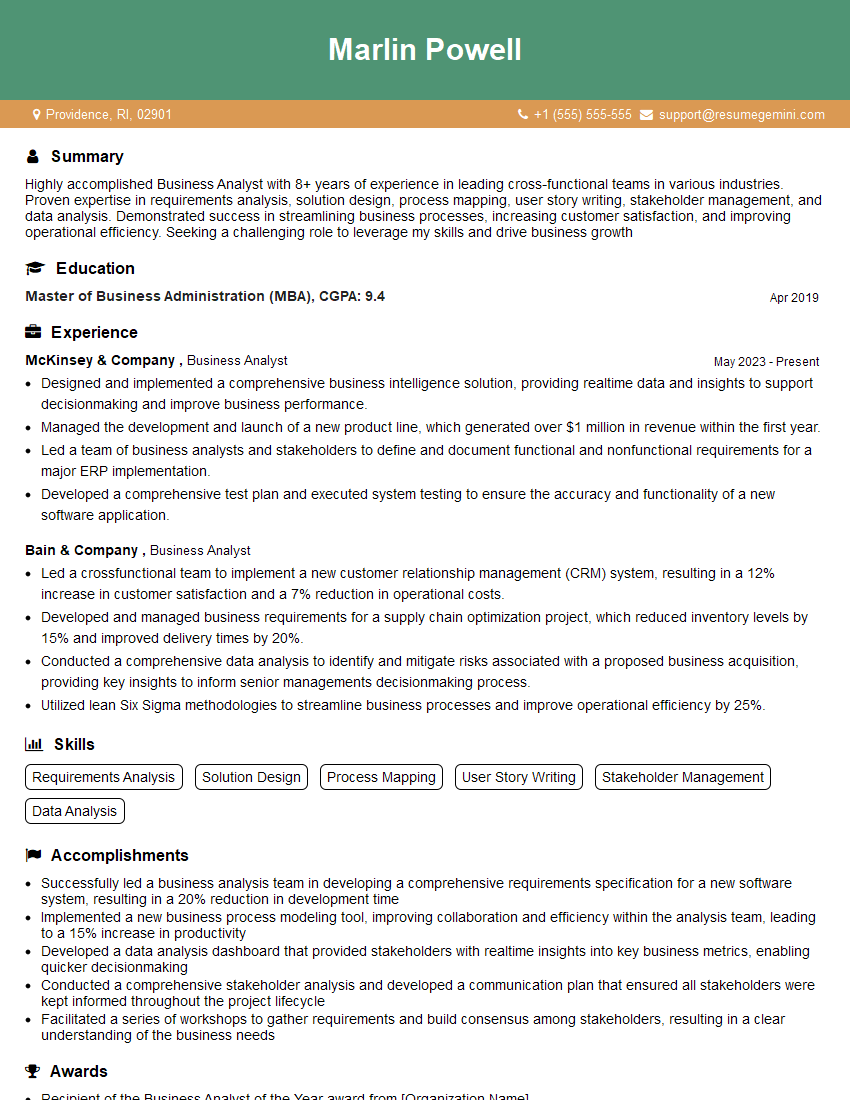
Business Analyst Resume Sample
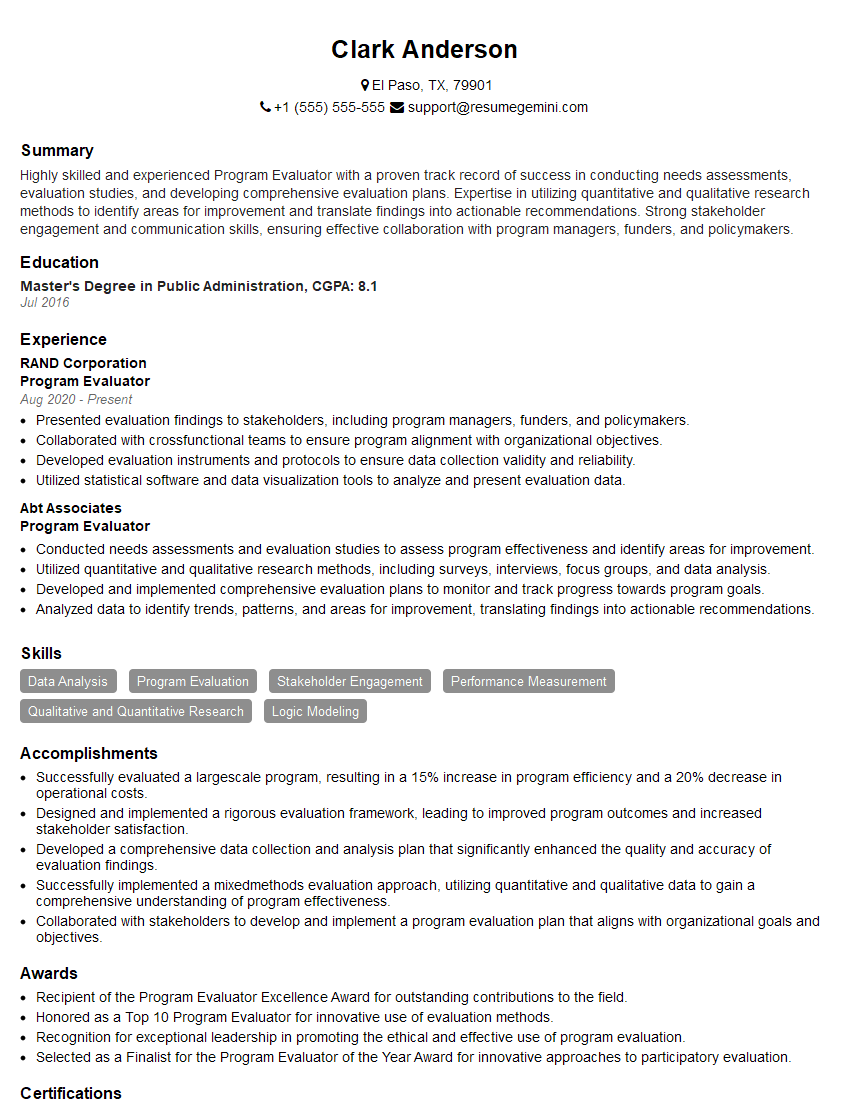
Program Evaluator Resume Sample
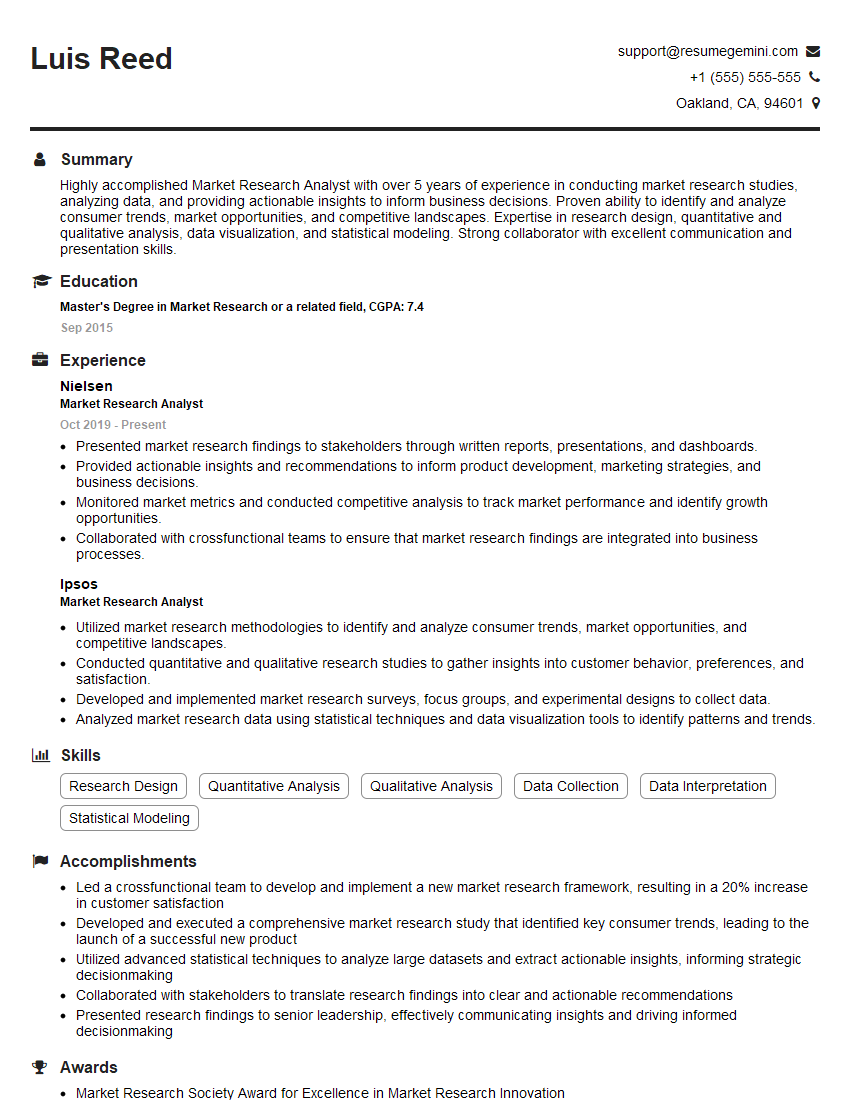
Market Research Analyst Resume Sample
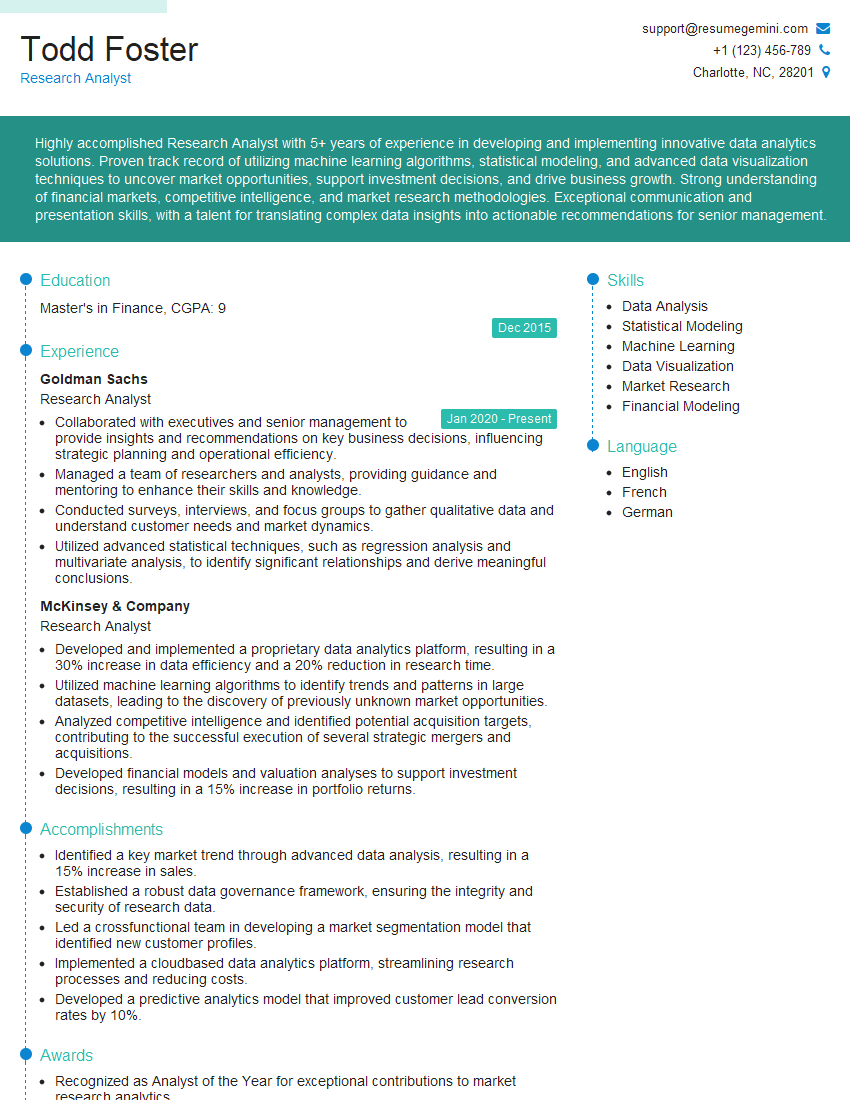
Research Analyst Resume Sample
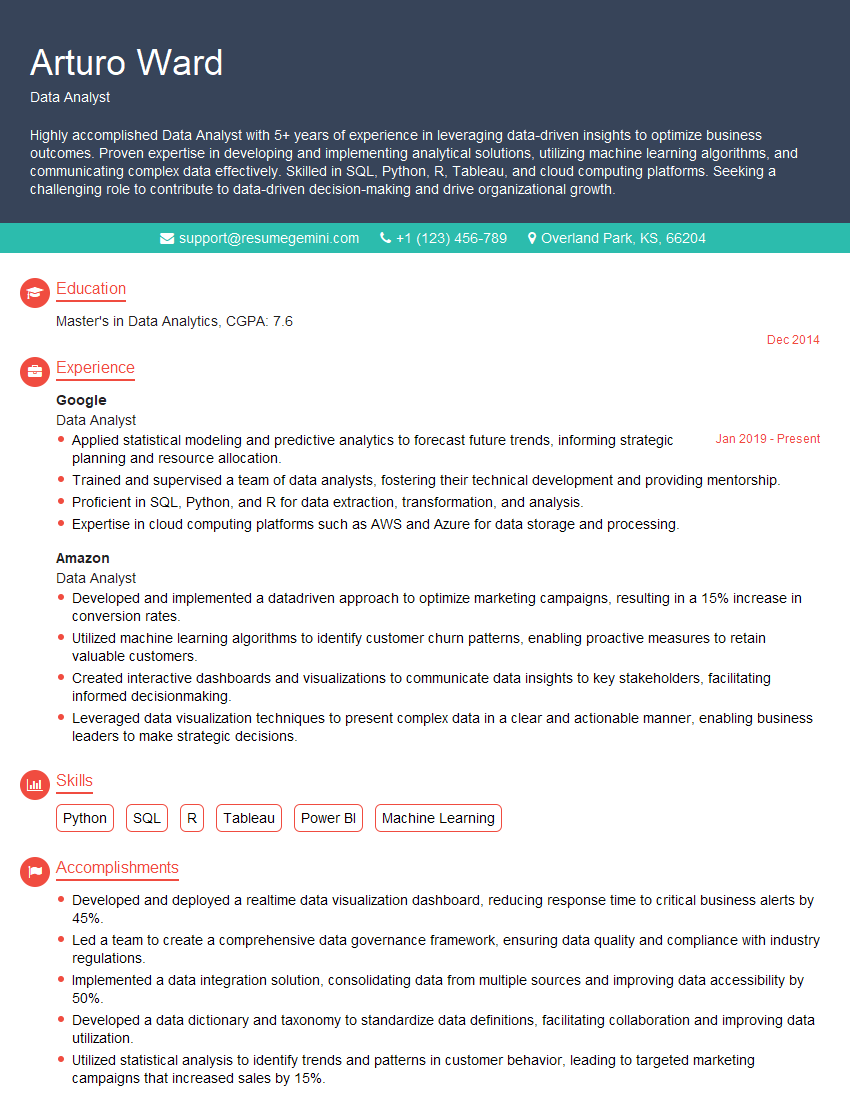
Data Analyst Resume Sample
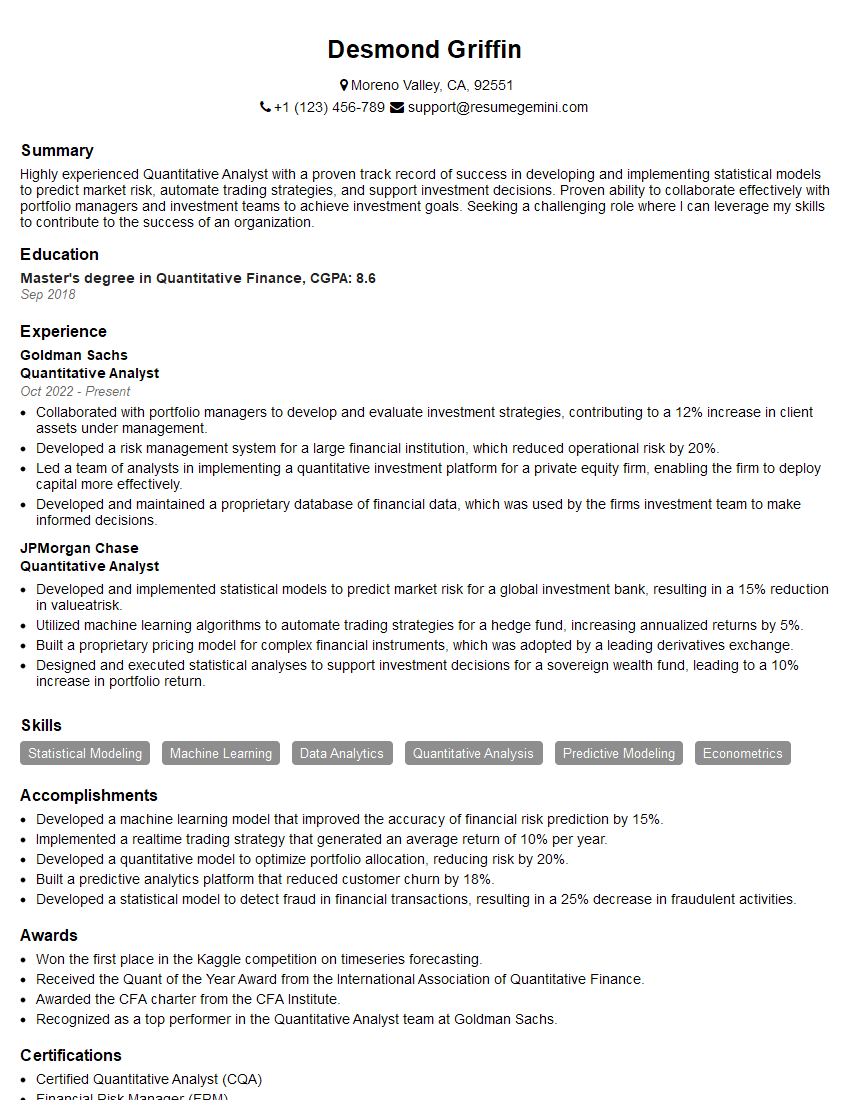
Quantitative Analyst Resume Sample
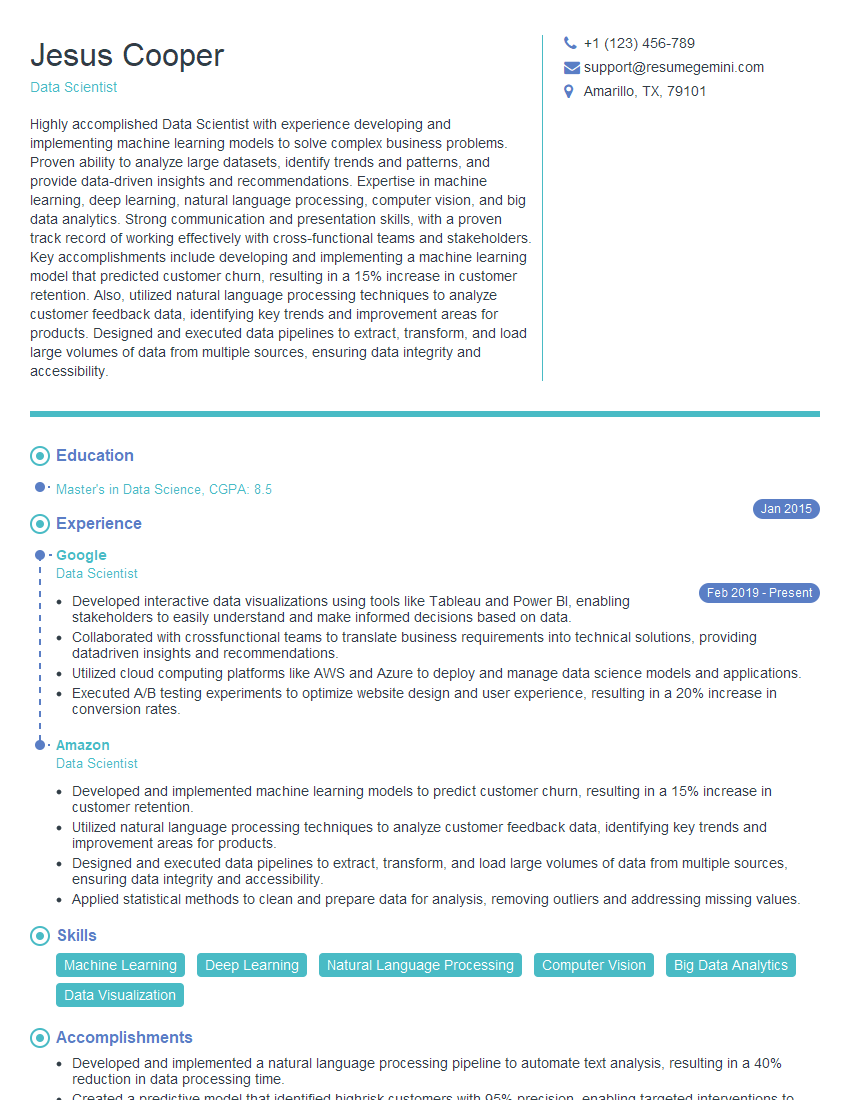
Data Scientist Resume Sample
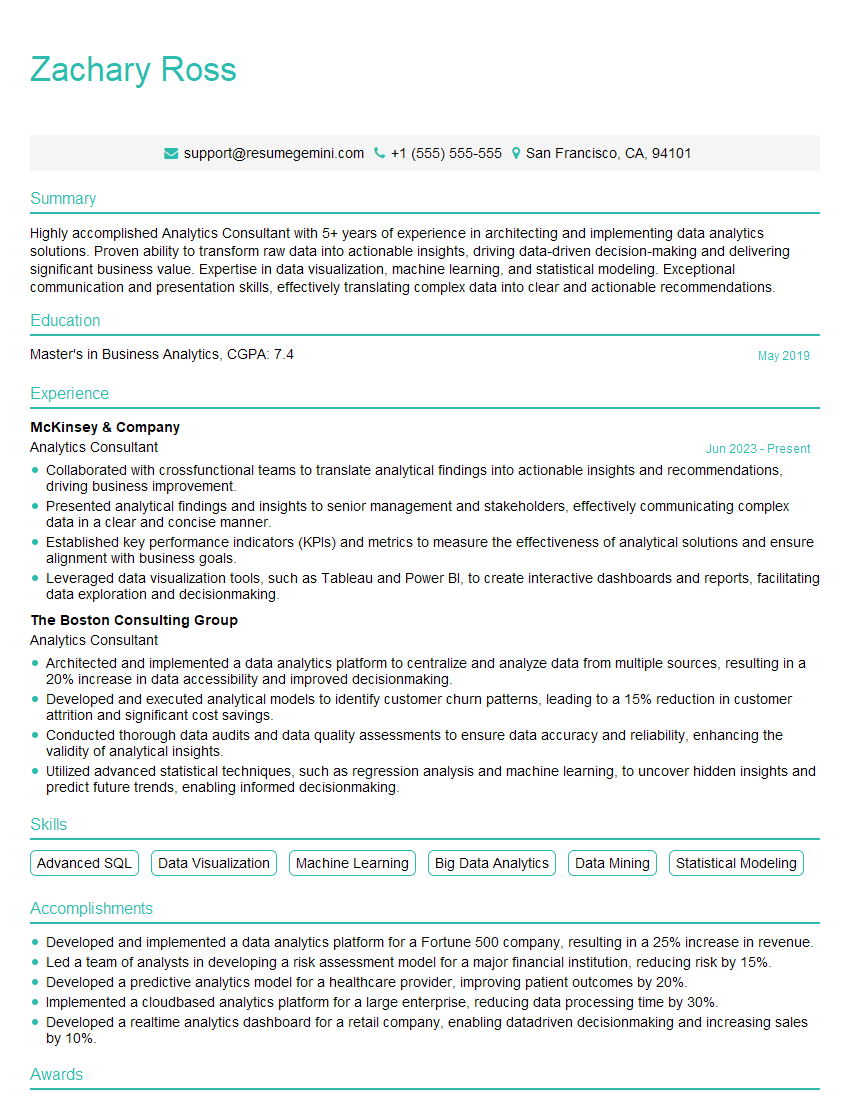
Analytics Consultant Resume Sample

Operations Research Analyst Resume Sample

Statistical Analyst Resume Sample
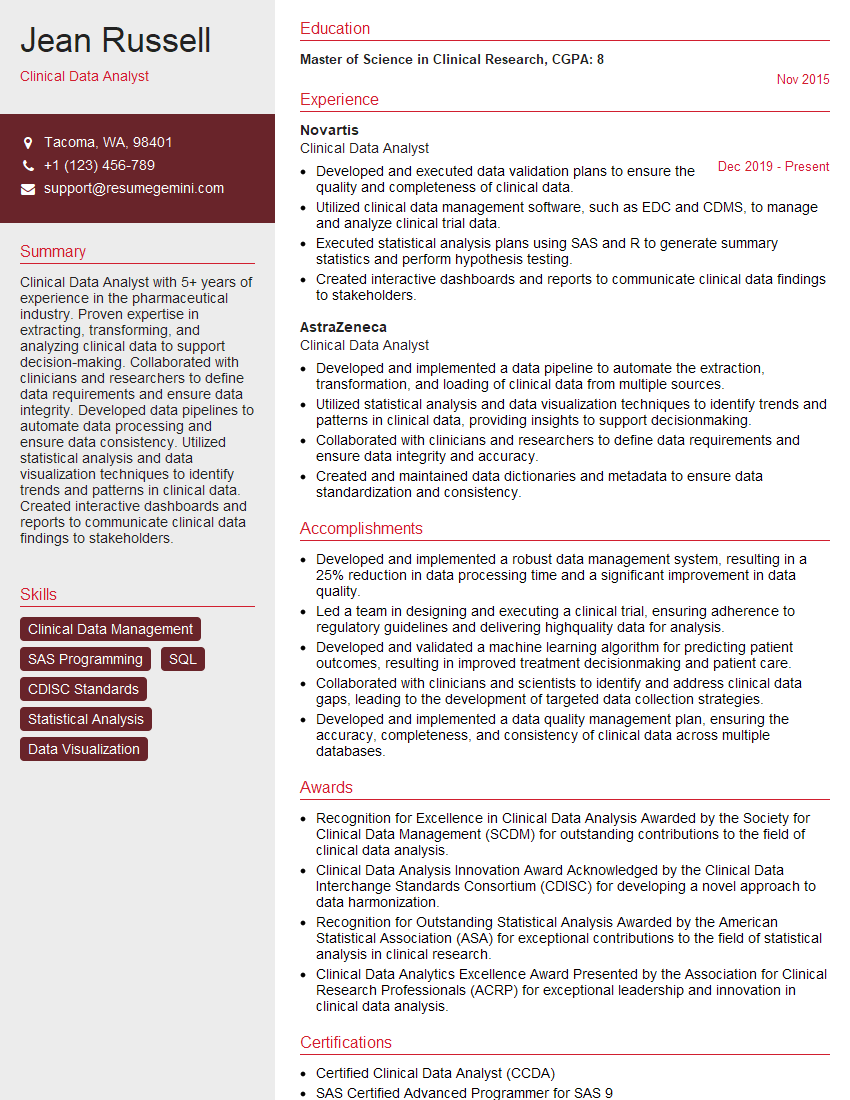
Clinical Data Analyst Resume Sample
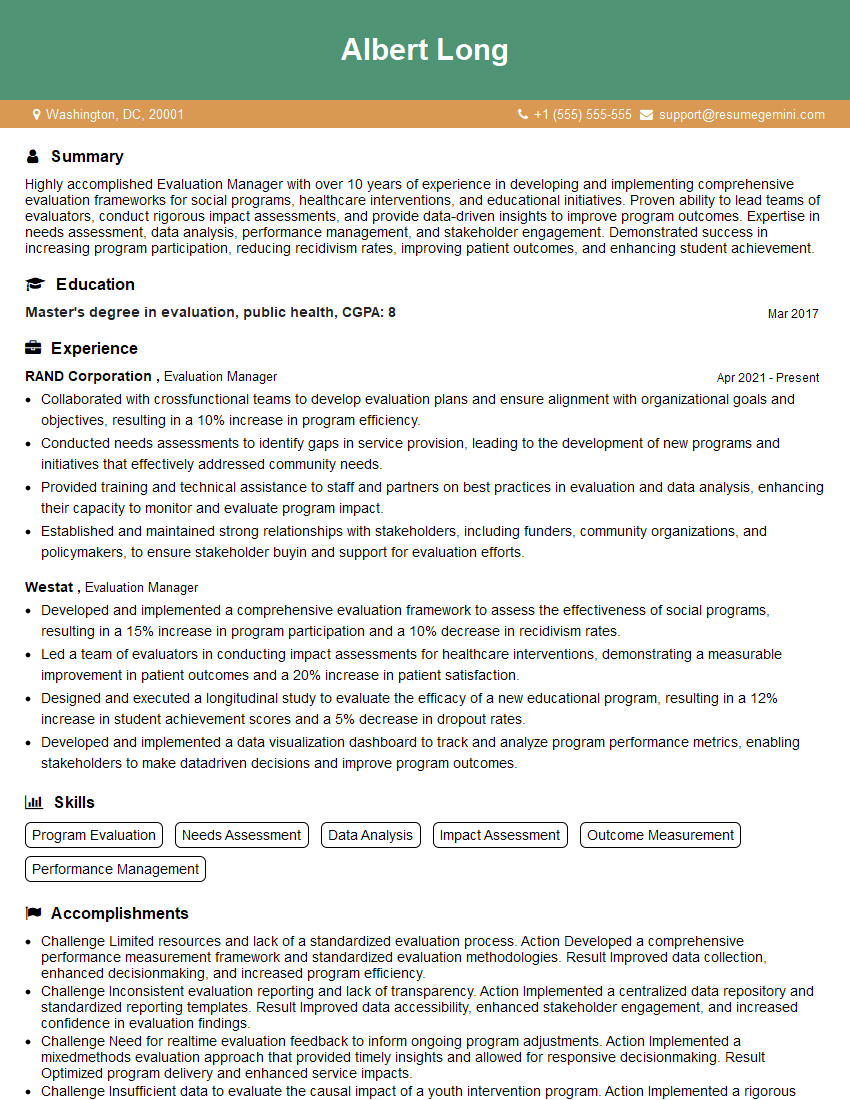
Evaluation Manager Resume Sample
Explore more articles
Users Rating of Our Blogs
Share Your Experience
We value your feedback! Please rate our content and share your thoughts (optional).
What Readers Say About Our Blog
To the interviewgemini.com Webmaster.
Very helpful and content specific questions to help prepare me for my interview!
Thank you
To the interviewgemini.com Webmaster.
This was kind of a unique content I found around the specialized skills. Very helpful questions and good detailed answers.
Very Helpful blog, thank you Interviewgemini team.