Are you ready to stand out in your next interview? Understanding and preparing for Political Methodology interview questions is a game-changer. In this blog, we’ve compiled key questions and expert advice to help you showcase your skills with confidence and precision. Let’s get started on your journey to acing the interview.
Questions Asked in Political Methodology Interview
Q 1. Explain the difference between experimental and observational designs in political science research.
The core difference between experimental and observational designs lies in how researchers assign subjects to treatment and control groups. In experimental designs, researchers randomly assign individuals to different groups, ensuring that the only systematic difference between groups is the treatment. This randomization minimizes confounding variables – factors that might influence the outcome besides the treatment. A classic example is a randomized controlled trial (RCT) testing the effect of a specific campaign ad on voter turnout. Researchers randomly assign participants to view the ad or not, then compare their turnout rates.
Conversely, in observational designs, researchers do not control the assignment of individuals to groups. They observe naturally occurring variation in the treatment (e.g., exposure to a policy) and examine its association with the outcome. For instance, researchers might compare voter turnout in states with different voter ID laws. Because assignment isn’t randomized, it’s harder to isolate the effect of the voter ID laws from other factors that might differ between these states (e.g., demographics, political culture).
Experimental designs offer stronger causal inference because of randomization, but they can be ethically challenging or impractical to implement in many political contexts. Observational designs are more feasible but face greater challenges in establishing causality due to potential confounding factors.
Q 2. Describe the strengths and weaknesses of different regression techniques (e.g., OLS, logistic regression).
Several regression techniques are used in political science, each with its strengths and weaknesses. Ordinary Least Squares (OLS) regression is a widely used method for estimating the linear relationship between a dependent variable and one or more independent variables. Its strengths include relative simplicity and ease of interpretation. However, OLS assumes a linear relationship, which may not always hold; it’s sensitive to outliers and multicollinearity (high correlation between independent variables), and it requires the errors to be normally distributed and homoscedastic (constant variance).
Logistic regression is suitable when the dependent variable is binary (e.g., voted/did not vote). It models the probability of the outcome occurring. Its strength lies in its ability to handle binary dependent variables. However, it also assumes a linear relationship between the independent variables and the log-odds of the outcome, which might not always be realistic. Similar to OLS, it can be sensitive to outliers and multicollinearity.
Other techniques, like robust regression (less sensitive to outliers) and generalized linear models (GLMs) (for various outcome types beyond linear and binary), address some limitations of OLS and logistic regression but often introduce added complexity. The choice of regression technique depends heavily on the research question and the characteristics of the data.
Q 3. How do you handle missing data in a political science dataset?
Missing data is a common challenge in political science. The optimal strategy depends on the pattern and mechanism of missing data. There are several approaches:
- Listwise deletion: Removing cases with any missing data. This is simple but can lead to biased estimates and reduced statistical power if the missing data is not Missing Completely at Random (MCAR).
- Pairwise deletion: Using all available data for each analysis. This can improve efficiency compared to listwise deletion but might lead to inconsistencies in the results.
- Imputation: Filling in missing values with plausible estimates. Methods include mean/mode imputation (simple, but can bias estimates), regression imputation, and multiple imputation (more sophisticated, accounts for uncertainty in imputation).
Before choosing a method, it is crucial to understand why data is missing. Missing data mechanisms include MCAR (missingness is unrelated to observed or unobserved variables), MAR (missingness depends on observed variables), and MNAR (missingness depends on unobserved variables). MNAR is the most challenging to handle, often requiring specialized techniques or acknowledging limitations in the analysis.
Q 4. What are the key assumptions of causal inference, and how can they be violated?
Causal inference aims to establish a cause-and-effect relationship between variables. Key assumptions include:
- No confounding: The only systematic difference between treatment and control groups is the treatment itself. Violation occurs when confounding variables influence both treatment and outcome.
- Positivity: All possible values of the treatment variable must have a non-zero probability of occurring, given the covariates. Violation means some combinations of treatment and covariates are impossible.
- Consistency: The effect of the treatment is the same across all individuals. Violation might arise if the treatment has different effects on different subgroups.
- Ignorability (often implied by randomization): Given the observed covariates, the treatment assignment is independent of the potential outcomes (both for treatment and control).
Violations of these assumptions can lead to biased estimates of causal effects. For instance, confounding can lead to over- or underestimation of the treatment’s impact. Addressing these violations often involves careful research design (e.g., randomization, matching), statistical adjustments (e.g., regression with controls), or instrumental variables analysis.
Q 5. Explain the concept of endogeneity and how it can be addressed.
Endogeneity refers to a situation where an independent variable is correlated with the error term in a regression model. This correlation violates a crucial assumption of OLS and leads to biased and inconsistent estimates. Several scenarios can cause endogeneity:
- Omitted variable bias: A relevant variable is excluded from the model, causing its effect to be absorbed into the error term, thus correlating it with the included independent variable.
- Simultaneity bias: Two or more variables are jointly determined (e.g., supply and demand). The effect of one on the other can’t be cleanly estimated using simple regression.
- Measurement error: Error in measuring an independent variable can lead to endogeneity if it’s correlated with the true value of the variable.
Addressing endogeneity requires techniques such as:
- Instrumental variables (IV) regression: Using a variable (instrument) correlated with the endogenous variable but uncorrelated with the error term. Finding suitable instruments is crucial and can be challenging.
- Two-stage least squares (2SLS): A specific technique to estimate causal effects in presence of endogeneity, often employing instrumental variables.
- Panel data methods: Utilizing data collected over time, allowing for the use of fixed effects or lagged dependent variables to mitigate endogeneity issues.
Q 6. What are some common threats to internal and external validity in political science research?
Threats to internal validity concern whether the observed relationship between variables is truly causal within the study itself. Examples include:
- Confounding: As discussed earlier, other variables might explain the observed relationship.
- Selection bias: Non-random selection of participants, leading to differences between treatment and control groups unrelated to the treatment.
- History: External events during the study might influence the outcome.
- Maturation: Natural changes in participants over time might confound results.
Threats to external validity concern the generalizability of findings to other populations, settings, or times. Examples include:
- Sample bias: The sample might not represent the population of interest.
- Artificiality: The research setting might be too different from the real world.
- Testing effects: The act of measuring variables might change participant behavior.
Careful research design, random sampling, controlling for confounding factors, and replicating studies in different contexts help mitigate these threats.
Q 7. Describe different methods for measuring political attitudes and beliefs.
Measuring political attitudes and beliefs is complex, requiring various methods depending on the concept and the target population.
- Surveys: Widely used to measure attitudes through questionnaires. Question wording, scale types (e.g., Likert scales, semantic differentials), and response options are critical choices impacting data quality and interpretation. Examples include measuring support for a political party or assessing opinions on policy issues.
- Experiments: Measuring reactions to stimuli (e.g., political ads, news articles) in controlled settings. This can reveal causal links between exposure to information and attitude change.
- Content analysis: Analyzing text data (speeches, news articles, social media posts) to quantify the prevalence of specific themes or sentiments related to political attitudes. This method allows for analyzing large volumes of data but requires clear coding schemes and inter-coder reliability checks.
- Behavioral measures: Observing actual behavior (e.g., voting, participation in protests, donations) as an indicator of political attitudes. This approach complements survey data but might be susceptible to various interpretations.
- Implicit measures: Assessing attitudes that individuals might not be consciously aware of or willing to report, using techniques such as Implicit Association Tests (IATs). These are still under debate regarding their validity and reliability in political science.
Choosing the appropriate method depends on the research question, resources, and the level of precision needed. Often, using multiple methods (triangulation) enhances the validity and reliability of measurements.
Q 8. How do you evaluate the reliability and validity of your measures?
Evaluating the reliability and validity of measures is crucial in political science research. Reliability refers to the consistency of a measure; a reliable measure will produce similar results under similar conditions. Validity, on the other hand, refers to the accuracy of a measure – does it actually measure what it intends to measure?
We assess reliability using several techniques. Test-retest reliability involves administering the same measure at two different times to the same group. High correlation between the two sets of scores indicates high reliability. Internal consistency reliability, often measured using Cronbach’s alpha, assesses the consistency of items within a scale. A high alpha (generally above 0.7) suggests the items measure the same construct. Inter-rater reliability is relevant when multiple observers are coding data; high agreement between raters indicates high reliability.
Validity is more complex and multifaceted. Face validity is a subjective assessment of whether the measure appears to measure what it should. Content validity ensures that the measure covers all aspects of the concept being measured. Criterion validity assesses the measure’s correlation with an external criterion; for example, does a survey measure of political participation correlate with actual voting behavior? Construct validity is the most rigorous, demonstrating that the measure accurately reflects the underlying theoretical construct. This often involves factor analysis or other multivariate techniques.
For example, if I’m measuring political efficacy (the belief that one can influence politics), I’d use a multi-item scale, check its Cronbach’s alpha for internal consistency, and possibly correlate it with voting behavior (criterion validity) to assess both reliability and validity. Any inconsistencies or low correlations would suggest problems with the measure that need addressing before analysis.
Q 9. Explain the difference between descriptive and inferential statistics.
Descriptive and inferential statistics serve different purposes in analyzing data. Descriptive statistics summarize and describe the main features of a dataset, while inferential statistics use sample data to make inferences about a larger population.
Descriptive statistics involve calculating measures like mean, median, mode, standard deviation, and creating visualizations like histograms and bar charts. These help us understand the characteristics of our observed data. For example, calculating the average age of respondents in a survey or showing the distribution of political party affiliation using a bar chart are descriptive statistical tasks.
Inferential statistics go further; they allow us to draw conclusions beyond the immediate data. Techniques like hypothesis testing, t-tests, ANOVA, regression analysis, etc., are used to determine if observed differences or relationships are likely due to chance or represent true effects in the population. For example, we might use a t-test to see if there’s a statistically significant difference in the average political knowledge scores between men and women, or a regression analysis to examine the relationship between education level and voter turnout.
Q 10. How do you interpret the results of a regression analysis?
Interpreting regression analysis results involves understanding the coefficients, their statistical significance, and the overall model fit. Regression analysis explores the relationship between a dependent variable and one or more independent variables.
The coefficients represent the change in the dependent variable associated with a one-unit change in the independent variable, holding other variables constant. Their p-values indicate statistical significance – a low p-value (typically below 0.05) suggests the relationship is unlikely due to chance. The R-squared value indicates the proportion of variance in the dependent variable explained by the independent variables; a higher R-squared suggests a better-fitting model.
For instance, in a regression predicting voter turnout (dependent variable) from education level (independent variable), a coefficient of 0.10 for education level might suggest that for each additional year of education, voter turnout increases by 10 percentage points, assuming other factors are held constant. A low p-value (e.g., 0.01) would mean this effect is statistically significant. An R-squared of 0.30 would indicate that 30% of the variation in voter turnout is explained by education level.
It is crucial to also consider other factors like the model’s assumptions (linearity, independence of errors, homoscedasticity), potential confounding variables, and the substantive meaning of the findings in the context of the research question.
Q 11. What are the ethical considerations in conducting political science research?
Ethical considerations are paramount in political science research. These involve protecting participants’ rights and ensuring the integrity of the research process.
- Informed consent: Participants must be fully informed about the study’s purpose, procedures, and risks, and give their voluntary consent to participate.
- Anonymity and confidentiality: Researchers must protect the privacy of participants by ensuring their data cannot be linked back to them.
- Data security: Data must be securely stored and protected from unauthorized access.
- Avoiding harm: Researchers should take steps to minimize any potential risks to participants, both physical and psychological.
- Transparency and honesty: Researchers must be transparent about their methods and findings and avoid any misleading or manipulative practices. This includes proper citation and avoidance of plagiarism.
- Conflicts of interest: Researchers must disclose any potential conflicts of interest that could influence their research.
- Research integrity: Researchers must adhere to high ethical standards in data collection, analysis, and reporting. This includes ensuring data quality and accuracy and avoiding fabrication or falsification of data.
For example, in a study on voting behavior, researchers must obtain informed consent from participants, ensure their responses are anonymous, and protect the security of the collected data. Any potential harm, such as discomfort or emotional distress, must be minimized.
Q 12. Discuss the use of qualitative methods in conjunction with quantitative methods.
Mixing qualitative and quantitative methods, known as mixed methods research, provides a more comprehensive understanding of political phenomena than relying on either approach alone. Quantitative methods, such as surveys and statistical analysis, provide breadth and generalizability, while qualitative methods like interviews and ethnography offer depth and context.
The combination can strengthen the validity and reliability of findings. For instance, quantitative data from a large-scale survey might reveal correlations between variables. Qualitative interviews can then be used to explore the mechanisms behind these correlations, providing a richer, more nuanced explanation.
The design of a mixed methods study depends on the research question. A convergent parallel design involves collecting and analyzing both quantitative and qualitative data simultaneously, comparing the results. An explanatory sequential design might start with quantitative data and then use qualitative data to explain the findings. An exploratory sequential design might start with qualitative data to generate hypotheses that are then tested quantitatively. Choosing the appropriate design hinges on the goals of the study and the specific interplay between the data types.
Imagine studying the impact of a new voting law. Quantitative analysis of voter turnout before and after the law’s implementation provides generalizable results. Qualitative interviews with voters and election officials can then illuminate the reasons for any observed changes, adding depth and understanding.
Q 13. Explain the concept of statistical power and its importance.
Statistical power is the probability of correctly rejecting a false null hypothesis. In simpler terms, it’s the chance your study will detect an effect if it truly exists. A study with high power is more likely to find significant results when there’s a real effect to be found; a study with low power might fail to find significant results even if a real effect is present. This is often referred to as a Type II error.
Several factors influence statistical power:
- Sample size: Larger samples generally lead to higher power.
- Effect size: Larger effects are easier to detect, thus increasing power.
- Significance level (alpha): A higher alpha (e.g., 0.10 instead of 0.05) increases power but also increases the chance of a Type I error (false positive).
- Variability in the data: Less variability increases power.
Aiming for high power (generally 80% or higher) is essential because low power increases the risk of failing to find significant results when the research hypothesis is actually true. This can lead to missed discoveries or incorrect conclusions.
Before conducting a study, researchers often perform a power analysis to determine the necessary sample size to achieve the desired power, given the expected effect size and other factors. This ensures the study is large enough to have a reasonable chance of finding significant results, if they exist.
Q 14. How do you choose the appropriate statistical test for a given research question?
Selecting the appropriate statistical test depends critically on the research question, the type of data (nominal, ordinal, interval, ratio), the number of groups being compared, and whether the data meet the assumptions of the test.
Here’s a simplified framework:
- Comparing means:
- Two independent groups: Independent samples t-test (interval/ratio data) or Mann-Whitney U test (ordinal data).
- Three or more independent groups: ANOVA (interval/ratio data) or Kruskal-Wallis test (ordinal data).
- Two related groups (e.g., pre-post test): Paired samples t-test (interval/ratio data) or Wilcoxon signed-rank test (ordinal data).
- Analyzing relationships between variables:
- Two categorical variables: Chi-square test.
- One categorical and one continuous variable: t-test or ANOVA (if continuous is interval/ratio), or non-parametric alternatives.
- Two or more continuous variables: Regression analysis (linear, logistic, etc.).
For example, if you want to compare the average levels of political engagement between Democrats and Republicans, you would use an independent samples t-test (if engagement is measured on an interval/ratio scale) or Mann-Whitney U test (if it is ordinal). If analyzing the relationship between political ideology (categorical) and voter turnout (categorical), you would use a Chi-square test.
Choosing the wrong test can lead to inaccurate or misleading results. It’s essential to carefully consider the data’s characteristics and the research question to ensure the chosen test is appropriate.
Q 15. What are some common software packages used in political methodology (e.g., R, Stata)?
Political methodology relies heavily on statistical software. The most common packages include R and Stata, but others like SPSS and Python (with libraries like Pandas and Statsmodels) are also frequently used. R is an open-source language known for its flexibility and extensive statistical libraries, making it ideal for complex analyses and customizability. Stata is a more user-friendly, proprietary package that excels in efficient data management and a wide array of built-in statistical procedures. The choice often depends on the specific research question, the researcher’s familiarity with a particular language, and the availability of resources.
For example, if I’m working with a large, complex dataset requiring advanced modeling techniques, R’s flexibility and extensive package ecosystem (like the tidyverse for data manipulation) would be advantageous. If the project involves simpler regressions and data cleaning on a moderately sized dataset, Stata’s user-friendly interface might be preferred for its speed and efficiency.
Career Expert Tips:
- Ace those interviews! Prepare effectively by reviewing the Top 50 Most Common Interview Questions on ResumeGemini.
- Navigate your job search with confidence! Explore a wide range of Career Tips on ResumeGemini. Learn about common challenges and recommendations to overcome them.
- Craft the perfect resume! Master the Art of Resume Writing with ResumeGemini’s guide. Showcase your unique qualifications and achievements effectively.
- Don’t miss out on holiday savings! Build your dream resume with ResumeGemini’s ATS optimized templates.
Q 16. Describe your experience with data cleaning and preparation.
Data cleaning and preparation are critical, often accounting for the majority of time spent on a project. My experience encompasses a wide range of techniques, from handling missing values (using imputation methods like mean substitution or more sophisticated multiple imputation techniques) to identifying and correcting outliers. I regularly check for inconsistencies in data coding (e.g., variations in spelling or capitalization) and employ techniques to address them. I’m proficient in using regular expressions for pattern matching and data transformation within R and Stata.
For instance, in a recent study on voter turnout, I encountered inconsistencies in how age was recorded. Some entries used numerical values, while others used age ranges. I wrote a script using R’s stringr package to standardize age entries and convert ranges to single values based on midpoints. Addressing such issues ensures the accuracy and reliability of any subsequent analysis.
Q 17. How do you create visualizations to effectively communicate your research findings?
Effective visualization is crucial for communicating research findings clearly and concisely. I use a variety of tools, primarily R’s ggplot2 package and Stata’s built-in graphing capabilities. The choice of visualization depends on the data type and the message I want to convey. For example, bar charts are excellent for showing categorical data comparisons, while scatter plots are useful for exploring relationships between two continuous variables. Box plots effectively display distributions and highlight outliers. For more complex relationships, I may create interactive visualizations using tools like Shiny (in R) or Tableau.
Consider a study on the relationship between campaign spending and election outcomes. A scatter plot showing campaign spending on the x-axis and electoral success (e.g., vote share) on the y-axis would effectively demonstrate any correlation. Further, using color-coding to represent party affiliation would add another layer of analysis. If I am presenting multiple regressions, I may use a table with clear labels, significance stars and R-squared values to present the results.
Q 18. Explain your understanding of different sampling techniques (e.g., random sampling, stratified sampling).
Sampling techniques are fundamental in political science research, especially when dealing with large populations. Random sampling, where every member of the population has an equal chance of being selected, is the gold standard for ensuring representativeness. However, it can be impractical or ineffective in certain situations. Stratified sampling addresses this limitation by dividing the population into strata (subgroups) based on relevant characteristics (e.g., age, ethnicity, region) and then randomly sampling from each stratum. This ensures representation from all key subgroups and reduces sampling error.
For example, if I were studying voting behavior in a diverse country, a simple random sample might not accurately reflect the opinions of all demographic groups. A stratified sample, stratifying by region, ethnicity, and socioeconomic status, would provide a more accurate and representative picture of the voting population.
Q 19. Discuss the challenges of analyzing big data in political science.
Analyzing big data in political science presents unique challenges. The sheer volume of data can strain computational resources, requiring powerful machines and efficient algorithms. Another challenge is data quality – big data is often messy and inconsistent, necessitating robust cleaning and preprocessing. The high dimensionality of big data can also lead to the curse of dimensionality, where relationships become difficult to discern due to the large number of variables. Finally, ethical considerations, such as data privacy and bias, are paramount when dealing with vast amounts of personal information.
For example, analyzing social media data to understand political polarization requires handling massive datasets, dealing with unstructured text, and mitigating biases in the data. Techniques like natural language processing are essential for extracting meaningful insights from such datasets.
Q 20. How do you address issues of multicollinearity in your analysis?
Multicollinearity occurs when two or more independent variables in a regression model are highly correlated. This can lead to unstable and unreliable coefficient estimates, making it difficult to interpret the results. There are several ways to address this. One approach is to remove one or more of the highly correlated variables. Another is to use techniques like principal component analysis (PCA) to create uncorrelated composite variables from the original set of variables. Regularization methods, such as ridge regression or lasso regression, can also help to shrink the coefficients and improve the stability of the model.
In a model predicting election outcomes, if I include both campaign spending and the number of campaign ads as predictors, they may be highly correlated. I might choose to remove one, or use PCA to combine them into a single index representing overall campaign effort.
Q 21. What are some common pitfalls to avoid when conducting political science research?
Several pitfalls can undermine the validity and reliability of political science research. One is confirmation bias, where researchers seek out or interpret evidence to support pre-existing beliefs. Another is selection bias, which occurs when the sample is not representative of the population. Ecological fallacy is a common error, involving making inferences about individuals based on aggregate-level data. Finally, failing to clearly define variables and operationalize concepts can lead to ambiguous and unreliable results.
For instance, studying the impact of a policy change requires carefully considering potential confounding factors and using appropriate statistical techniques (like difference-in-differences) to isolate the policy’s effect. Ignoring these issues can lead to misleading conclusions about the policy’s true impact.
Q 22. Explain your understanding of time series analysis in a political context.
Time series analysis is a statistical technique used to analyze data points collected over time. In political science, this is incredibly useful for understanding trends in things like public opinion, voting patterns, or policy changes. Imagine tracking presidential approval ratings – that’s a time series! We’re not just looking at a single snapshot, but how that approval changes day by day, month by month, or year by year.
The beauty of time series analysis lies in its ability to identify patterns, trends, and seasonality within the data. For instance, we might find a consistent dip in approval ratings after a major policy announcement, or a seasonal increase in voter turnout during election years. This allows us to make more informed inferences and predictions about future political events.
We use various methods, such as ARIMA models or even simpler moving averages, to analyze the data. These methods account for the inherent dependence between consecutive data points— something crucial in time series data because today’s value often influences tomorrow’s.
For example, researchers might use time series analysis to examine the impact of a specific economic policy on a nation’s approval ratings over several years, controlling for other factors such as major international events. The analysis would reveal correlations or causal relationships between the economic policy and shifts in public opinion over time.
Q 23. How do you evaluate the credibility of different political science sources?
Evaluating the credibility of political science sources requires a multifaceted approach. It’s not just about the prestige of the journal or author, but a careful consideration of methodology, data sources, and potential biases.
- Peer Review: Articles published in reputable, peer-reviewed journals have undergone rigorous scrutiny by other experts in the field. This process helps ensure the validity of the research design and results. However, it’s not foolproof.
- Methodology: I scrutinize the research design. Is the sample size adequate? Are the methods appropriate for the research question? What are the potential limitations of their approach? Are the findings reproducible? A clear and transparent methodology is critical.
- Data Sources: The quality and source of the data are paramount. Are the data from reputable sources? How were the data collected (e.g., surveys, experiments, archival data)? Are potential biases in data collection addressed?
- Author Expertise and Potential Biases: While not disqualifying, understanding the author’s background, affiliations, and potential biases is important. Are there any conflicts of interest? Does the writing exhibit overt bias or a lack of neutrality?
- Replication: A highly credible study is one that can be replicated by other researchers using the same methods and data. The ability to replicate findings builds confidence in the robustness of the results.
Ultimately, a critical and skeptical approach is essential. Cross-referencing information from multiple sources strengthens credibility. Reading beyond the abstract and fully engaging with the methods section are key components.
Q 24. Discuss your experience with different types of political data (e.g., survey data, text data, aggregate data).
My experience encompasses a wide range of political data types. Each type presents unique challenges and opportunities.
- Survey Data: I’ve extensively used survey data to analyze public opinion on various political issues. This involves understanding sampling techniques, dealing with missing data, and employing appropriate statistical methods like regression analysis to test hypotheses. For example, I’ve analyzed survey data to explore the relationship between socioeconomic status and voting behavior.
- Text Data: Analyzing text data, such as political speeches, news articles, or social media posts, offers a rich qualitative perspective. Techniques like content analysis, sentiment analysis, and topic modeling allow us to quantify and analyze textual information. I once used sentiment analysis to examine shifts in public sentiment surrounding a particular political candidate during an election campaign.
- Aggregate Data: This includes data at a higher level of aggregation, such as national-level economic indicators or election results. Working with aggregate data requires a strong understanding of ecological inference – the caution needed when drawing inferences about individuals from aggregate-level data. For example, I’ve used aggregate-level data to study the relationship between economic growth and political instability across different countries.
The choice of data type depends entirely on the research question. Often, a mixed-methods approach, combining different types of data, offers the richest insights.
Q 25. How do you interpret p-values and confidence intervals?
P-values and confidence intervals are crucial statistical concepts for interpreting research findings. They help us assess the strength of evidence against a null hypothesis.
P-value: The p-value represents the probability of observing the obtained results (or more extreme results) if the null hypothesis were true. A low p-value (typically below 0.05) provides evidence against the null hypothesis, suggesting that the observed effect is unlikely due to chance alone. However, it doesn’t indicate the size or importance of the effect. A statistically significant result (low p-value) doesn’t automatically imply practical significance.
Confidence Interval: A confidence interval provides a range of plausible values for a population parameter (e.g., the difference in means between two groups). A 95% confidence interval means that if we were to repeat the study many times, 95% of the calculated intervals would contain the true population parameter. A narrow confidence interval indicates higher precision in the estimate.
Example: Suppose we’re testing the effect of a campaign ad on voter intention. A low p-value (e.g., 0.03) suggests the ad had a statistically significant impact. A 95% confidence interval of [0.1, 0.2] indicates we’re 95% confident the ad increased voter intention by somewhere between 10% and 20%. Both the p-value and confidence interval contribute to a comprehensive interpretation of the results.
It’s important to remember that statistical significance does not equal practical significance. A tiny effect might be statistically significant with a large enough sample, yet may not be meaningful in the real world.
Q 26. Describe your experience with conducting literature reviews in political science.
Conducting literature reviews in political science involves a systematic and rigorous process to synthesize existing research on a specific topic. It’s more than just summarizing individual studies; it’s about identifying gaps, trends, and controversies within the literature.
My approach generally follows these steps:
- Define the Research Question: A clear research question guides the entire review process. What specific aspects of the topic will be covered?
- Identify Relevant Databases and Search Terms: I utilize databases like JSTOR, Web of Science, and Scopus, employing relevant keywords and subject headings to identify potentially relevant articles.
- Screen and Select Articles: This involves filtering articles based on relevance to the research question, publication date, and methodological rigor.
- Analyze and Synthesize Findings: I carefully read and analyze the selected articles, identifying common themes, patterns, and disagreements among studies. This often involves creating a coding scheme to systematically categorize information across studies.
- Identify Gaps and Controversies: A crucial aspect is identifying gaps in the research and unresolved controversies. These often represent avenues for future research.
- Write a Comprehensive Review: The review summarizes the key findings, highlighting major themes and controversies, and identifies gaps in the research. The review should be more than a list of studies; it should offer an insightful synthesis and interpretation of the existing literature.
I often use qualitative and quantitative methods to analyze the findings. For instance, I may use bibliometrics to analyze the citation patterns within the literature, revealing influential studies and research trends.
Q 27. How do you stay updated on the latest developments in political methodology?
Staying updated in the rapidly evolving field of political methodology requires a multi-pronged approach.
- Academic Journals: Regularly reading leading journals such as the American Political Science Review, Political Analysis, and Journal of Politics is critical. These journals publish cutting-edge research and methodological advancements.
- Conferences and Workshops: Attending conferences and workshops is essential for networking with leading scholars and learning about the latest research. Many conferences also offer dedicated workshops or training sessions on new methods.
- Online Resources and Blogs: There are many valuable online resources, blogs, and discussion forums dedicated to political methodology. These platforms offer insights into current debates and new methodological developments.
- Methodological Books and Textbooks: Staying abreast of newly published books and textbooks on specific statistical techniques or methodological approaches ensures familiarity with the latest developments.
- Software and Programming: Proficiency in statistical software (R, Stata, etc.) is crucial. Staying updated on software packages, add-ons, and new statistical routines ensures you are using the best tools for your analysis. Regularly attending online tutorials and webinars enhances this.
Continuous learning and a proactive engagement with the latest scholarship are crucial for any political methodologist aiming to stay at the forefront of the field.
Key Topics to Learn for Political Methodology Interview
- Quantitative Research Methods: Understanding regression analysis, causal inference, experimental design, and data visualization techniques is crucial. Consider exploring different regression models and their applications in political science.
- Qualitative Research Methods: Mastering methods like interviews, case studies, and content analysis, along with understanding their strengths and limitations in political research. Practice analyzing qualitative data and formulating compelling arguments based on your findings.
- Statistical Software Proficiency: Demonstrate familiarity with statistical packages like R or Stata. Be prepared to discuss your experience with data cleaning, manipulation, and statistical modeling. Showcase specific projects where you used these skills.
- Causal Inference: Deepen your understanding of causal inference techniques, including instrumental variables, regression discontinuity design, and difference-in-differences. Be ready to discuss the challenges of establishing causality in political science research.
- Research Design: Showcase your ability to design rigorous research projects. This includes formulating clear research questions, selecting appropriate methodologies, and outlining a feasible research plan. Be prepared to discuss the strengths and weaknesses of various research designs.
- Data Analysis and Interpretation: Beyond technical skills, emphasize your ability to interpret and communicate complex statistical findings clearly and concisely. Practice presenting your analyses in a way that is both statistically sound and accessible to a non-technical audience.
- Political Theory and Concepts: Connect your methodological understanding to relevant political theories and concepts. Demonstrate a strong grasp of how methodology informs and shapes our understanding of political phenomena.
Next Steps
Mastering Political Methodology opens doors to exciting careers in academia, research institutions, think tanks, and government agencies. A strong understanding of these techniques is highly valued across the political science field. To enhance your job prospects, create an ATS-friendly resume that effectively highlights your skills and experience. We strongly recommend using ResumeGemini, a trusted resource, to build a professional and impactful resume. ResumeGemini provides examples of resumes tailored to Political Methodology, ensuring your application stands out.
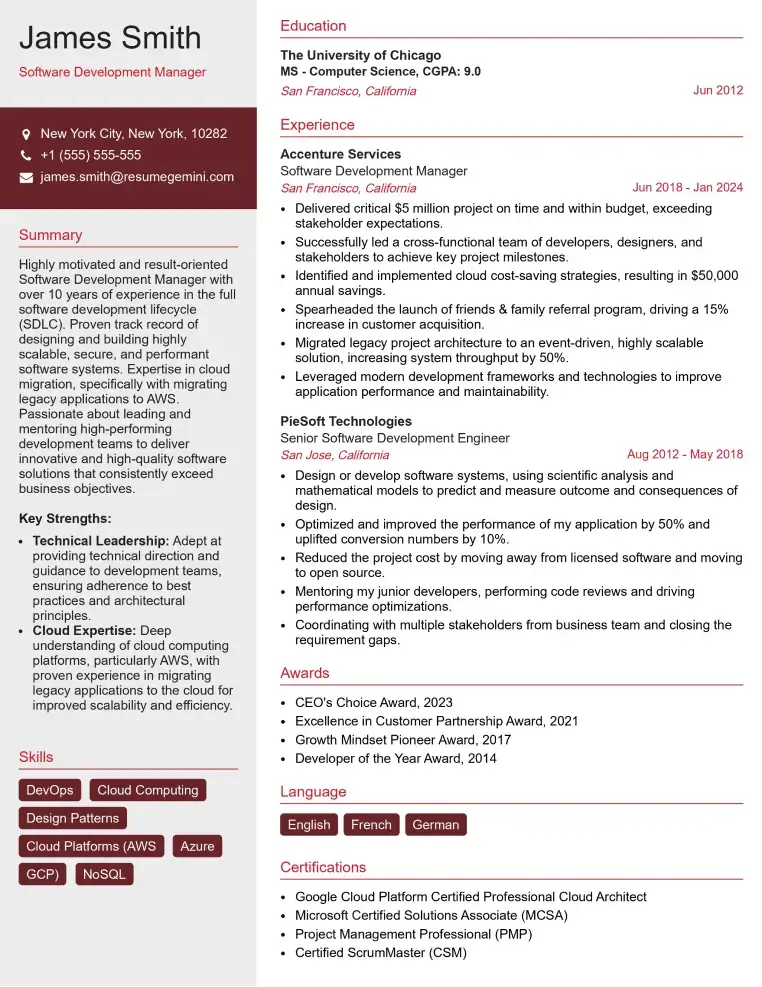
Check Out Resume Samples at ResumeGemini

Check Out Resume Samples at ResumeGemini

Check Out Resume Samples at ResumeGemini

Check Out Resume Samples at ResumeGemini

Check Out Resume Samples at ResumeGemini
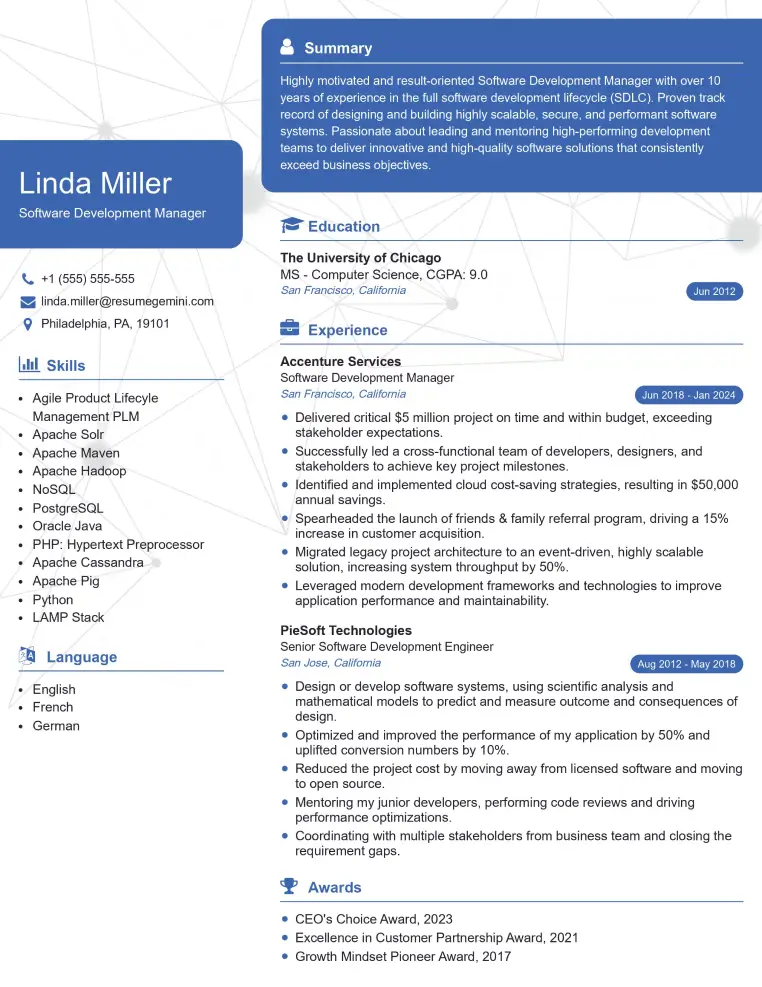
Check Out Resume Samples at ResumeGemini

Check Out Resume Samples at ResumeGemini
Explore more articles
Users Rating of Our Blogs
Share Your Experience
We value your feedback! Please rate our content and share your thoughts (optional).
What Readers Say About Our Blog
To the interviewgemini.com Webmaster.
Very helpful and content specific questions to help prepare me for my interview!
Thank you
To the interviewgemini.com Webmaster.
This was kind of a unique content I found around the specialized skills. Very helpful questions and good detailed answers.
Very Helpful blog, thank you Interviewgemini team.