Interviews are opportunities to demonstrate your expertise, and this guide is here to help you shine. Explore the essential Soil Mapping and GIS interview questions that employers frequently ask, paired with strategies for crafting responses that set you apart from the competition.
Questions Asked in Soil Mapping and GIS Interview
Q 1. Explain the different types of soil maps and their applications.
Soil maps are visual representations of soil properties across a geographic area. Different types cater to various needs and scales. For instance, a general soil map provides a broad overview of major soil types, often at a regional scale, useful for land-use planning and agricultural assessments. Think of it like a simplified map highlighting major landforms – mountains, plains etc. A more detailed detailed soil map, on the other hand, provides information on soil horizons, properties like texture, drainage, and limitations. This is analogous to a high-resolution map showcasing individual buildings within a city. Special-purpose soil maps focus on specific soil characteristics relevant to a particular application, such as salinity, erosion potential, or suitability for specific crops. This could be like a map highlighting only areas with high risk of flooding.
- Applications: General soil maps are used for regional planning, while detailed maps are crucial for site-specific land management decisions (like choosing optimal crops or construction methods). Special-purpose maps inform specific management practices to mitigate environmental concerns or maximize productivity.
Q 2. Describe the process of soil surveying and sampling.
Soil surveying and sampling is a systematic process of collecting and analyzing soil data. It begins with pedological surveys, which involve field observations and the collection of soil profiles (pits dug to observe different soil layers or horizons). This is like taking a detailed inventory of the soil’s composition. These observations are used to delineate soil mapping units, representing areas with similar soil properties. We then utilize this information to develop a sampling strategy. This often involves selecting locations within each mapping unit, representing diverse soil conditions.
Sampling methods vary, but generally, samples are collected at specific depths within the soil profile, often using augers or hand tools. This carefully collected soil undergoes laboratory analysis to determine various properties such as texture (sand, silt, clay content), pH, organic matter content, and nutrient levels. The results of this analysis are then combined with the field observations to create the soil map.
For example, in a vineyard assessment, samples are taken to determine potassium and other nutrients vital for grape production. This helps to optimize fertilizer application strategies.
Q 3. What are the key components of a GIS database for soil mapping?
A GIS database for soil mapping requires several key components to be effective. First, we need spatial data, including the location of soil sampling points and the boundaries of soil mapping units. This is often stored as vector data (points, lines, and polygons). Then we have attribute data describing soil properties at each point. This includes parameters such as soil texture, pH, organic matter, and nutrient levels. This data is linked to the spatial location. It’s also important to store metadata that explains the data, its source, accuracy and quality. For example, this explains the methods used for sampling and analysis. Finally, a good system incorporates raster data, such as elevation and imagery. These data layers can aid in interpreting soil patterns and improving map accuracy.
Think of it as a comprehensive filing system: the spatial data is like the map of the filing cabinet, the attributes are the documents filed inside, and metadata is the label on each file.
Q 4. How do you handle spatial data uncertainty in soil mapping?
Spatial data uncertainty is inherent in soil mapping, primarily due to the variability of soil properties and the limitations of sampling methods. We address this using several approaches. Probabilistic methods assign probabilities to soil properties based on the inherent uncertainty. For example, instead of saying ‘this area is clay loam’, we might state ‘there is a 70% probability this area is clay loam and a 30% probability it’s silty clay loam’. This allows for a more realistic representation of the soil’s variability.
Geostatistics employs mathematical models to interpolate soil properties between sampling points, incorporating spatial autocorrelation (nearby locations tend to have more similar soil properties). This is like creating a smooth surface rather than a scattered plot of points.
Error propagation involves quantifying uncertainty at each step of the mapping process. We assess the error associated with sampling, laboratory analysis, and GIS processing. This allows for a comprehensive understanding of the overall accuracy of the soil map.
Q 5. Explain the difference between raster and vector data in GIS.
In GIS, raster and vector data represent spatial information differently. Raster data stores information as a grid of cells, each cell having a value representing a property (e.g., elevation, land cover). Think of it like a pixelated image, where each pixel contains a single value. Vector data represents geographic features as points, lines, or polygons with associated attributes (e.g., location of a well, a river, or a farm). Think of it as precise geometric shapes.
For example, a digital elevation model (DEM) is raster data, while the boundaries of soil mapping units are vector data. Often, both types are used in soil mapping workflows; raster data for continuous variables, vector data for discrete features.
Q 6. What are the common spatial analysis techniques used in soil mapping?
Numerous spatial analysis techniques are used in soil mapping to uncover patterns and relationships in soil data. Interpolation methods (like kriging and inverse distance weighting) estimate soil properties in unsampled locations. This is vital for creating continuous surfaces from point samples. Classification techniques group similar soil units based on their properties (e.g., using supervised classification with training data or unsupervised clustering methods). Spatial autocorrelation analysis assesses the degree to which nearby soil properties are correlated. This can help to delineate soil boundaries and identify trends.
For instance, we might use interpolation to create a continuous map of soil pH across a field. Spatial autocorrelation analysis can reveal clustering of areas with high or low pH values. Classification allows grouping of similar soil types based on the interpolated pH and other soil parameters.
Q 7. How do you incorporate remote sensing data into soil mapping workflows?
Remote sensing data, such as multispectral imagery from satellites or aerial photography, provides valuable information for soil mapping. Spectral signatures (the reflectance of different wavelengths of light) can be related to soil properties like organic matter content, moisture, and texture. For example, areas with high vegetation density often indicate high organic matter content in the soil. We can use this to guide sampling and improve the accuracy of the map.
Image classification techniques can be used to identify different soil types based on spectral characteristics. Image regression models can be developed to predict soil properties from spectral values. Often, remote sensing data is integrated with other data sources in a data fusion approach to enhance mapping accuracy. This combined approach provides a robust and accurate soil map useful for agricultural management, environmental monitoring and other applications.
Q 8. Describe your experience with geostatistical analysis for soil properties.
Geostatistical analysis is crucial for understanding the spatial variability of soil properties. It allows us to move beyond point measurements to create continuous surface maps that predict soil properties across an area. My experience involves using various techniques like kriging (ordinary, universal, and indicator), co-kriging, and inverse distance weighting (IDW). I’ve used these methods extensively in projects involving the prediction of soil organic matter, nutrient content, and pH levels. For example, in a recent project assessing the impact of agricultural practices on soil health, I used ordinary kriging to interpolate soil organic carbon data from point samples collected across a farm. The resulting map clearly visualized areas with high and low organic carbon, enabling targeted interventions to improve soil health. The selection of the appropriate geostatistical method depends heavily on the data’s characteristics (e.g., spatial autocorrelation, data distribution) and the research question.
I also have experience evaluating the accuracy of these predictions using techniques like cross-validation and leave-one-out cross-validation. This ensures the reliability of the resulting soil property maps and their applicability to decision-making processes. The choice of validation method influences how confident we can be in the generated soil property map’s accuracy, informing management decisions about fertilizer application or land-use planning.
Q 9. Explain the concept of soil texture and its importance in mapping.
Soil texture refers to the relative proportions of sand, silt, and clay particles in a soil sample. It’s a fundamental soil property because it directly influences many other critical aspects like water holding capacity, drainage, aeration, and nutrient availability. Imagine a sponge – a clay-rich soil is like a very absorbent sponge, holding lots of water, while a sandy soil is like a coarse sponge, letting water drain quickly. This has profound implications for plant growth and overall soil health.
In soil mapping, texture is crucial because it helps differentiate soil types and predict their behavior. For instance, knowledge of soil texture is essential for selecting appropriate crops or managing irrigation strategies. We often use soil textural triangles, which are graphical representations that classify soil texture based on the percentages of sand, silt, and clay, to visualize and interpret this data in GIS.
Q 10. What are the different methods for soil classification?
Several methods exist for soil classification, each with its strengths and weaknesses. The most widely used system globally is the USDA Soil Taxonomy, which categorizes soils based on a hierarchical system of characteristics like soil horizons, texture, structure, and drainage. It provides a comprehensive understanding of soil properties and their limitations. Other prominent systems include the World Reference Base for Soil Resources (WRB), which focuses on soil functions and their suitability for various land uses, and the Canadian System of Soil Classification (CSSC), tailored to Canadian soils and environments.
The choice of classification method often depends on the specific application. For example, a large-scale national soil survey might use a system like WRB for consistency and international comparability, while a local-scale project focusing on agricultural land management could opt for the USDA Soil Taxonomy or a more regionally specific system for increased detail and relevance.
Q 11. How do you manage and analyze large soil datasets using GIS software?
Managing and analyzing large soil datasets within GIS software requires a structured approach. Initially, I focus on data organization and preprocessing, ensuring data quality and consistency. This often involves cleaning, transforming, and converting datasets into compatible formats (e.g., shapefiles, rasters, geodatabases). I use geoprocessing tools to efficiently handle large datasets, employing techniques such as spatial queries, overlays, and raster calculations to analyze spatial relationships and extract meaningful information. For example, I might use zonal statistics to determine average soil properties within specific land-use zones or perform spatial joins to combine soil data with other environmental datasets.
Databases are utilized to manage and store the data efficiently, often using relational databases to ensure data integrity and facilitate complex queries. Parallel processing techniques or cloud computing can be leveraged to address computational challenges posed by extensive datasets. The choice of tools and methods is guided by the project’s scope, data volume, and computational resources.
Q 12. Describe your experience with specific GIS software (e.g., ArcGIS, QGIS).
I have extensive experience with both ArcGIS and QGIS. ArcGIS provides a comprehensive suite of tools for advanced spatial analysis and data management, especially beneficial for large-scale projects and complex workflows. I’ve used its geoprocessing tools extensively for tasks ranging from creating soil maps to performing sophisticated spatial statistics. For example, the Spatial Analyst extension in ArcGIS is invaluable for raster-based analyses.
QGIS, on the other hand, is an open-source alternative offering similar capabilities with a strong emphasis on community support and extensibility through plugins. I’ve used QGIS for projects where cost-effectiveness and flexibility are paramount, and its open-source nature allows for customization and integration with other open-source tools. Both platforms are powerful tools; the choice often depends on the project’s budget, software licensing requirements, and the specific analytical needs.
Q 13. Explain your understanding of soil erosion and its representation in GIS.
Soil erosion is the detachment and movement of soil particles by wind or water. It’s a significant environmental problem, leading to land degradation, reduced soil fertility, water pollution, and habitat loss. In GIS, soil erosion can be represented using various methods, including creating maps of erosion risk using factors like slope, rainfall intensity, and soil type. We often use digital elevation models (DEMs) to calculate slope and aspect, which are then combined with soil properties and rainfall data through modeling techniques like the Universal Soil Loss Equation (USLE) or its revised version (RUSLE). The resulting erosion risk maps help identify areas prone to erosion and guide the implementation of conservation measures.
Furthermore, GIS can be used to monitor erosion over time using remote sensing data, such as aerial photography or satellite imagery. By comparing images from different time periods, we can observe changes in land cover and identify areas experiencing significant erosion. This approach helps assess the effectiveness of conservation measures and enables targeted interventions.
Q 14. How do you ensure the accuracy and reliability of soil map data?
Ensuring the accuracy and reliability of soil map data involves a multi-faceted approach starting with careful planning and execution of fieldwork. This involves using appropriate sampling strategies (e.g., grid sampling, stratified random sampling) to accurately represent the spatial variability of soil properties. Accurate field measurements and laboratory analysis are essential to create a reliable dataset. Quality control and quality assurance (QC/QA) procedures at every stage, from data collection to map production, are critical. This includes regular checks for data errors and outliers, utilizing appropriate geostatistical methods and evaluating model accuracy using techniques like cross-validation.
Furthermore, incorporating existing soil survey data and integrating information from other sources like remote sensing can improve map accuracy. The use of appropriate validation methods and uncertainty assessment are vital to provide a reliable measure of the accuracy of generated soil maps. Regular updates and revisions of soil maps based on new data and evolving scientific knowledge are also important to maintain data relevance and reliability. Finally, clear documentation of methodology and data sources builds transparency and confidence in the quality of the soil map data.
Q 15. What are the challenges in integrating different soil datasets?
Integrating different soil datasets presents several significant challenges. The primary hurdle is data heterogeneity. This means datasets often vary in their spatial resolution (scale of the data), the attributes measured (e.g., some might focus on organic matter, others on texture), the methods used for data collection (e.g., laboratory analysis versus remote sensing), and the coordinate systems and projections employed. Imagine trying to fit together a jigsaw puzzle where the pieces are different sizes and shapes, and some pieces are missing!
Another key challenge is data inconsistencies. Even when datasets seem compatible on the surface, discrepancies can arise due to different sampling strategies, analytical techniques, or even human error in data entry. These inconsistencies can lead to inaccuracies and biases in any analysis or mapping.
Finally, data availability itself can be a problem. Many areas lack detailed soil information, creating gaps in coverage. Often, we have to deal with the challenges of integrating datasets from different sources with different levels of quality control and metadata. A systematic approach, utilizing data quality assessment and rigorous data preprocessing techniques is crucial to overcome these challenges.
Career Expert Tips:
- Ace those interviews! Prepare effectively by reviewing the Top 50 Most Common Interview Questions on ResumeGemini.
- Navigate your job search with confidence! Explore a wide range of Career Tips on ResumeGemini. Learn about common challenges and recommendations to overcome them.
- Craft the perfect resume! Master the Art of Resume Writing with ResumeGemini’s guide. Showcase your unique qualifications and achievements effectively.
- Don’t miss out on holiday savings! Build your dream resume with ResumeGemini’s ATS optimized templates.
Q 16. Describe your experience with creating thematic maps from soil data.
I have extensive experience creating thematic maps from soil data using GIS software such as ArcGIS and QGIS. My work frequently involves visualizing soil properties like texture, organic matter content, pH, and nutrient levels. For instance, in a recent project assessing agricultural land suitability, I created maps showing the spatial distribution of soil types classified according to their suitability for different crops. This involved processing and classifying soil survey data, creating polygon features representing different soil units, and assigning attributes to these features based on their properties. The final map was visually appealing and provided valuable information for farmers and land-use planners.
Another project focused on visualizing erosion risk. Using a digital elevation model (DEM), soil data, and rainfall data, I generated a map showing areas with high erosion potential. This helped to target conservation efforts effectively. I often use various symbology techniques, including graduated colors, unique values, and proportional symbols to communicate the spatial variation effectively. The choice of symbology depends on the type of data being mapped and the message to be conveyed.
Q 17. How do you address data inconsistencies in soil mapping projects?
Addressing data inconsistencies is a crucial part of any successful soil mapping project. My approach involves a multi-step process. First, I thoroughly inspect the data for obvious errors, such as outliers or unrealistic values. Visualization techniques like histograms and scatter plots are helpful in identifying these issues.
Next, I conduct a data quality assessment. This evaluates the accuracy, precision, completeness, and consistency of the data based on available metadata and field knowledge. Are there documented biases in the sampling procedures? This assessment helps determine the level of trust we can place in different aspects of the dataset.
Following this, data cleaning and preprocessing techniques are employed. This might include using statistical methods to smooth out outliers, using interpolation to fill in gaps in the data, or using data transformation to bring various datasets into a consistent format (e.g., converting different units of measurement).
Finally, I document all data processing steps and justify any decisions made in addressing inconsistencies. This transparency ensures the reproducibility and reliability of the results.
Q 18. What are the ethical considerations in soil mapping and data management?
Ethical considerations in soil mapping and data management are paramount. Data ownership and access are key issues. Soil data is often collected using public funds, raising questions about who owns the data and how it should be shared. Open access principles are becoming increasingly important, but ensuring data security and protecting sensitive information is equally vital.
Data accuracy and transparency are crucial for ensuring the integrity of soil mapping projects. It’s crucial to acknowledge limitations and uncertainties in the data, and to clearly document the methods used to collect and process it. Misrepresentation or selective reporting of results is unethical.
Indigenous knowledge and the rights of local communities should also be considered. Traditional ecological knowledge about soil conditions can be invaluable, and it’s essential to engage with local communities and obtain informed consent when using their land or data. Finally, the potential environmental and social impacts of soil mapping projects (e.g., the effects on land use planning) should be carefully considered.
Q 19. How do you communicate complex soil information to non-technical audiences?
Communicating complex soil information to non-technical audiences requires careful consideration of the audience’s knowledge and interests. I avoid using technical jargon whenever possible, and instead rely on clear, concise language and visuals.
Analogies and metaphors are very effective. For example, I might describe soil texture using comparisons to familiar materials: “This soil is like fine sand, easily compacted.” Visual aids like maps, charts, and diagrams are essential; a well-designed map is worth a thousand words.
Storytelling can make complex information more engaging. I might describe the impact of soil degradation on a specific community or the benefits of soil conservation practices. Interactive elements, such as online quizzes or demonstrations, can also improve knowledge retention and engagement.
Q 20. Explain your experience with project management in soil mapping projects.
My experience in project management for soil mapping projects involves a structured, iterative approach. I start with clear project definition, outlining goals, deliverables, and timelines. This typically involves consultations with stakeholders to define the project scope and ensure their needs are met. A detailed work plan is developed, outlining tasks, responsibilities, and deadlines. Regular progress meetings and communication are crucial for monitoring progress, identifying potential issues, and making necessary adjustments.
Resource management is also key – this includes managing budgets, personnel, and equipment. I always strive to select appropriate technologies and methodologies, considering factors like data availability, project scale, and budget constraints. Quality control is integrated throughout the project lifecycle, ensuring data accuracy and the overall quality of the deliverables. Finally, a comprehensive report documenting the entire project, including methods, results, and conclusions, is essential.
Q 21. What are the different types of spatial interpolation techniques?
Spatial interpolation techniques estimate values at unsampled locations based on known values at sampled locations. Several techniques exist, each with its strengths and weaknesses.
- Inverse Distance Weighting (IDW): This simple method assumes that the value at an unsampled location is a weighted average of the values at nearby sampled locations. The weights decrease with distance; closer points have a greater influence.
- Kriging: A geostatistical method that considers spatial autocorrelation (the degree to which values at nearby locations are correlated). It provides not only interpolated values but also estimates of uncertainty associated with the interpolation.
- Spline interpolation: Creates a smooth surface that passes through or near the known data points. Different types of splines (e.g., thin-plate splines) exist, each with different properties.
- Nearest Neighbor: The simplest method, it assigns the value of the nearest sampled location to the unsampled location. This is very simple but can produce a rather blocky, discontinuous surface.
The choice of technique depends on factors like the spatial distribution of the data, the nature of the variable being interpolated, and the desired level of accuracy and smoothness. For example, Kriging is often preferred when spatial autocorrelation is high and precise estimates of uncertainty are needed, while IDW might be suitable for simpler applications where computational efficiency is important.
Q 22. How do you use GIS to support precision agriculture practices?
GIS is an indispensable tool in precision agriculture, allowing for site-specific management of crops based on detailed soil information. We leverage GIS to overlay various datasets, creating a comprehensive picture of the field. For example, we can combine soil maps showing variations in texture, organic matter content, and pH with yield maps from previous harvests and imagery from drones or satellites. This integrated approach enables the identification of zones within a field exhibiting similar characteristics. Then, using this spatial data, we can prescribe variable rate application of fertilizers, pesticides, and irrigation, optimizing resource use and maximizing yield while minimizing environmental impact. Imagine a field with patches of sandy soil and patches of clay. A GIS-based analysis would show this variation, allowing a farmer to apply more fertilizer to the sandy areas which have lower nutrient retention, while reducing inputs in the clay areas, which have higher nutrient retention.
Further, GIS helps in monitoring and evaluating the effectiveness of these precision agriculture practices. By tracking changes in yield and soil health over time, we can fine-tune management strategies for even greater efficiency and sustainability. This process involves georeferencing all data, allowing for precise comparisons across years and management practices. For example, if we observe that a specific zone has consistently lower yields despite precision fertilizer application, GIS helps to pinpoint other influencing factors such as water availability or pest infestations.
Q 23. Explain your understanding of soil-water interactions and its relevance to mapping.
Soil-water interactions are fundamental to understanding soil properties and their spatial variability. Water availability significantly affects nutrient availability, plant growth, and overall soil health. For example, the water holding capacity of a soil – its ability to retain water – is directly related to the soil texture and structure. Sandy soils have low water holding capacity, while clay soils have high water holding capacity. This knowledge influences how we interpret soil maps. A soil map may show areas with predominantly sandy soils; we can then predict lower water availability in those areas and recommend appropriate irrigation strategies, or select crops better suited to drier conditions.
Mapping soil-water interactions often involves using techniques such as electrical resistivity tomography (ERT) or time-domain reflectometry (TDR) to measure soil moisture content. This spatial data is then integrated with other soil data within a GIS environment to create thematic maps showcasing water availability across the study area. The relevance to mapping is crucial because it allows us to move beyond simply classifying soil types to predicting their hydrological behavior. This is critical for things like predicting runoff, erosion potential, and drainage planning, all vital considerations in land management and agricultural planning.
Q 24. Describe your experience with creating and maintaining soil databases.
My experience includes designing, populating, and maintaining extensive soil databases, often involving hundreds of soil samples and thousands of analytical results. I’ve utilized relational database management systems (RDBMS) like PostgreSQL and PostGIS to store and manage these spatial datasets. This involves not just storing the analytical results (e.g., pH, organic matter, texture) but also georeferencing data through coordinates or linking it to existing GIS layers (e.g., aerial photography, topography).
Data quality control is paramount. This involves implementing rigorous checks for data accuracy and consistency, flagging outliers and errors for correction or investigation. Database maintenance involves regularly updating the database with new data, ensuring that the information remains current and relevant. Furthermore, metadata management is crucial; properly documenting data sources, collection methods, and analytical techniques is essential to maintain data integrity and facilitate reuse.
One project involved creating a soil database for a large agricultural region, incorporating data from various sources, including historical soil surveys, laboratory analysis of soil samples, and remote sensing data. This database served as the foundation for several projects, including precision agriculture applications, environmental impact assessments, and land-use planning.
Q 25. How do you validate the accuracy of soil maps using field data?
Validating soil maps using field data is crucial to ensure their accuracy and reliability. This usually involves a systematic process of collecting soil samples at strategically selected locations across the mapped area. The number and location of these sample points depend on the scale and complexity of the map. For instance, a larger-scale map requires more sample points to adequately represent the soil variability. Sample locations are often determined using a stratified random sampling design to represent the various soil units identified on the map.
Once the samples are collected and analyzed in a laboratory, the results are compared to the soil map predictions for those locations. Statistical methods, such as error matrices and Kappa statistics, are used to quantify the agreement between the map and field data. Discrepancies may highlight areas where the map needs revision or where further investigation is required. For example, if the field data shows a significantly different soil type than what is predicted by the map in a specific area, it may indicate that the initial soil survey or classification was inaccurate, highlighting the need to refine the soil boundaries on the map.
This validation process is iterative. Initial comparisons often reveal areas that require further investigation and potentially recalibration of the initial soil map. This feedback loop ensures that the final soil map is a robust and reliable representation of the soil conditions within the area.
Q 26. What are some limitations of using GIS for soil mapping?
While GIS is a powerful tool, there are limitations to consider when using it for soil mapping. One key limitation is the inherent scale-dependency of soil data. Detailed soil maps at a fine scale (e.g., 1:10,000) require extensive field sampling and analysis, which can be expensive and time-consuming. Larger-scale maps often rely on interpolation and extrapolation of limited data points, which can lead to inaccuracies, particularly in areas with high soil variability.
Another limitation is the difficulty in capturing the three-dimensional nature of soil. Soil maps typically represent the surface soil layer, neglecting the variations in soil properties with depth. While techniques like 3D modeling are being developed, they often require significant amounts of data that may not be readily available. Furthermore, the accuracy of GIS-based soil mapping is heavily reliant on the quality and availability of input data. Errors or biases in the input datasets (e.g., elevation data, remote sensing imagery) will propagate into the final soil map, affecting its reliability. This limitation underscores the crucial role of data quality control in soil mapping.
Q 27. How do you stay up-to-date with the latest advancements in soil mapping and GIS?
Staying up-to-date in the rapidly evolving fields of soil mapping and GIS involves a multi-pronged approach. I actively participate in professional organizations like the Soil Science Society of America (SSSA) and the Association for Geographic Information (AGI), attending conferences, workshops, and webinars to learn about the newest methodologies and technologies. These events provide opportunities to network with colleagues and learn from experts in the field.
I regularly read peer-reviewed scientific journals and industry publications, focusing on articles related to advancements in soil science, GIS techniques, remote sensing applications, and data analysis methods. This keeps me abreast of the latest research findings and technological innovations. Furthermore, I utilize online resources such as open-source GIS software communities and online courses to enhance my technical skills and learn about new tools and techniques. Finally, I actively engage in collaborative projects with other professionals, leveraging their expertise to learn from diverse perspectives and applications. This continuous learning process is vital to maintain proficiency and adapt to the constantly evolving technological landscape.
Key Topics to Learn for Soil Mapping and GIS Interview
- Soil Classification Systems: Understand the principles behind different soil classification systems (e.g., USDA, World Reference Base) and their applications in mapping.
- Soil Survey Methods: Familiarize yourself with various soil survey techniques, including field observation, laboratory analysis, and remote sensing data interpretation.
- GIS Software and Tools: Gain proficiency in using common GIS software (e.g., ArcGIS, QGIS) for data manipulation, spatial analysis, and map creation. Practice creating thematic maps and conducting spatial analyses relevant to soil science.
- Spatial Data Handling: Master the concepts of spatial data structures (vector, raster), coordinate systems, projections, and georeferencing. Understand the implications of data accuracy and precision.
- Remote Sensing Applications: Learn how remote sensing data (e.g., satellite imagery, aerial photography) is used for soil mapping, including techniques like spectral analysis and image classification.
- Data Analysis and Interpretation: Develop skills in interpreting spatial patterns in soil properties and relating them to environmental factors. Be prepared to discuss statistical analysis relevant to soil data.
- Soil Mapping Accuracy and Uncertainty: Understand the sources of error and uncertainty in soil mapping and methods for quantifying and mitigating these uncertainties.
- Applications in Agriculture and Environmental Management: Be ready to discuss how soil mapping and GIS are used to address real-world problems, such as precision agriculture, land use planning, and environmental impact assessment.
- Data Management and Presentation: Practice organizing, managing, and presenting soil data and maps effectively, including clear and concise communication of findings.
Next Steps
Mastering Soil Mapping and GIS opens doors to a rewarding career in environmental science, agriculture, and resource management. These skills are highly sought after, leading to diverse and impactful roles. To significantly boost your job prospects, create an ATS-friendly resume that highlights your key skills and experiences. ResumeGemini is a trusted resource that can help you build a professional and effective resume tailored to your specific career goals. Examples of resumes tailored to Soil Mapping and GIS positions are available to help guide your resume development.
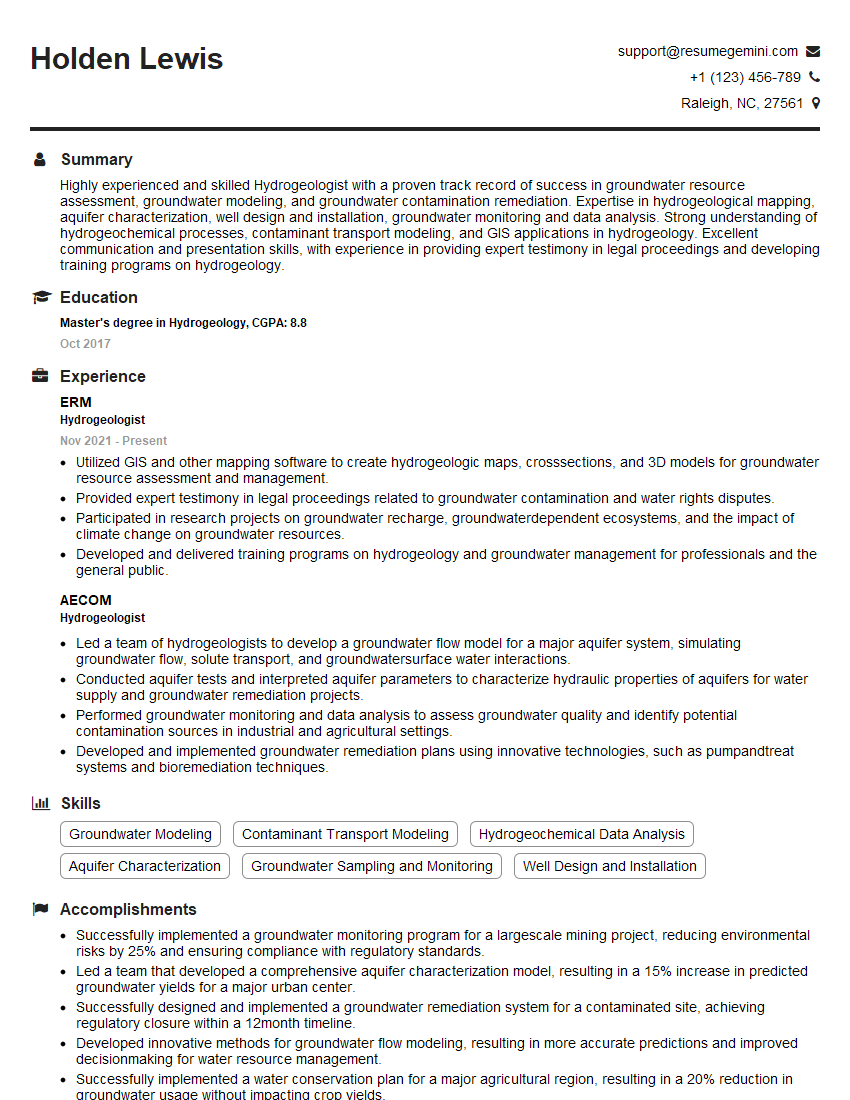
Hydrogeologist Resume Sample

Sustainability Consultant Resume Sample
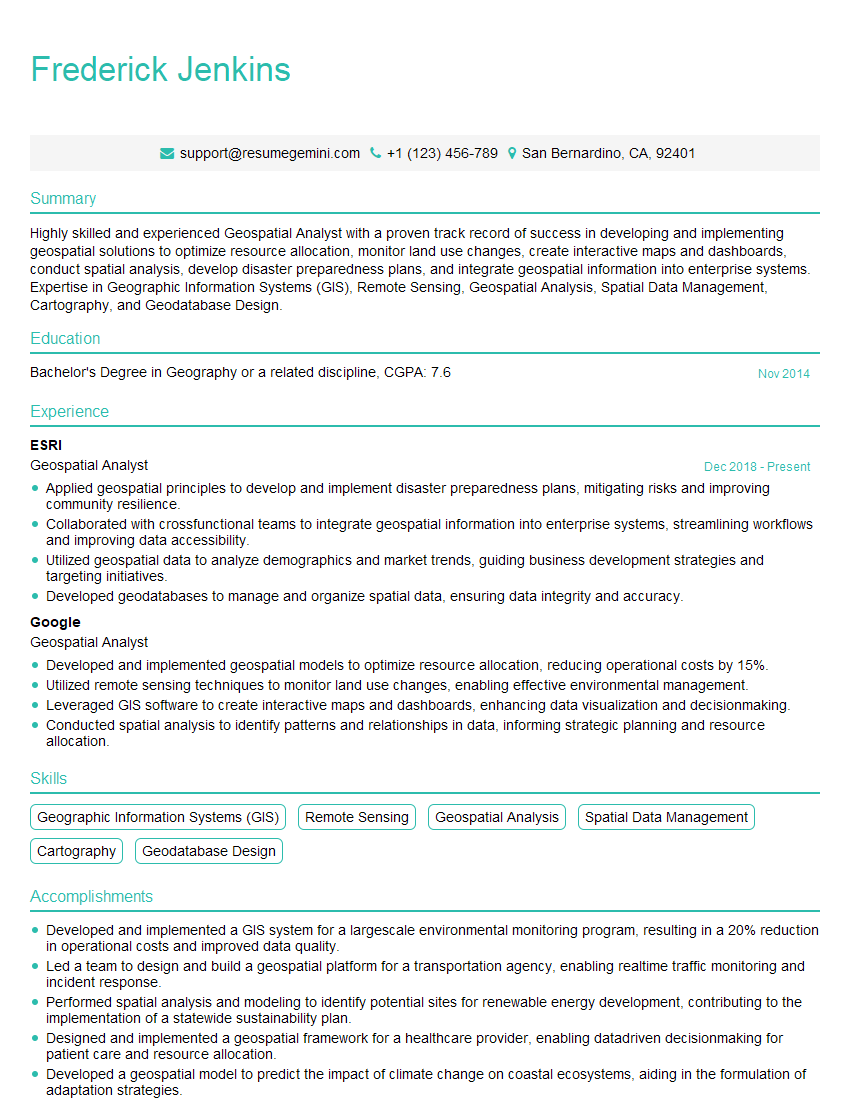
Geospatial Analyst Resume Sample

Cartographic Technician Resume Sample
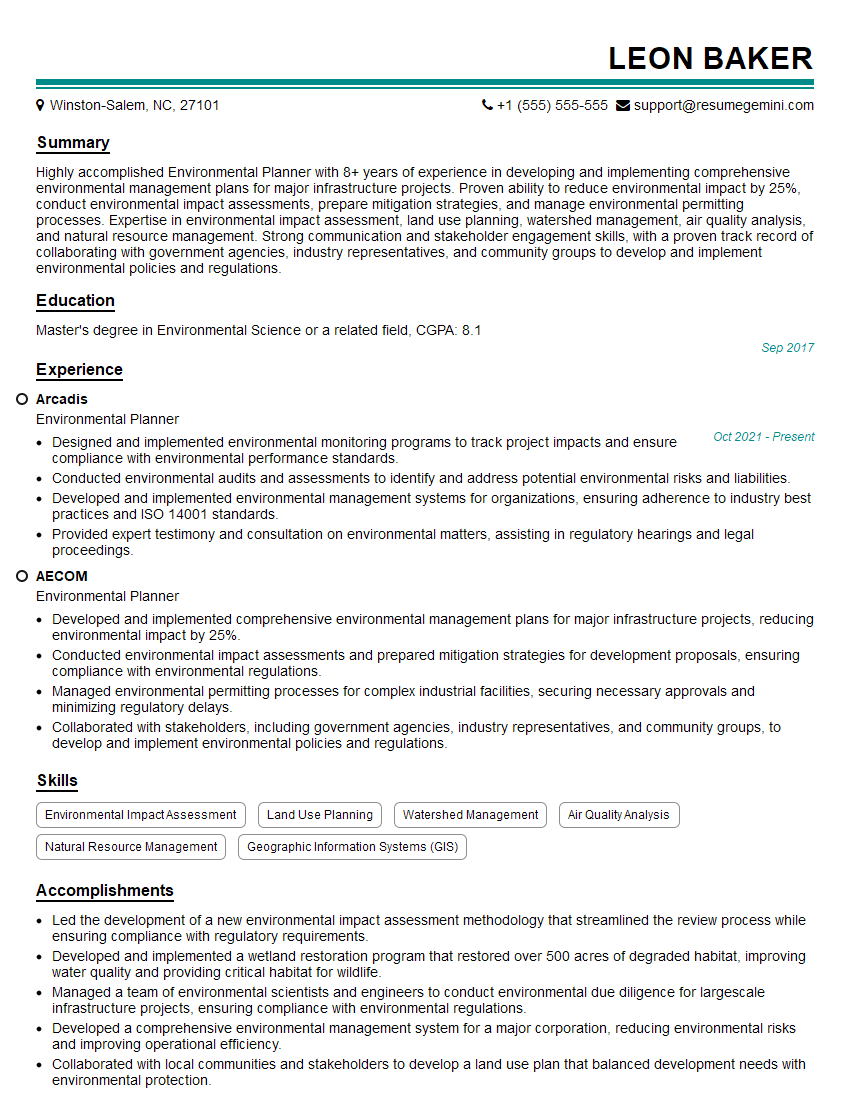
Environmental Planner Resume Sample

Geotechnical Engineer Resume Sample
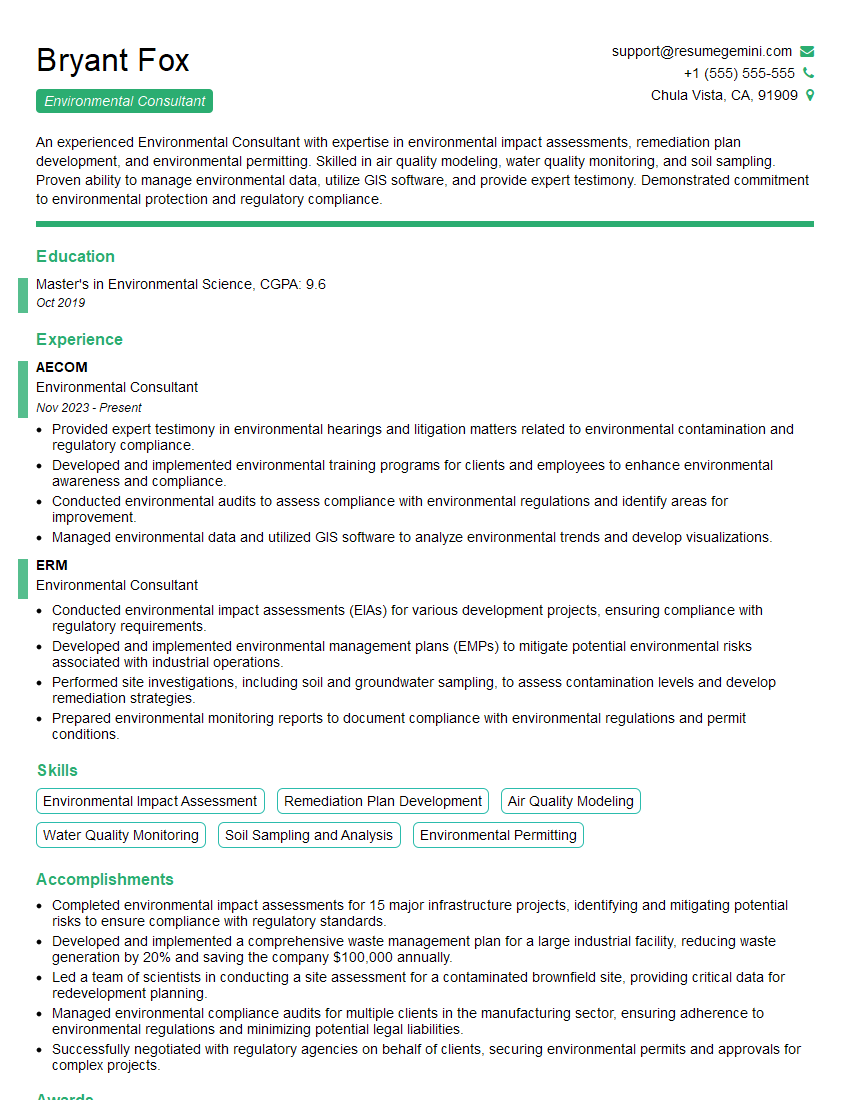
Environmental Consultant Resume Sample

Soil Scientist Resume Sample

Soil Conservationist Resume Sample

Land Use Planner Resume Sample
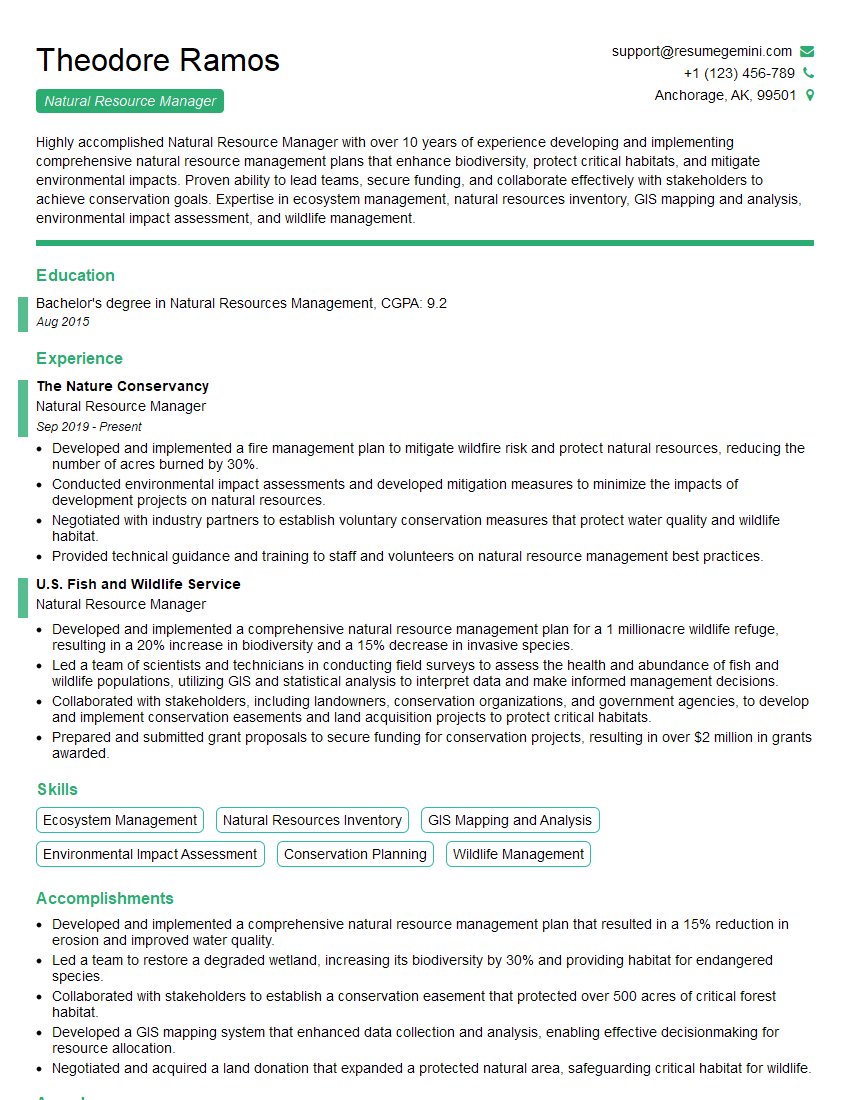
Natural Resource Manager Resume Sample
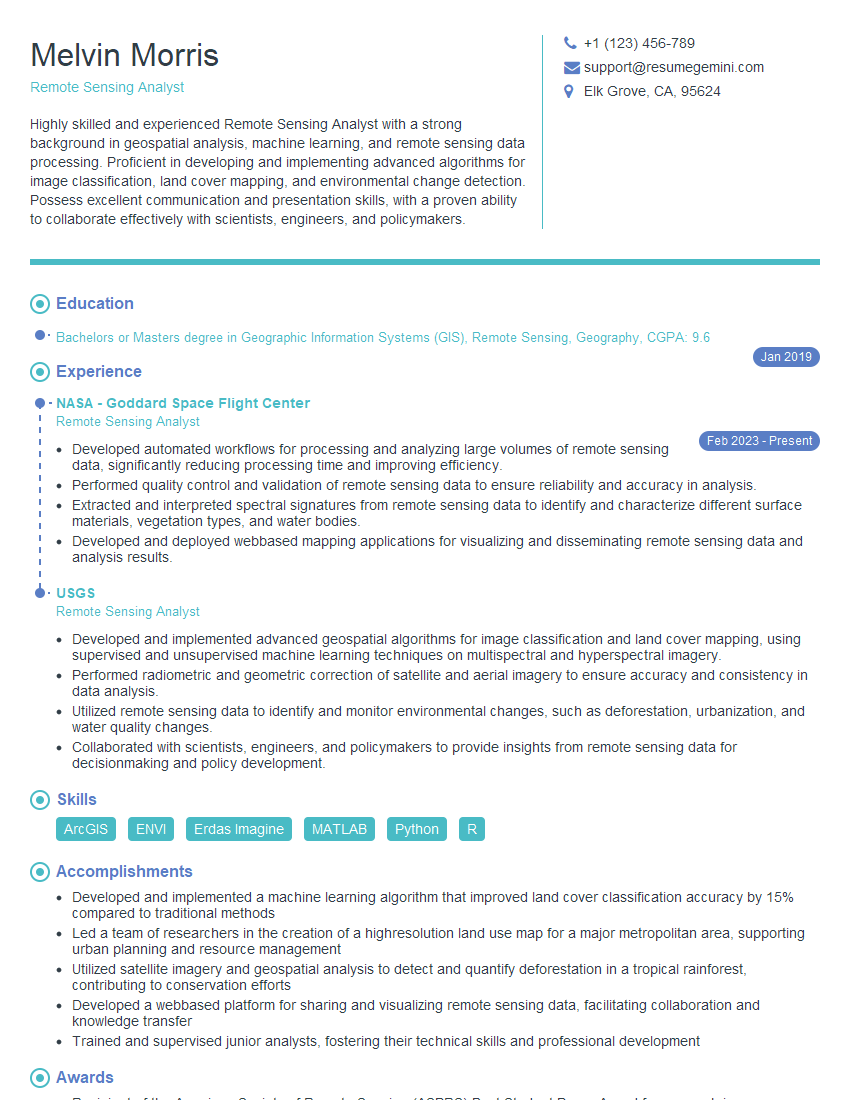
Remote Sensing Analyst Resume Sample

Remote Sensing Specialist Resume Sample

Precision Agriculture Specialist Resume Sample
- Hydrogeologist
- Sustainability Consultant
- Geospatial Analyst
- Cartographic Technician
- Environmental Planner
- Geotechnical Engineer
- Environmental Consultant
- Soil Scientist
- Soil Conservationist
- Land Use Planner
- Natural Resource Manager
- Remote Sensing Analyst
- Remote Sensing Specialist
- Precision Agriculture Specialist
Explore more articles
Users Rating of Our Blogs
Share Your Experience
We value your feedback! Please rate our content and share your thoughts (optional).
What Readers Say About Our Blog
To the interviewgemini.com Webmaster.
Very helpful and content specific questions to help prepare me for my interview!
Thank you
To the interviewgemini.com Webmaster.
This was kind of a unique content I found around the specialized skills. Very helpful questions and good detailed answers.
Very Helpful blog, thank you Interviewgemini team.