Are you ready to stand out in your next interview? Understanding and preparing for Transit Service Planning and Design interview questions is a game-changer. In this blog, we’ve compiled key questions and expert advice to help you showcase your skills with confidence and precision. Let’s get started on your journey to acing the interview.
Questions Asked in Transit Service Planning and Design Interview
Q 1. Explain the difference between transit-oriented development (TOD) and transit-supportive development.
While both Transit-Oriented Development (TOD) and Transit-Supportive Development (TSD) aim to improve the relationship between transit and land use, they differ in their scope and intensity. TOD is a much more concentrated and integrated approach, focusing on creating high-density, mixed-use development directly around transit stations. Think of it as a tightly packed, vibrant community built *around* the transit hub, where walking or cycling is prioritized. TSD, on the other hand, takes a broader perspective, encompassing developments that are supportive of transit but not necessarily immediately adjacent to stations. This could include developments along bus corridors or within a reasonable distance of rail lines, encouraging transit use but allowing for a wider range of densities and land uses.
Example: A TOD project might involve constructing high-rise residential buildings, shops, and offices directly above or within walking distance of a light rail station, creating a self-contained community. A TSD project might involve zoning changes along a bus route to encourage higher-density housing and commercial development, making it more convenient for residents to use the bus, but without the extreme concentration of TOD.
Q 2. Describe your experience with different transit modeling software (e.g., TransCAD, VISUM).
I have extensive experience using various transit modeling software packages, including TransCAD and VISUM. In my previous role, I used TransCAD extensively for network analysis, particularly for optimizing bus routes and evaluating the impact of service changes. Its ability to handle large datasets and perform complex simulations was invaluable. For instance, I used TransCAD to model the impact of adding a new bus rapid transit (BRT) line on overall network efficiency and ridership, considering factors such as travel times, transfer penalties, and headways. I also have experience with VISUM, which I found particularly useful for analyzing passenger demand and forecasting future ridership based on different development scenarios. Specifically, I utilized VISUM’s assignment models to predict traffic patterns and then used that information to refine transit network designs to minimize congestion and improve overall system performance. The choice between software often depends on the specific project needs and the availability of data.
Q 3. How do you assess the effectiveness of a transit network using key performance indicators (KPIs)?
Assessing transit network effectiveness requires a comprehensive approach using multiple Key Performance Indicators (KPIs). These KPIs can be broadly categorized into operational efficiency, service quality, and ridership performance.
- Operational Efficiency: Metrics such as vehicle kilometers traveled (VKT) per passenger, operating cost per passenger kilometer, and on-time performance directly reflect the efficiency of the transit system’s operations.
- Service Quality: KPIs like passenger waiting time, crowding levels (measured as load factors), accessibility (for people with disabilities), and headway (frequency of service) gauge the overall quality of the service provided.
- Ridership Performance: Boardings, alightings, ridership per capita, and ridership growth rates are crucial in evaluating the system’s attractiveness and success in meeting travel demand.
Analyzing these KPIs allows for identifying areas for improvement. For example, high operating costs per passenger kilometer might indicate a need for route optimization or operational cost reduction strategies. Low on-time performance suggests potential issues with traffic congestion or scheduling, which require further investigation and solutions.
Q 4. What are the common methods for forecasting transit ridership?
Forecasting transit ridership is a complex process, and the best method depends on data availability and project goals. Common methods include:
- Regression Analysis: This statistical technique relates past ridership data to influencing factors such as population growth, employment levels, income, and land use changes. A regression model can then be used to predict future ridership based on projected changes in these factors.
- Trip Generation Models: These models estimate the number of trips originating and ending in different zones within a study area. They can be used to project future trip generation based on land use and demographic forecasts and then distribute these trips across different modes, including transit.
- Transit Assignment Models: These models simulate how passengers choose their routes and modes based on factors like travel time, cost, and convenience. They are often used in conjunction with trip generation models to determine the expected ridership on specific transit routes.
- Agent-Based Modeling: This more advanced technique simulates the behavior of individual travelers and their interactions with the transit system. It provides insights into the dynamics of passenger flow and can be useful for evaluating the impact of changes to fares, schedules, or network configuration.
Often, a combination of these methods is employed to create a robust and reliable ridership forecast.
Q 5. How do you incorporate equity considerations into transit service planning?
Incorporating equity considerations into transit service planning is crucial for ensuring that the system serves all members of the community fairly. This involves identifying and addressing disparities in access, affordability, and quality of service experienced by different groups. This requires a multi-faceted approach:
- Accessibility Analysis: Analyzing transit accessibility for different demographic groups (e.g., low-income populations, seniors, individuals with disabilities) using GIS tools and other data sources to identify areas with limited access to transit.
- Fare Policy Review: Evaluating the affordability of transit fares for low-income individuals and exploring options such as fare subsidies or reduced fares for specific demographics.
- Service Prioritization: Prioritizing service improvements in underserved areas or for specific population groups to improve access and reduce disparities.
- Community Engagement: Actively involving community members from diverse backgrounds in the planning process to understand their needs and preferences and ensure that the system reflects the values and priorities of the entire community.
For example, we might use GIS to map the distance from bus stops to low-income housing and find that there is a significant disparity between access levels compared to more affluent areas. This would inform service planning decisions, such as introducing new routes or increasing frequency in those underserved areas.
Q 6. Explain your understanding of different transit service types (e.g., bus rapid transit, light rail, commuter rail).
Different transit service types offer varying levels of capacity, speed, and cost-effectiveness. Understanding their characteristics is critical for successful service planning:
- Bus Rapid Transit (BRT): Offers a high-capacity, cost-effective solution compared to rail. Key features include dedicated bus lanes, off-board fare collection, and signal priority at intersections. BRT systems can be implemented relatively quickly and easily, making them suitable for addressing immediate transportation needs in rapidly growing areas.
- Light Rail Transit (LRT): Provides higher capacity and speed than buses but requires a larger initial investment. LRT lines are typically more suitable for higher-density corridors with sustained ridership demands, offering a balance between flexibility and capacity. They are generally more environmentally friendly than buses and can be aesthetically pleasing, improving the quality of life in the surrounding areas.
- Commuter Rail: Best suited for long-distance travel, connecting suburban areas with major employment centers. High capacity and speed make them efficient for large passenger volumes, particularly during peak hours. However, they often have higher upfront costs and are less flexible in routing than buses or LRT.
The selection of the appropriate transit type is a critical decision, influenced by factors such as population density, travel demand, topography, and budget constraints. Often, a multimodal approach integrating different service types is the most efficient and effective solution.
Q 7. Describe your experience with Geographic Information Systems (GIS) in transit planning.
Geographic Information Systems (GIS) are indispensable in transit planning. GIS allows for the visualization and analysis of spatial data, providing a powerful tool for various tasks:
- Network Design: GIS enables the efficient design and analysis of transit networks, allowing planners to optimize route alignment, stop placement, and service frequencies based on spatial factors such as population density, land use, and road networks.
- Accessibility Analysis: GIS is crucial in assessing the accessibility of transit services to different population groups, identifying underserved areas, and evaluating the impact of service changes on accessibility. Tools such as isochrones (areas reachable within a specific travel time) are frequently used.
- Demand Forecasting: GIS can be used to integrate demographic and socioeconomic data with spatial information to support ridership forecasting models. This integration helps in creating more accurate and reliable projections.
- Community Engagement: GIS-based mapping tools can be used to engage the public in the planning process, allowing residents to visualize proposed transit routes and provide feedback.
In essence, GIS provides a centralized platform for managing, analyzing, and visualizing the vast amount of spatial data required for effective transit planning, enabling better informed decision-making.
Q 8. How do you analyze transit accessibility and identify underserved areas?
Analyzing transit accessibility involves understanding how easily people can reach transit stops and utilize the system to reach their destinations. We identify underserved areas by combining several data sources. This includes geographic data (census tracts, population density maps), demographic data (income levels, age groups, car ownership rates), and transit network data (stop locations, frequencies, travel times).
One common method is to calculate accessibility measures like isochrones, which show areas reachable within a certain travel time. Areas with large populations located far from transit stops or with limited service frequency will show up as having low accessibility. We can also use techniques like opportunity analysis, which looks at the number of jobs, services, or other opportunities accessible within a certain travel time by transit. Areas with significantly fewer opportunities reachable by transit than by car, for example, highlight significant underserved areas. Software tools like GIS (Geographic Information Systems) play a crucial role in visualizing and analyzing this data.
For instance, in a hypothetical city, if we find a low-income neighborhood with a high population density located far from major bus routes and with infrequent service, this would clearly indicate an underserved area requiring improved transit service.
Q 9. How would you approach optimizing a transit route network for efficiency and ridership?
Optimizing a transit route network is a complex task involving balancing efficiency and ridership. We typically employ a multi-step approach. First, we analyze existing ridership data to identify high-demand routes and low-performing routes. This often involves analyzing passenger counts, origin-destination data from smart cards, and even surveys to understand passenger preferences.
Next, we use route optimization software and simulation models to explore different scenarios. This might involve adjusting headways (the time between buses), rerouting existing lines to better serve high-demand areas, or even introducing new routes altogether. We consider factors like travel time, cost, and potential ridership increases. The goal is to create a network that minimizes travel times for the majority of passengers while maximizing overall ridership.
Finally, we assess the effectiveness of changes through post-implementation monitoring. We track ridership, travel times, and operating costs to identify areas for further improvement. For example, implementing a bus rapid transit system (BRT) with dedicated lanes and frequent service along a high-demand corridor could significantly improve both efficiency and ridership compared to a traditional bus network.
Q 10. Explain your understanding of different transit scheduling techniques.
Transit scheduling techniques aim to create efficient and reliable service while minimizing costs. Several techniques exist, each with its strengths and weaknesses.
- Fixed-Schedule: This is the most common method, with buses or trains operating on a predetermined schedule regardless of passenger demand. It’s simple to understand and plan but may lead to overcrowding during peak hours and underutilized vehicles during off-peak times.
- Headway-Based Scheduling: Instead of fixed departure times, vehicles run at regular intervals (headways). This offers greater flexibility and can adapt to varying demand, although accurate prediction of demand is crucial.
- Demand-Responsive Scheduling: This is used for areas with low demand where vehicles are dispatched based on real-time calls or bookings, creating a more flexible but potentially less efficient system in terms of vehicle utilization.
- Simulation-Based Optimization: Sophisticated software simulates various scheduling scenarios to find optimal solutions based on different objective functions (e.g., minimizing wait times, maximizing vehicle utilization). These often use advanced algorithms to optimize the scheduling.
The choice of scheduling technique depends on various factors including service area density, predicted ridership patterns, and the available technology and resources.
Q 11. What are some common challenges in transit planning and how would you address them?
Transit planning faces several challenges. Funding constraints are a major hurdle, often leading to difficult choices between service expansion and maintenance. Competition from private transportation options (cars, ride-sharing) constantly puts pressure on ridership. Increasing infrastructure costs for new rail lines and bus rapid transit corridors require careful planning and significant investment.
Addressing these challenges involves creative solutions. We can explore alternative funding sources, such as public-private partnerships or congestion pricing. Improving service quality, including comfort, reliability, and safety, can attract more riders. Integration with other modes of transport (bike-sharing, ride-sharing) can improve the overall accessibility and convenience of the transit system. Data-driven decision making, using analytics to understand ridership patterns and optimize resource allocation, is also critical.
For example, a city might tackle funding constraints by implementing a phased approach to expansion, focusing on high-demand corridors first and gradually expanding services based on available resources.
Q 12. How do you involve stakeholders in the transit planning process?
Stakeholder engagement is essential for successful transit planning. We employ a multi-faceted approach, including public forums, online surveys, focus groups, and meetings with representatives from various communities, businesses, and government agencies.
Early and continuous engagement helps build trust and ensures that the plan reflects the needs and concerns of the community. We use various methods to gather input, ensuring accessibility for all stakeholders, including those with limited access to technology or transportation. We actively seek feedback throughout the planning process, using iterative design cycles to incorporate input and refine the plan. Transparent communication is key, clearly explaining project timelines, budget allocations, and potential impacts on the community.
In one project, we organized a series of community workshops to gather input on proposed route changes. The workshops incorporated feedback mechanisms like interactive maps and facilitated discussions, resulting in a plan that better served the local community’s needs.
Q 13. Describe your experience with developing a transit service plan.
In a recent project for a medium-sized city, I led the development of a comprehensive transit service plan. The process started with an extensive assessment of the existing transit system, analyzing ridership data, travel times, and service coverage. We identified underserved areas and gaps in service. We then developed a series of scenarios for service improvements, including new routes, adjusted frequencies, and potential transit-oriented development opportunities.
We used simulation software to model the impact of each scenario on ridership, travel times, and operating costs. This allowed us to compare the cost-effectiveness of various options and identify the most promising approach. Throughout the process, we maintained close communication with stakeholders, conducting public forums and meetings to ensure transparency and gather valuable feedback. The final plan was presented to the city council and incorporated into the city’s overall transportation plan.
The result was a plan that improved service coverage for underserved communities, enhanced connectivity within the city, and optimized resource allocation. The project successfully balanced the needs of the community with the budgetary constraints of the city.
Q 14. How do you evaluate the cost-effectiveness of different transit options?
Evaluating the cost-effectiveness of different transit options requires a comprehensive approach, going beyond just initial capital costs. We use lifecycle cost analysis (LCCA) to compare different options considering factors like capital costs (infrastructure, vehicles), operating costs (fuel, maintenance, labor), and ridership.
We also consider intangible benefits, such as reduced traffic congestion, improved air quality, and increased accessibility. These benefits can be difficult to quantify but are significant in evaluating the overall value of a project. Cost-benefit analysis (CBA) is often used to compare the overall costs and benefits of different options and to determine which option offers the greatest net benefit to society.
For example, comparing a bus rapid transit system (BRT) to expanding a traditional bus network would involve comparing the higher initial capital cost of the BRT with its potential benefits of increased ridership, reduced travel times, and improved service reliability. The CBA would help determine which option provides the most efficient allocation of public funds.
Q 15. What are the key considerations in designing a bus rapid transit (BRT) system?
Designing a successful Bus Rapid Transit (BRT) system requires a holistic approach, considering various interconnected factors. It’s not just about buses; it’s about creating a complete, efficient, and attractive transit experience.
- Dedicated Right-of-Way: This is crucial for speed and reliability. Imagine a BRT lane separated from general traffic – this minimizes delays caused by congestion. Examples include bus-only lanes, center-running lanes (with median stations), or off-street corridors.
- High-Quality Stations: Stations need to be comfortable, accessible, and efficient. Think of them as mini-transit hubs with features like real-time information displays, shelters, level boarding (eliminating steps), and secure waiting areas. Well-designed stations encourage ridership.
- Frequent and Reliable Service: High-frequency service, meaning buses arriving often, is key to attracting riders. Predictable headways (the time between buses) build trust and encourage spontaneous use. Imagine waiting only 5 minutes for a bus instead of 20 – a huge difference!
- Pre-boarding Fare Collection: Collecting fares before passengers board speeds up the process, reducing dwell time at stations. Examples include off-board fare payment using smart cards or mobile apps.
- Transit Signal Priority (TSP): TSP uses technology to give BRT buses priority at intersections, minimizing signal delays and maintaining schedule adherence. Imagine a green light as a bus approaches – reducing wait times.
- Branding and Marketing: A strong visual identity and effective marketing campaigns are essential to build public awareness and attract riders. A recognizable brand builds trust and attracts new passengers.
- Integration with Other Modes: A successful BRT system often integrates seamlessly with other modes of transportation, such as walking, cycling, and other transit lines, creating a comprehensive network.
For example, Curitiba, Brazil, is often cited as a model for successful BRT implementation, demonstrating the importance of these design elements.
Career Expert Tips:
- Ace those interviews! Prepare effectively by reviewing the Top 50 Most Common Interview Questions on ResumeGemini.
- Navigate your job search with confidence! Explore a wide range of Career Tips on ResumeGemini. Learn about common challenges and recommendations to overcome them.
- Craft the perfect resume! Master the Art of Resume Writing with ResumeGemini’s guide. Showcase your unique qualifications and achievements effectively.
- Don’t miss out on holiday savings! Build your dream resume with ResumeGemini’s ATS optimized templates.
Q 16. How do you incorporate sustainability principles into transit planning?
Sustainability is paramount in modern transit planning. It’s about creating a system that is environmentally friendly, economically viable, and socially equitable.
- Reduced Carbon Emissions: Prioritizing public transit over private vehicles significantly reduces greenhouse gas emissions, contributing to a healthier environment. Electric buses, for instance, are a key component of this strategy.
- Energy Efficiency: Optimizing routes, utilizing efficient vehicles, and employing energy-saving technologies in stations all contribute to reduced energy consumption.
- Sustainable Materials: Using recycled and locally sourced materials in station construction and vehicle manufacturing minimizes environmental impact.
- Transit-Oriented Development (TOD): TOD encourages mixed-use development around transit stations, reducing reliance on cars and promoting walkability and bikeability. This minimizes urban sprawl and improves air quality.
- Community Engagement: Involving the community in planning processes ensures that the transit system meets the needs of residents and contributes to a more sustainable and equitable community.
For instance, incorporating green infrastructure like rooftop gardens on stations and using solar panels to power station lighting shows commitment to sustainability. Choosing electric buses also drastically reduces the carbon footprint of the transportation system.
Q 17. Explain your understanding of Level of Service (LOS) in transit planning.
Level of Service (LOS) in transit planning refers to the quality of service provided to transit users. It’s a qualitative measure reflecting factors impacting the user experience.
LOS is usually expressed on a scale (e.g., A to F, with A being the best and F the worst). Factors considered include:
- Headway: The time between consecutive vehicles. Shorter headways indicate better service.
- Wait Time: The time a passenger spends waiting for a vehicle.
- In-Vehicle Time: The time spent on the vehicle itself.
- Accessibility: Ease of access for all users, including elderly and disabled individuals.
- Comfort and Amenities: Features like seating, air conditioning, and cleanliness.
- Safety and Security: The feeling of security while using the transit system.
A high LOS (e.g., A or B) indicates excellent service, whereas a low LOS (e.g., D, E, or F) suggests significant room for improvement. Agencies use LOS analysis to identify areas needing attention and to evaluate the effectiveness of service improvements.
Q 18. How do you use data analytics to improve transit service performance?
Data analytics plays a vital role in enhancing transit service performance. By collecting and analyzing data, agencies can gain valuable insights into passenger behavior, system efficiency, and areas needing improvement.
- Automatic Vehicle Location (AVL) data: Provides real-time location of vehicles, allowing for monitoring of adherence to schedules, identification of delays, and optimization of routes.
- Automatic Passenger Counting (APC) data: Measures ridership on individual vehicles and routes, assisting in understanding passenger demand and making informed decisions about service adjustments.
- Smart Card data: Provides insights into passenger origin and destination patterns, helping optimize routes and schedules.
- Social media monitoring: Analyzing social media sentiment provides feedback on passenger experiences, identifying areas of concern and opportunities for improvement.
- Geographic Information System (GIS) data: Helps visualize and analyze spatial data, assisting in planning new routes, locating stations, and understanding accessibility.
By analyzing this data, we can identify trends like peak hours, underutilized routes, or areas with high demand. For example, if APC data shows low ridership on a specific route during certain hours, it might suggest that service on that route could be reduced or adjusted to match actual demand, optimizing efficiency and reducing costs.
Q 19. Describe your experience with public transportation planning in different contexts (rural, urban, suburban).
My experience spans various contexts, each presenting unique challenges and opportunities:
- Urban: Urban transit planning focuses on high-density areas with significant passenger volume. Challenges include congestion, limited space for infrastructure development, and high demand for service. I’ve worked on projects involving route optimization, station accessibility improvements, and the integration of different transit modes within complex urban networks.
- Suburban: Suburban planning focuses on lower-density areas with dispersed populations. Challenges include covering wider geographical areas, coordinating with multiple municipalities, and balancing affordability with service needs. My work here has involved designing feeder routes connecting suburban communities to regional transit hubs and exploring the viability of demand-responsive transportation (DRT) services.
- Rural: Rural transit planning addresses sparsely populated areas with limited ridership. Challenges include financial constraints, limited infrastructure, and the need to tailor services to meet diverse community needs. Projects I’ve been involved in include designing flexible routing systems (often involving DRT), coordinating with community organizations to ensure equitable access, and exploring innovative funding models.
Each context requires a unique approach. Urban planning might prioritize high-capacity transit, while rural planning might emphasize flexibility and community engagement to ensure efficient and accessible transportation for all.
Q 20. How do you balance the needs of different user groups (e.g., elderly, disabled, commuters) in transit planning?
Balancing the needs of diverse user groups is fundamental to equitable transit planning. It’s not just about getting people from A to B; it’s about ensuring that everyone can access and use the system comfortably and safely.
- Accessibility for Disabled Passengers: Compliance with ADA guidelines is crucial, ensuring level boarding, ramps, accessible signage, and announcements for visually impaired passengers.
- Support for Elderly Passengers: Features like easy-to-understand signage, comfortable seating, and frequent service can greatly improve the experience for older riders.
- Meeting Commuter Needs: Frequent service, reliable schedules, and convenient routes are vital for attracting commuters. This may involve express services or priority lanes.
- Child Passenger Considerations: Safe and secure environments, clear signage, and perhaps even family-friendly zones in stations can be important.
- Community Input: Active engagement with diverse communities to understand their specific needs and concerns, including conducting surveys and focus groups.
For example, designing stations with wider doorways, adequate lighting, and clearly marked routes not only meets ADA compliance but creates a safer and more welcoming environment for all users, reflecting a commitment to inclusive design.
Q 21. Explain your experience working with regulatory agencies related to transit planning.
Working effectively with regulatory agencies is crucial for successful transit planning. These agencies often set standards for safety, accessibility, and environmental impact.
My experience includes:
- Navigating permitting processes: Successfully obtaining necessary permits for construction and operation of transit infrastructure.
- Meeting accessibility requirements: Ensuring that transit plans comply with ADA standards and other relevant regulations.
- Addressing environmental concerns: Collaborating with environmental agencies to mitigate the environmental impact of transit projects, including noise and air pollution.
- Securing funding: Working with funding agencies to develop competitive grant applications and ensure compliance with their regulations.
- Compliance with federal and state regulations: Staying updated on relevant regulations and ensuring compliance throughout the planning and implementation process.
Effective communication and proactive engagement with regulatory agencies are crucial. Building positive relationships with these agencies is key to navigating the complexities of the regulatory landscape and securing approvals for projects efficiently.
Q 22. How do you integrate transit planning with other modes of transportation (e.g., biking, walking)?
Integrating transit planning with other modes of transportation, often called multimodal planning, is crucial for creating a truly efficient and sustainable transportation system. It’s not about competition between modes, but about creating a network where each mode complements the others, offering choices based on individual needs and trip characteristics.
First Mile/Last Mile Connectivity: Transit agencies need to consider how people will reach transit stops (first mile) and get to their final destination from the stop (last mile). This often involves integrating bike lanes, pedestrian walkways, and ride-sharing services. For instance, a well-placed bike-sharing station near a bus stop encourages biking as a feeder mode.
Transfer Optimization: Smooth transfers between different modes are vital. This might involve strategically locating bus stops near train stations or creating seamless ticketing systems that work across modes. Imagine a system where a bus ticket allows a free transfer to a light rail, encouraging modal shift.
Data Integration: Using integrated data from various sources (GPS data from buses, bike counters, pedestrian counts) is important for understanding modal usage, travel patterns, and identifying potential improvements. Combining this data with demographic information paints a complete picture of travel demand.
Land Use Planning: Transit planning needs to be aligned with land use decisions. Developing high-density, mixed-use areas near transit hubs promotes walking and transit usage while reducing reliance on cars. This concept is known as Transit-Oriented Development (TOD).
Q 23. Describe your experience in conducting transit ridership surveys.
I have extensive experience conducting transit ridership surveys, employing various methods to gather accurate and comprehensive data. This involves careful planning, execution, and analysis to gain meaningful insights into passenger behavior and preferences.
Survey Design: I start by defining clear objectives, identifying the target population, and choosing appropriate survey methods (e.g., on-board surveys, online surveys, intercept surveys). The questionnaire is designed to collect both quantitative (e.g., trip purpose, travel time) and qualitative (e.g., satisfaction levels, suggestions for improvement) data. Pilot testing is crucial to refine the survey before full-scale implementation.
Data Collection: Depending on the chosen method, data collection might involve deploying survey teams on buses and trains, distributing online surveys through various channels, or conducting intercept surveys at key locations. Ensuring a representative sample is vital for accurate results.
Data Analysis: Once collected, data undergoes rigorous cleaning, checking for inconsistencies and missing values. Statistical analysis helps in identifying trends, patterns, and correlations, leading to insights into passenger demographics, travel patterns, service usage, and overall satisfaction.
Example: In a recent project, we used an online survey coupled with on-board surveys to assess the ridership satisfaction of a new bus rapid transit (BRT) system. The combined data allowed us to identify key areas for service improvement, such as adjusting routes based on peak demand and improving accessibility at certain stops.
Q 24. How do you deal with unexpected disruptions (e.g., accidents, weather events) to transit service?
Dealing with unexpected disruptions is a critical aspect of transit service planning. A robust contingency plan and effective communication are essential to minimize the impact on passengers.
Real-time Monitoring: Utilizing GPS tracking systems and other technologies enables real-time monitoring of vehicles. This helps detect delays or disruptions early on.
Incident Management System: A well-defined incident management system ensures a coordinated response. This includes clearly defined roles and responsibilities, communication protocols, and escalation procedures.
Alternative Routing and Scheduling: In case of an accident or road closure, alternative routes and schedules can be implemented rapidly. This often involves dynamic adjustments to the service, using real-time data to optimize routing and minimize delays.
Communication Strategy: Effective communication to passengers is vital. This involves using various channels (e.g., mobile apps, social media, website updates, announcements on vehicles) to keep passengers informed about delays or alternative options. Transparency and timely updates are critical to maintain passenger confidence.
Example: During a severe snowstorm, we utilized real-time data to reroute buses around impassable roads and communicated the changes to passengers via our mobile app and social media, minimizing the disruption to service.
Q 25. Explain your understanding of the different phases of a transit project lifecycle.
The transit project lifecycle comprises several distinct phases, each with its own objectives and deliverables. Effective project management requires careful attention to each stage.
Planning and Feasibility Studies: This initial phase involves assessing the need for transit service, defining project objectives, conducting demand forecasting, identifying potential routes and technologies, and performing a cost-benefit analysis. This stage often includes stakeholder engagement and environmental impact assessments.
Design and Engineering: Once feasibility is established, the detailed design of the transit system begins. This includes route planning, stop location selection, vehicle selection, and system integration with existing infrastructure.
Construction and Implementation: This phase involves the actual construction of infrastructure, procurement of vehicles, and system testing. It requires careful coordination between various contractors and agencies.
Operations and Maintenance: After commissioning, the system is operated and maintained to ensure safe and efficient service. This involves driver training, fleet management, and ongoing system monitoring.
Evaluation and Improvement: Continuous evaluation of the system’s performance is critical to identify areas for improvement. This might involve further ridership surveys, performance monitoring, and adjustments to routes or schedules.
Q 26. How do you communicate complex transit planning information to diverse audiences?
Communicating complex transit planning information to diverse audiences requires using clear, concise language, visual aids, and a variety of communication channels tailored to the specific audience.
Plain Language: Avoiding jargon and using simple, everyday language is essential. Complex data should be presented in an easily understandable format, such as charts and graphs.
Visual Aids: Maps, infographics, and videos can effectively communicate complex information visually, making it easier for people to grasp key concepts.
Multi-Channel Communication: Using various communication channels (e.g., public meetings, websites, social media, newsletters) ensures wider reach and allows tailoring information to specific audience needs. For example, using social media to engage younger audiences and hosting community meetings for broader public input.
Accessibility: Information should be accessible to all, including individuals with disabilities. This might involve translating materials into multiple languages, providing audio descriptions, or using large-print versions.
Feedback Mechanisms: Providing opportunities for feedback allows for continuous improvement in communication strategies. Surveys, public forums, and online feedback forms can be valuable tools.
Q 27. What are your thoughts on the future of transit planning in the context of emerging technologies (e.g., autonomous vehicles)?
The future of transit planning is inextricably linked to emerging technologies. Autonomous vehicles (AVs), for example, offer the potential to revolutionize transit but also present unique challenges.
Opportunities: AVs could improve efficiency by optimizing routes and schedules, reducing operating costs, and improving safety. On-demand transit services using AVs could enhance accessibility and cater to diverse travel needs.
Challenges: The integration of AVs requires careful planning to address issues such as infrastructure requirements (e.g., charging stations, dedicated lanes), regulatory frameworks, and public acceptance. Job displacement for transit drivers is another major concern that needs proactive mitigation strategies.
Other Technologies: Beyond AVs, other technologies like smart ticketing systems, real-time information platforms, and data analytics play a vital role. These technologies improve operational efficiency, enhance passenger experience, and enable more data-driven decision-making.
Sustainable Transit: Future transit planning must prioritize sustainability. This involves exploring electric vehicles, integrating renewable energy sources, and minimizing environmental impact throughout the entire transit lifecycle.
Q 28. Describe a situation where you had to make a difficult decision in transit planning and how you handled it.
In one project, we faced the difficult decision of whether to prioritize expanding bus service in a rapidly growing suburban area or investing in a new light rail line. Both options had strong justifications.
The Dilemma: Expanding bus service offered a quicker, less expensive solution in the short term, addressing immediate needs. However, light rail offered a higher capacity, more sustainable, and potentially more efficient solution in the long term, accommodating projected growth.
Decision-Making Process: We conducted a thorough cost-benefit analysis, comparing the long-term implications of both options. We also engaged in extensive community consultations, collecting input from diverse stakeholders. This involved public forums, surveys, and meetings with local businesses and residents.
Outcome: Based on the analysis and public input, we opted for a phased approach, initially expanding bus service to address immediate demand while concurrently pursuing the necessary studies and funding for the light rail line. This strategy allowed us to address current needs while planning for the future.
Lessons Learned: This experience highlighted the importance of considering both short-term and long-term needs, weighing costs and benefits carefully, and engaging stakeholders effectively in the decision-making process.
Key Topics to Learn for Transit Service Planning and Design Interview
- Demand Forecasting and Analysis: Understanding methodologies like regression analysis and origin-destination studies to predict ridership and optimize service frequency.
- Route Network Design: Applying principles of network optimization, shortest path algorithms, and GIS software to create efficient and effective transit routes.
- Scheduling and Timetabling: Mastering techniques for creating robust and reliable transit schedules that account for dwell times, layover periods, and crew requirements.
- Service Planning Models: Familiarity with different transit planning models (e.g., transit assignment models, simulation models) and their applications in real-world scenarios.
- Accessibility and Equity: Designing transit systems that prioritize accessibility for all users, considering factors such as disability access, geographic equity, and socioeconomic factors.
- Transit Technology and ITS: Understanding the role of Intelligent Transportation Systems (ITS) in transit planning and operations, including GPS tracking, real-time information systems, and automated fare collection.
- Cost-Benefit Analysis and Financial Planning: Developing sound financial plans, performing cost-benefit analyses, and justifying projects based on economic feasibility.
- Data Visualization and Presentation: Effectively communicating complex transit data and analytical findings to stakeholders through clear and concise visualizations.
- Problem-solving and Critical Thinking: Demonstrating the ability to identify and analyze problems, develop creative solutions, and make informed decisions under pressure.
Next Steps
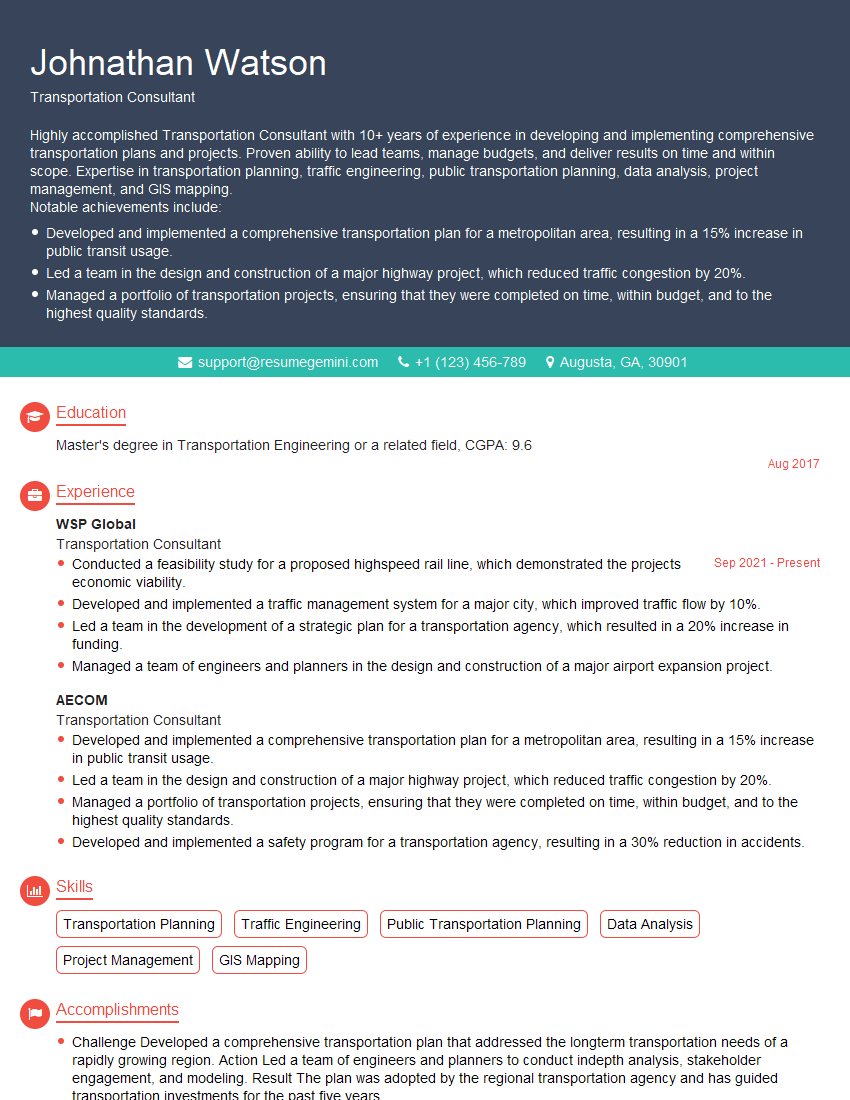
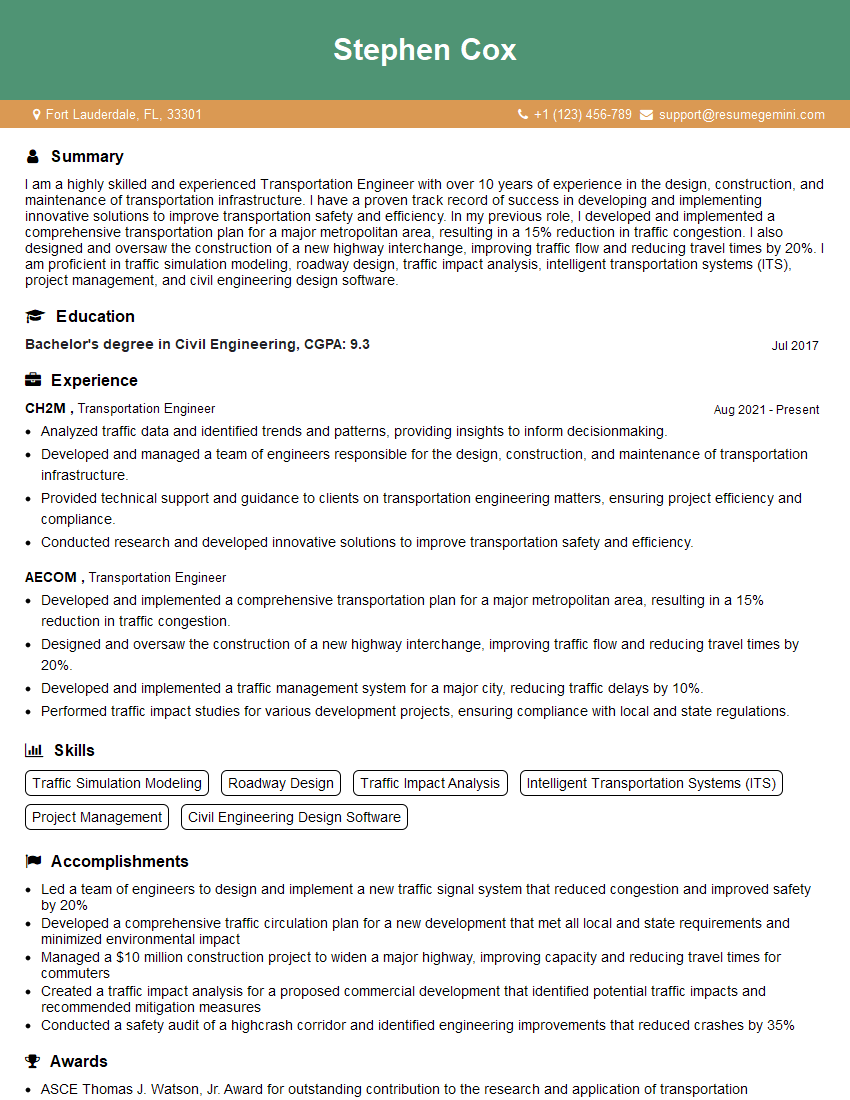
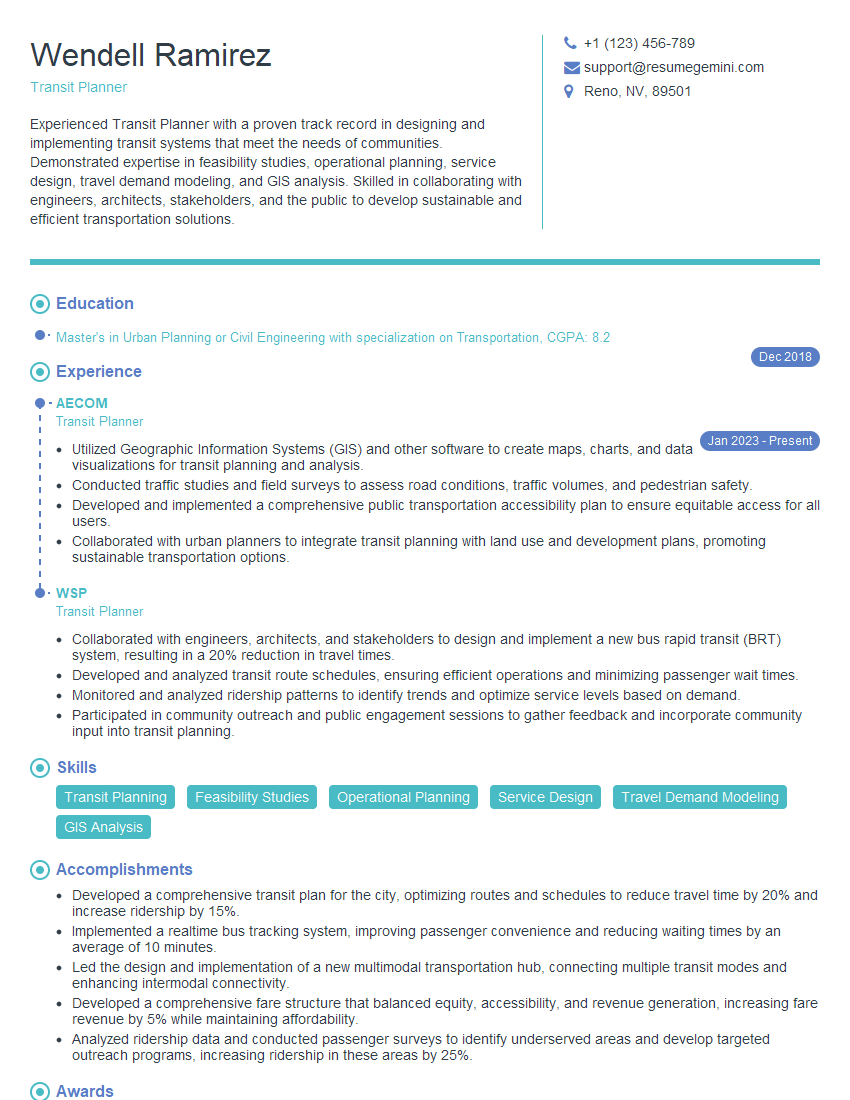
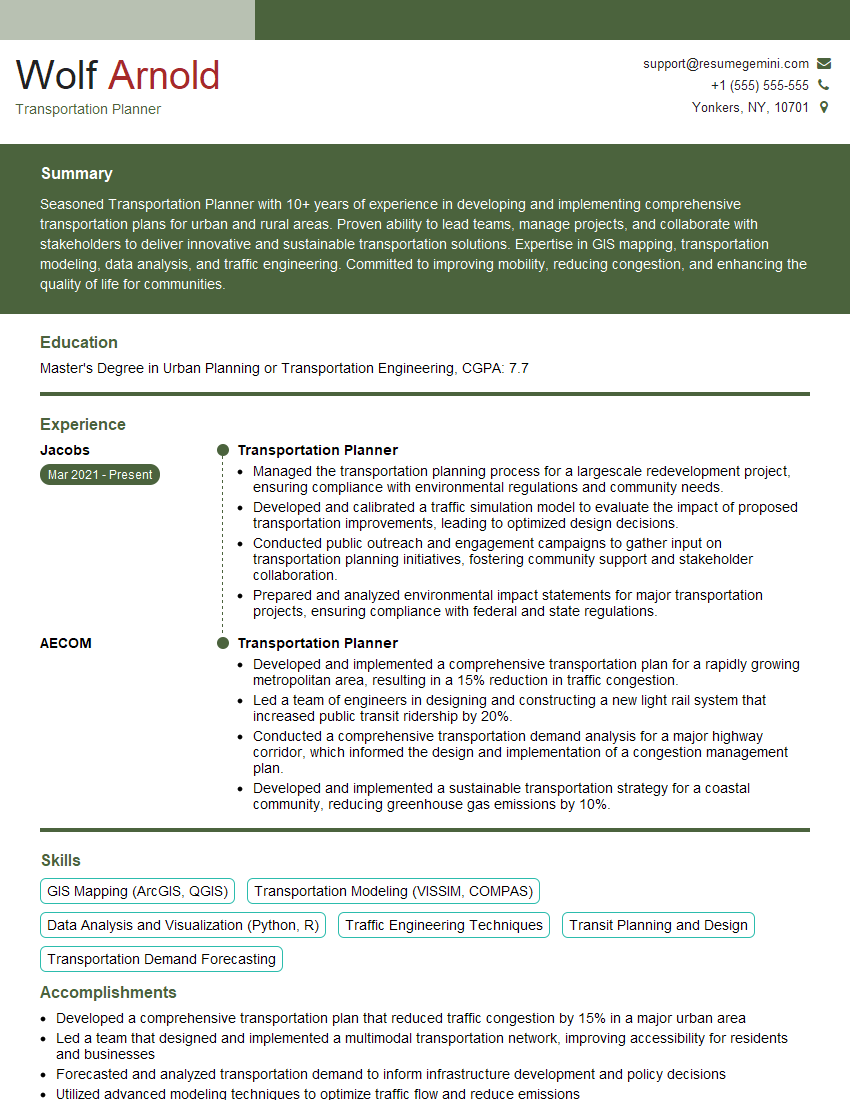
Mastering Transit Service Planning and Design opens doors to exciting career opportunities with significant impact on communities. Your expertise in optimizing transit networks and improving passenger experiences is highly valuable in today’s rapidly evolving urban landscape. To stand out and secure your dream role, a strong resume is crucial. Creating an ATS-friendly resume is key to getting your application noticed. ResumeGemini is a trusted resource to help you build a professional and impactful resume that showcases your skills and experience effectively. Examples of resumes tailored specifically to Transit Service Planning and Design are available to help guide you.
Explore more articles
Users Rating of Our Blogs
Share Your Experience
We value your feedback! Please rate our content and share your thoughts (optional).
What Readers Say About Our Blog
To the interviewgemini.com Webmaster.
Very helpful and content specific questions to help prepare me for my interview!
Thank you
To the interviewgemini.com Webmaster.
This was kind of a unique content I found around the specialized skills. Very helpful questions and good detailed answers.
Very Helpful blog, thank you Interviewgemini team.