Interviews are opportunities to demonstrate your expertise, and this guide is here to help you shine. Explore the essential Variance Applications interview questions that employers frequently ask, paired with strategies for crafting responses that set you apart from the competition.
Questions Asked in Variance Applications Interview
Q 1. Explain the concept of variance analysis.
Variance analysis is a powerful management accounting technique used to identify and analyze the differences between planned (budgeted) and actual results. Think of it like comparing your monthly budget to your actual spending – variances highlight where you exceeded or underspent. This analysis helps businesses understand why performance deviated from expectations, pinpoint areas for improvement, and ultimately, improve profitability and efficiency. It’s not just about finding differences; it’s about understanding the *reasons* behind those differences.
For example, a company might budget to sell 10,000 units but only sells 8,000. Variance analysis would help uncover whether this shortfall was due to weak marketing, increased competitor activity, or unforeseen economic factors.
Q 2. What are the different types of variances?
Variances are categorized in various ways, often depending on the aspect of the business being analyzed. Common types include:
- Material Variances: These analyze differences in the cost and usage of raw materials. They are further broken down into material price variance and material usage variance.
- Labor Variances: These analyze differences in labor costs, considering both the rate paid and the efficiency of labor. They are further divided into labor rate variance and labor efficiency variance.
- Overhead Variances: These analyze differences in overhead costs, which can be fixed or variable. They are often more complex to analyze due to the multiple factors involved.
- Sales Variances: These compare actual sales revenue and units sold to the budgeted figures. They can reveal insights into pricing strategies, sales volume, and market demand.
The specific types of variances a company analyzes depend on its industry, operational complexity, and strategic goals.
Q 3. Describe the process of investigating and resolving variances.
Investigating and resolving variances is a systematic process. It usually involves these steps:
- Identify the Variance: Calculate the variance and determine its significance. Is it material enough to warrant investigation?
- Analyze the Cause: This is the most crucial step. Gather data, talk to employees involved in the process, and review relevant documentation. For example, a significant material price variance might be caused by a change in supplier pricing or a shift in raw material quality. Poor weather conditions could influence the yield in farming.
- Develop Corrective Actions: Based on the identified causes, develop specific actions to prevent similar variances in the future. This might involve negotiating better prices with suppliers, improving employee training, or adjusting production processes.
- Implement and Monitor: Implement the corrective actions and closely monitor their effectiveness. Track key performance indicators (KPIs) to ensure the problem is resolved and doesn’t recur.
- Document Findings: Maintain records of the investigation, analysis, corrective actions, and results. This creates a valuable database for future reference and continuous improvement.
Effective variance investigation is a crucial part of continuous improvement and helps build a more efficient and profitable business.
Q 4. How do you calculate material price variance?
Material price variance measures the difference between the actual price paid for materials and the standard or budgeted price. It reflects the impact of price changes on the cost of materials used.
The formula is:
Material Price Variance = (Actual Quantity Purchased * Actual Price) - (Actual Quantity Purchased * Standard Price)Example: A company budgeted to buy 1000 units of material at $10 per unit. They actually purchased 1000 units at $11 per unit. The material price variance is: (1000 * $11) – (1000 * $10) = $1000 (Unfavorable). An unfavorable variance means the actual cost is higher than the budgeted cost.
Q 5. How do you calculate material usage variance?
Material usage variance measures the difference between the actual quantity of materials used in production and the standard quantity that should have been used, based on the level of output. It reveals efficiency in material usage.
The formula is:
Material Usage Variance = (Actual Quantity Used * Standard Price) - (Standard Quantity Allowed * Standard Price)Example: The standard quantity of material required to produce one unit of output is 2 kg at a standard price of $5/kg. The company produced 1000 units and used 2200 kg of material. The material usage variance is: (2200 * $5) – (2000 * $5) = $1000 (Unfavorable). This indicates that more material was used than expected for the output produced.
Q 6. How do you calculate labor rate variance?
Labor rate variance measures the difference between the actual labor rate paid and the standard or budgeted labor rate. This variance helps pinpoint if the actual cost of labor differs from the planned cost due to factors like wage increases or changes in employee mix.
The formula is:
Labor Rate Variance = (Actual Hours Worked * Actual Rate) - (Actual Hours Worked * Standard Rate)Example: A company budgeted a standard labor rate of $20 per hour. Employees worked 1000 hours and the actual labor rate was $22 per hour. The labor rate variance is: (1000 * $22) – (1000 * $20) = $2000 (Unfavorable). This shows that the actual labor cost exceeded the budgeted cost due to a higher-than-expected labor rate.
Q 7. How do you calculate labor efficiency variance?
Labor efficiency variance measures the difference between the actual labor hours worked and the standard labor hours that should have been worked to achieve the actual level of output. It highlights efficiency or inefficiency in the labor process.
The formula is:
Labor Efficiency Variance = (Actual Hours Worked * Standard Rate) - (Standard Hours Allowed * Standard Rate)Example: The standard time to produce one unit is 2 hours at a standard rate of $20 per hour. The company produced 1000 units and the actual hours worked were 2200 hours. The labor efficiency variance is: (2200 * $20) – (2000 * $20) = $4000 (Unfavorable). This means more labor hours than expected were used to achieve the actual output.
Q 8. How do you calculate sales price variance?
Sales price variance measures the difference between the actual revenue generated and the revenue that would have been generated had sales been made at the budgeted or planned price. It essentially tells us how much our profit was impacted by changes in the selling price of our goods or services.
The formula is: Sales Price Variance = (Actual Price – Budgeted Price) x Actual Quantity
Example: Let’s say we budgeted to sell 100 units of a product at $10 each, but we actually sold them at $12 each. The sales price variance would be: (12 – 10) x 100 = $200 (Favorable). This is favorable because we earned more revenue than anticipated due to a higher selling price.
In a scenario where we sold at $8 instead of the budgeted $10, the variance would be (8 – 10) x 100 = -$200 (Unfavorable), signifying a loss in revenue due to a lower selling price.
Q 9. How do you calculate sales volume variance?
Sales volume variance reflects the difference between the actual sales revenue and the revenue that would have been generated had the sales quantity been at the planned level, assuming the sales price remains constant. This isolates the impact of changes in sales volume on overall revenue.
The formula is: Sales Volume Variance = (Actual Quantity – Budgeted Quantity) x Budgeted Price
Example: Suppose our budget was for 100 units at $10 each, but we actually sold 120 units at $10 each. The sales volume variance would be: (120 – 100) x 10 = $200 (Favorable). This is a favorable variance because we sold more units than anticipated.
If we only sold 80 units, the variance would be (80 – 100) x 10 = -$200 (Unfavorable), indicating lower than expected sales volume.
Q 10. Explain the difference between favorable and unfavorable variances.
In variance analysis, ‘favorable’ and ‘unfavorable’ are relative terms describing whether a variance increases or decreases profitability. It’s crucial to understand that favorable doesn’t automatically mean ‘good’ and unfavorable doesn’t mean ‘bad’. The context is vital.
- Favorable Variance: This indicates that the actual results exceeded the budgeted results, leading to higher profits than anticipated (e.g., higher sales revenue, lower costs).
- Unfavorable Variance: This suggests that the actual results fell short of the budgeted results, resulting in lower profits than anticipated (e.g., lower sales revenue, higher costs).
Example: A favorable variance in selling price is good, but an unfavorable variance in materials cost could be due to a higher-quality material which may justify the higher expense in the long run. Always investigate further!
Q 11. How do you present variance analysis findings?
Presenting variance analysis findings requires clarity and precision. The goal is to communicate the key insights effectively. I typically use a combination of techniques:
- Variance Reports: These reports summarize the variances for various key areas, usually presented in a tabular format showing the budgeted amounts, actual amounts, and the resulting variances (both in absolute values and percentages).
- Charts and Graphs: Visual representations like bar charts or line graphs can highlight trends and patterns in the variances, making them easily understandable. This is especially useful for showing variances over time.
- Narrative Summary: In addition to the numerical data, a narrative summary explains the significant variances, highlighting the potential causes and suggesting recommendations for improvement.
- Prioritization: Focus on the most significant variances (both favorable and unfavorable) in terms of their impact on profitability. Don’t get bogged down in small, insignificant variations.
The presentation should be tailored to the audience. For senior management, a concise summary with key highlights might suffice; for operational teams, a more detailed analysis might be required.
Q 12. What are the key performance indicators (KPIs) used in variance analysis?
Several key performance indicators (KPIs) are commonly used in variance analysis. The choice depends on the specific context and industry but generally includes:
- Sales Revenue Variance: Measures the difference between actual and budgeted sales revenue.
- Cost of Goods Sold (COGS) Variance: Analyzes the difference between actual and budgeted COGS.
- Gross Profit Variance: The variance between actual and budgeted gross profit.
- Operating Expense Variance: Examines variations in operating expenses like salaries, rent, and utilities.
- Net Profit Variance: The overall variance between actual and budgeted net profit.
- Sales Price Variance (as discussed earlier): Focuses on pricing strategies.
- Sales Volume Variance (as discussed earlier): Shows the impact of sales volume on revenue.
- Material Price Variance and Material Usage Variance: (For manufacturing industries)
- Labor Rate Variance and Labor Efficiency Variance: (For manufacturing industries)
These KPIs, combined with appropriate analysis, provide a comprehensive view of business performance.
Q 13. How do you identify the root causes of variances?
Identifying the root causes of variances is crucial. It’s not enough to just know that a variance exists; you need to understand why it occurred. I employ a systematic approach:
- Data Review: Begin by thoroughly reviewing the data to identify the specific areas where variances are significant.
- Investigative Meetings: Hold meetings with relevant departments to gather insights and perspectives.
- 5 Whys Analysis: Repeatedly ask ‘Why?’ to drill down to the root cause of the variance. This helps to uncover underlying issues.
- External Factors Consideration: Account for external factors (e.g., economic downturns, changes in market conditions, natural disasters, supplier issues) that could have contributed to the variances.
- Benchmarking: Compare your performance to industry benchmarks to see if the variances are industry-wide or specific to your organization.
Document all findings and recommendations to ensure that appropriate corrective actions can be implemented and tracked for future improvement.
Q 14. What software or tools do you use for variance analysis?
Numerous software and tools can be used for variance analysis, ranging from simple spreadsheets to sophisticated enterprise resource planning (ERP) systems. My experience encompasses several options:
- Spreadsheets (Excel, Google Sheets): Excellent for smaller organizations or for basic variance analysis. They allow for manual calculations and visual representation of data.
- Business Intelligence (BI) tools (Tableau, Power BI): These provide powerful data visualization and reporting capabilities, enabling more in-depth analysis and interactive dashboards.
- Enterprise Resource Planning (ERP) Systems (SAP, Oracle): Large organizations often use ERP systems, which integrate various business processes and provide built-in reporting and variance analysis tools.
- Specialized Financial Software: Certain software packages are specifically designed for financial planning and analysis (FP&A), including robust variance analysis features.
The best tool depends on the complexity of the analysis, the size of the organization, and the available budget. Often, a combination of tools is used to achieve optimal results. I am proficient in utilizing all of these.
Q 15. Describe your experience with variance reporting and analysis.
Variance reporting and analysis is the process of identifying, investigating, and explaining the differences between planned (budgeted) and actual results. My experience spans various industries, including [mention industries, e.g., manufacturing, retail, and finance], where I’ve been responsible for developing and implementing variance reports across diverse financial metrics like revenue, costs, and profitability. This involved not only analyzing existing reports but also designing new ones tailored to specific business needs. For example, in a manufacturing setting, I developed a variance report that highlighted deviations in material costs, labor hours, and production output, allowing for timely identification of inefficiencies and cost overruns. In retail, I focused on sales variance analysis, correlating deviations with promotional campaigns, seasonal trends, and competitor activity.
My work involves deep-diving into the underlying data to understand the ‘why’ behind the variances, not just the ‘what’. This requires strong analytical skills, attention to detail, and a collaborative approach, working closely with operational teams to understand the root causes.
Career Expert Tips:
- Ace those interviews! Prepare effectively by reviewing the Top 50 Most Common Interview Questions on ResumeGemini.
- Navigate your job search with confidence! Explore a wide range of Career Tips on ResumeGemini. Learn about common challenges and recommendations to overcome them.
- Craft the perfect resume! Master the Art of Resume Writing with ResumeGemini’s guide. Showcase your unique qualifications and achievements effectively.
- Don’t miss out on holiday savings! Build your dream resume with ResumeGemini’s ATS optimized templates.
Q 16. How do you handle significant variances?
Handling significant variances requires a structured approach. My first step is to understand the magnitude and nature of the variance. Is it a one-off event or a trend? Next, I investigate the underlying causes. This often involves collaborating with the relevant department managers to gather data and insights. For instance, a significant negative variance in sales might be due to lower-than-anticipated demand, pricing issues, or supply chain disruptions. A cost overrun could be because of increased material prices, production inefficiencies, or unexpected maintenance expenses.
Once the root cause is identified, I work with the team to develop corrective actions. This could involve revising the budget, implementing process improvements, adjusting pricing strategies, or negotiating better terms with suppliers. Crucially, I also document the entire investigation and corrective actions, ensuring lessons are learned and similar issues are prevented in the future. This documentation is often shared within the organization to foster continuous improvement.
Q 17. How do you prioritize variance investigations?
Prioritizing variance investigations requires a strategic approach. I typically use a framework that considers the materiality of the variance (the larger the variance, the higher the priority), the potential impact on the business (e.g., a large negative variance in revenue is higher priority than a small variance in stationery costs), and the likelihood of identifying a correctable cause. I prioritize variances that are both significant in magnitude and have a high potential impact on the business.
For example, I might use a simple matrix to visualize the prioritization. A significant revenue shortfall that is clearly tied to a new competitor entering the market would be a top priority, while a small variation in utilities costs, easily explained by seasonal changes, would receive a lower priority. This prioritization ensures that resources are allocated efficiently to address the most critical issues first.
Q 18. Explain your experience with budgeting and forecasting.
My experience with budgeting and forecasting is extensive. I’ve been involved in all stages of the process, from gathering data and developing assumptions to creating the budget and forecast, and finally, monitoring performance and making adjustments as needed. I am proficient in various budgeting techniques, including zero-based budgeting and incremental budgeting, and I can adapt my approach to suit different business contexts and reporting periods.
In practice, this has involved building detailed financial models, utilizing forecasting software (mention specific software if used, e.g., Anaplan, Hyperion), and collaborating with various departments to gather their input and ensure the budget is realistic and achievable. I also regularly review and update the budget and forecast based on actual performance and changing market conditions. This iterative process ensures that the budget remains relevant and that the business has accurate insights into its financial outlook.
Q 19. How do you use variance analysis to improve business performance?
Variance analysis is a powerful tool for improving business performance. By identifying and investigating variances, we can uncover operational inefficiencies, flawed strategies, and emerging risks. For instance, a consistent unfavorable variance in labor costs might indicate a need to review staffing levels, training programs, or compensation structures. A persistent negative sales variance might suggest a need for improved marketing, a product refresh, or a price adjustment.
The insights gleaned from variance analysis can be used to inform data-driven decision-making, leading to targeted improvements in areas such as operational efficiency, cost control, revenue generation, and resource allocation. The process fosters a culture of continuous improvement, constantly evaluating performance and adjusting strategies based on hard data rather than intuition.
Q 20. What are the limitations of variance analysis?
While variance analysis is a valuable tool, it does have limitations. One key limitation is that it only identifies deviations from the plan; it doesn’t necessarily explain the underlying reasons. A significant variance might be due to factors outside the control of the business, such as unexpected economic downturns or natural disasters. Further, the accuracy of the analysis is heavily reliant on the accuracy of the initial budget. If the budget itself is flawed, the variance analysis will be similarly flawed.
Another limitation is the potential for oversimplification. Variance analysis often focuses on aggregate figures, potentially masking important nuances at a more granular level. Finally, the analysis might be influenced by accounting policies, making cross-company comparisons difficult. It’s essential to understand these limitations and interpret the results with caution.
Q 21. How do you communicate variance analysis results to non-financial stakeholders?
Communicating variance analysis results to non-financial stakeholders requires clear, concise, and visually appealing communication. I avoid technical jargon and instead use plain language, focusing on the key findings and their implications for the business. I often use visual aids such as charts, graphs, and dashboards to illustrate the data and make it easily digestible. For example, a simple bar chart comparing budgeted vs. actual sales can be much more effective than a complex spreadsheet.
My communication approach also emphasizes the ‘story’ behind the numbers. Instead of simply stating the variance, I explain the reasons behind it and the actions being taken to address it. This makes the information more relevant and engaging for non-financial stakeholders, allowing them to understand the context and appreciate the importance of the findings. I tailor my communication style to the specific audience, ensuring that the message is both informative and persuasive.
Q 22. How do you reconcile variances between different reporting systems?
Reconciling variances between different reporting systems requires a systematic approach. It starts with understanding the source of the discrepancies. Are the differences due to timing issues (e.g., one system closing its books earlier), different accounting methodologies (e.g., one using accrual, the other cash), or simply data entry errors?
My approach involves:
- Data Mapping: Carefully mapping the data elements from each system to ensure apples-to-apples comparisons. This often requires creating a cross-reference table to identify equivalent fields across systems.
- Root Cause Analysis: Investigating the variances. For example, a significant difference in sales revenue might be traced to a delay in reporting transactions in one system.
- Data Cleaning & Reconciliation: Employing data cleansing techniques to identify and correct errors. This might involve reviewing transactions flagged as outliers or discrepancies. A reconciliation report, outlining the identified differences and their causes, is crucial.
- System Validation: If discrepancies are persistent, it’s vital to validate the accuracy and integrity of the underlying systems. This may involve verifying system configurations, data sources, and processing logic.
- Establishing a Standard Reporting Process: Implementing a standardized reporting process across all systems can significantly reduce future reconciliation efforts. This includes defining clear data definitions, reporting timelines, and data validation rules.
For instance, I once worked with a company that had discrepancies in sales figures between their CRM and ERP systems. After a thorough investigation, we found the CRM had not been updated consistently, leading to underreporting. We implemented a data synchronization process to ensure data consistency across systems.
Q 23. Describe your experience with different variance analysis methods.
I have extensive experience with various variance analysis methods, ranging from simple comparisons to more sophisticated statistical techniques. Here are some examples:
- Simple Variance Analysis: Calculating the difference between actual and budgeted values. This is useful for quickly identifying significant deviations, but offers limited insight into the underlying causes.
Variance = Actual - Budget - Percentage Variance Analysis: Expressing the variance as a percentage of the budget. This provides a relative measure of the variance, useful for comparing variances across different items or periods.
Percentage Variance = (Actual - Budget) / Budget * 100 - Trend Analysis: Analyzing variances over time to identify patterns and trends. This is especially useful for forecasting and planning.
- Regression Analysis: A statistical method that explores the relationship between multiple variables and their impact on a variance. This can identify key drivers of variance.
- Decomposition Analysis: Breaking down a total variance into its component parts (e.g., price variance, quantity variance). This provides a deeper understanding of the factors contributing to the overall variance.
The choice of method depends on the specific context and the level of detail required. For instance, simple variance analysis is suitable for a quick overview, while decomposition analysis is needed for a deeper dive into the underlying drivers.
Q 24. How do you ensure the accuracy and reliability of variance data?
Ensuring the accuracy and reliability of variance data is paramount. It involves a multi-pronged approach:
- Data Source Validation: Verifying the accuracy and reliability of the source data. This might involve reviewing data entry procedures, reconciliation processes, and data validation rules.
- Data Cleansing: Identifying and correcting errors, inconsistencies, and outliers in the data. This includes techniques like outlier detection and data imputation.
- Regular Audits: Conducting regular audits of the variance calculation process to detect and correct errors or inconsistencies.
- System Controls: Implementing appropriate internal controls to prevent errors and ensure data integrity. This might include access controls, authorization procedures, and data validation checks.
- Documentation: Maintaining comprehensive documentation of the variance calculation process and all data sources. This makes it easier to trace errors and ensure consistency.
For example, in one project, we implemented automated data validation rules to check for inconsistencies in data entries before they were processed. This significantly reduced errors and improved the overall accuracy of our variance reports.
Q 25. How do you use variance analysis to support decision-making?
Variance analysis is a powerful tool for supporting decision-making. By identifying and analyzing variances, we can pinpoint areas of strength and weakness, and inform strategic adjustments.
Specifically:
- Performance Evaluation: Identifying areas of underperformance and opportunities for improvement.
- Strategic Planning: Incorporating variance analysis insights into future planning and budgeting processes.
- Resource Allocation: Optimizing resource allocation based on the insights gleaned from variance analysis.
- Problem Solving: Identifying and addressing the root causes of significant variances.
- Process Improvement: Using variance analysis to identify and improve inefficient processes.
For instance, if we identify a significant unfavorable variance in labor costs, we might investigate the root causes (e.g., overtime, inefficient processes) and implement corrective actions (e.g., streamline processes, improve scheduling).
Q 26. Explain your experience with variance analysis in a specific industry.
In the manufacturing industry, I’ve extensively used variance analysis to track and manage production costs. We analyzed variances in direct materials, direct labor, and manufacturing overhead. For example, a significant unfavorable direct materials variance might be due to price increases, waste, or spoilage. We would use this information to negotiate better prices with suppliers, implement waste reduction strategies, or improve quality control procedures.
We employed decomposition analysis to break down the total cost variance into its components. This provided a granular understanding of the factors driving the cost fluctuations. We presented these findings to management and recommended actions to mitigate future variances. This often involved collaborations with purchasing, production, and quality control teams.
Q 27. What are some common challenges in variance analysis, and how have you overcome them?
Common challenges in variance analysis include:
- Data Quality Issues: Inaccurate or incomplete data can lead to misleading variance analyses. I address this by implementing robust data validation procedures and thorough data cleansing techniques.
- Time Lags: Delays in data collection can hinder timely analysis. I mitigate this by establishing efficient data collection and reporting processes.
- Attribution Challenges: Determining the precise cause of a variance can be difficult, especially for complex processes. I tackle this through careful investigation, root cause analysis, and potentially employing statistical techniques such as regression analysis.
- Lack of Context: Variances interpreted in isolation can be misleading. I always consider the broader economic and business context when analyzing variances.
Overcoming these challenges requires a collaborative approach, involving stakeholders across different departments to gain a comprehensive understanding of the underlying causes of variances. For example, to address data quality issues, I’ve worked with IT to improve data integration and validation processes.
Q 28. Describe a time you identified a significant variance and the steps you took to resolve it.
In a previous role, we identified a significant unfavorable variance in marketing campaign ROI. The initial analysis showed significantly lower-than-expected conversion rates.
My steps to resolve this were:
- Detailed Investigation: We performed a detailed analysis of the campaign performance metrics, including website traffic, click-through rates, conversion rates, and cost per acquisition.
- Root Cause Analysis: We conducted A/B testing on different marketing materials and landing pages to identify areas for improvement. We also investigated the targeting strategy and identified issues with audience segmentation.
- Corrective Actions: Based on the root cause analysis, we made adjustments to the targeting strategy, refined our messaging and call to action, and optimized the landing page experience.
- Monitoring and Evaluation: We continued to monitor the campaign performance after implementing the corrective actions, and we tracked the impact on key metrics. We documented the improvements and shared the findings with the marketing team.
This systematic approach led to a significant improvement in the campaign’s ROI, demonstrating the value of a thorough variance investigation and subsequent corrective actions.
Key Topics to Learn for Variance Applications Interview
- Understanding Variance: Grasp the fundamental concepts of variance, its calculation, and its significance in statistical analysis and decision-making within applications.
- Types of Variance: Explore different types of variance encountered in practical applications, such as process variance, material variance, and labor variance. Understand their implications and how to analyze them.
- Variance Analysis Techniques: Familiarize yourself with methods for analyzing variance, including graphical representations and statistical tests, to pinpoint areas needing improvement or further investigation.
- Practical Applications: Consider real-world scenarios where variance analysis is crucial, such as financial forecasting, quality control, project management, and operational efficiency. Be prepared to discuss how variance analysis informs strategic decisions.
- Interpreting Variance Results: Learn how to effectively communicate findings from variance analysis to both technical and non-technical audiences. Practice explaining the implications of your findings concisely and clearly.
- Problem-Solving with Variance: Develop your ability to identify the root causes of variances and propose solutions based on your analysis. Be prepared to discuss case studies or hypothetical scenarios.
- Software and Tools: Gain familiarity with common software and tools used for variance analysis, including spreadsheet software and statistical packages. Understanding their capabilities is beneficial.
Next Steps
Mastering variance applications significantly enhances your analytical and problem-solving skills, making you a highly valuable asset in any data-driven environment. This expertise opens doors to exciting career opportunities across various industries. To maximize your job prospects, it’s crucial to present your skills effectively through a well-crafted, ATS-friendly resume. ResumeGemini is a trusted resource that can help you build a professional and impactful resume tailored to highlight your variance application skills. Examples of resumes tailored to Variance Applications are available below to help guide your preparation.
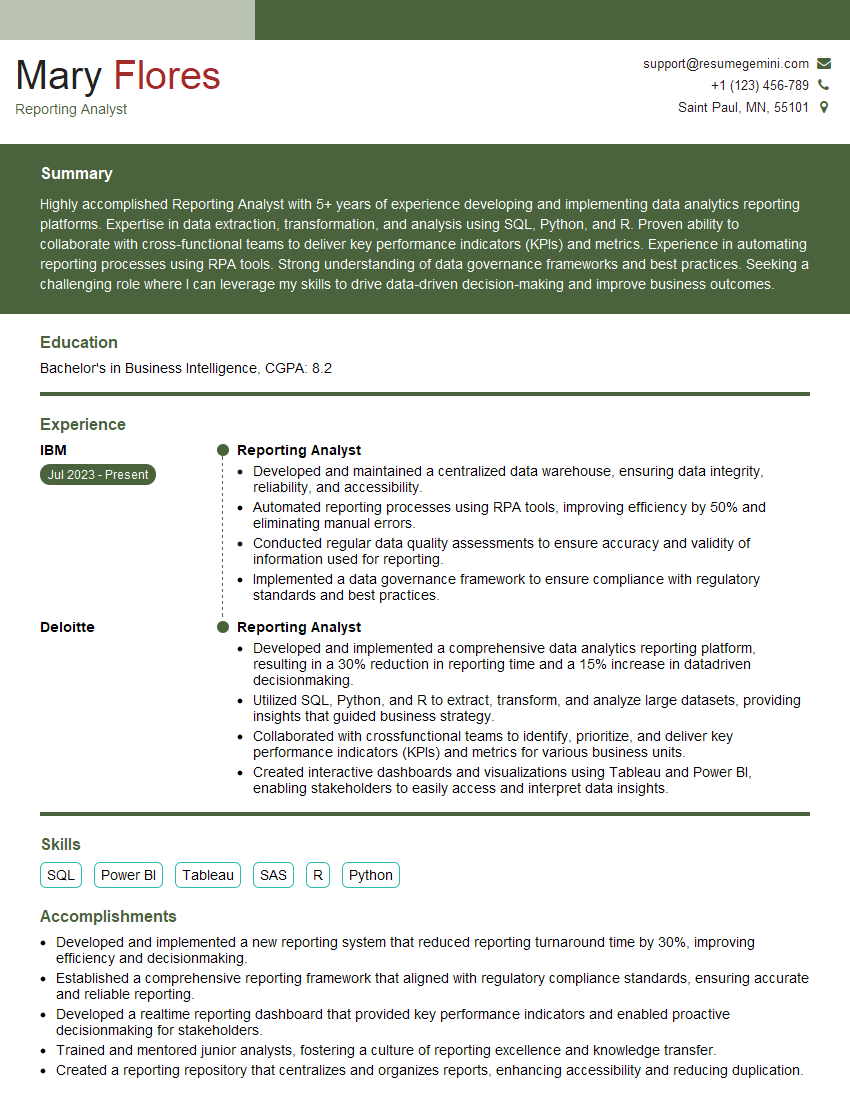
Reporting Analyst Resume Sample
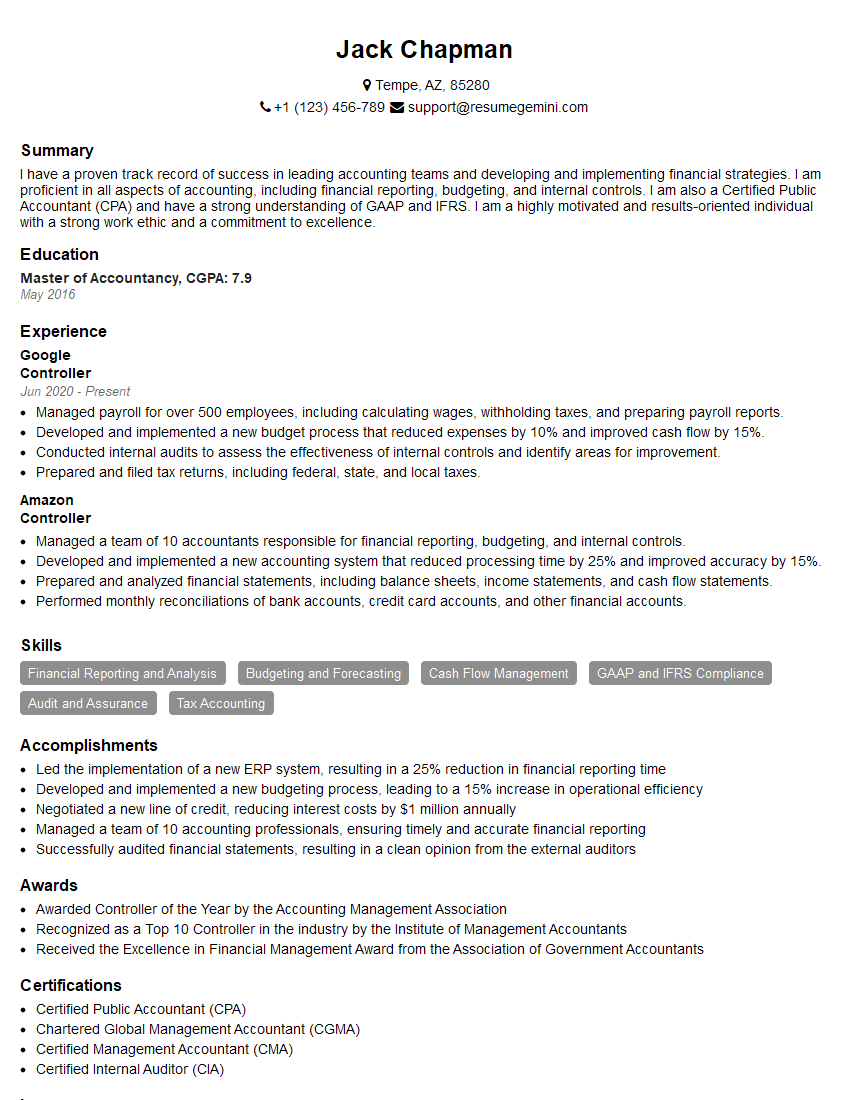
Controller Resume Sample
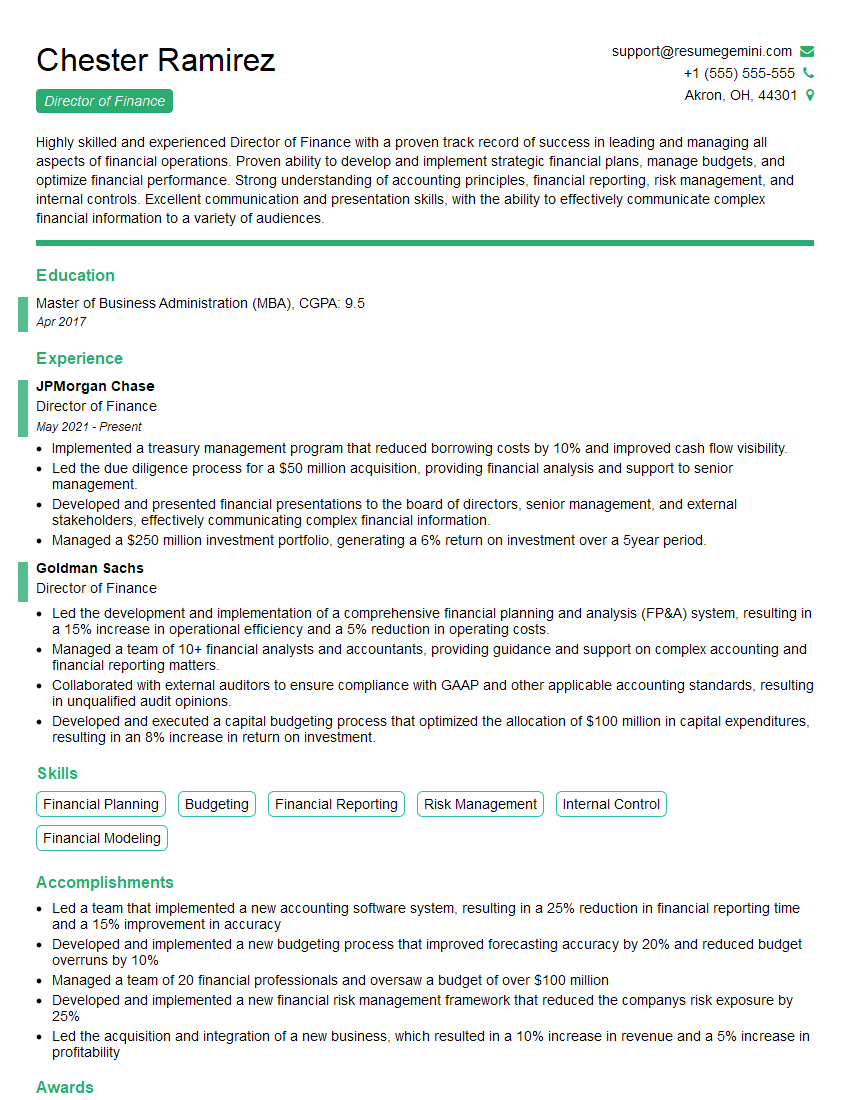
Director of Finance Resume Sample

Budget Manager Resume Sample
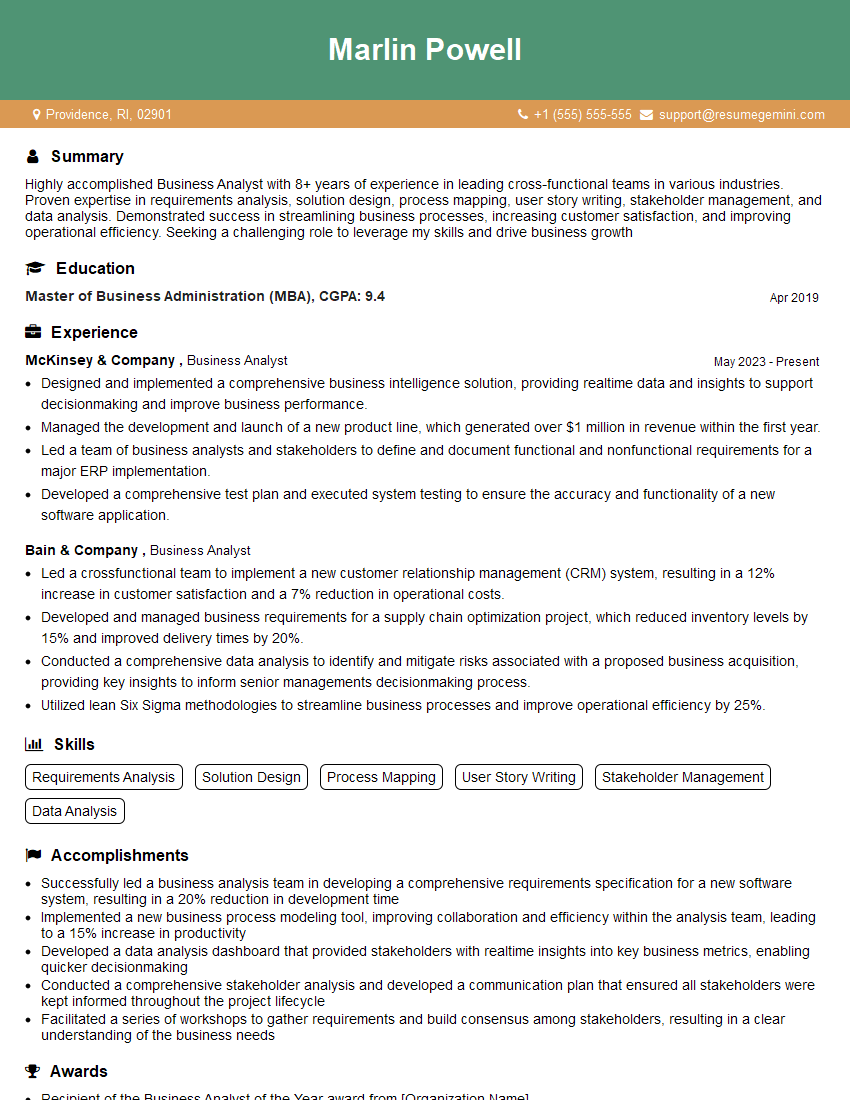
Business Analyst Resume Sample
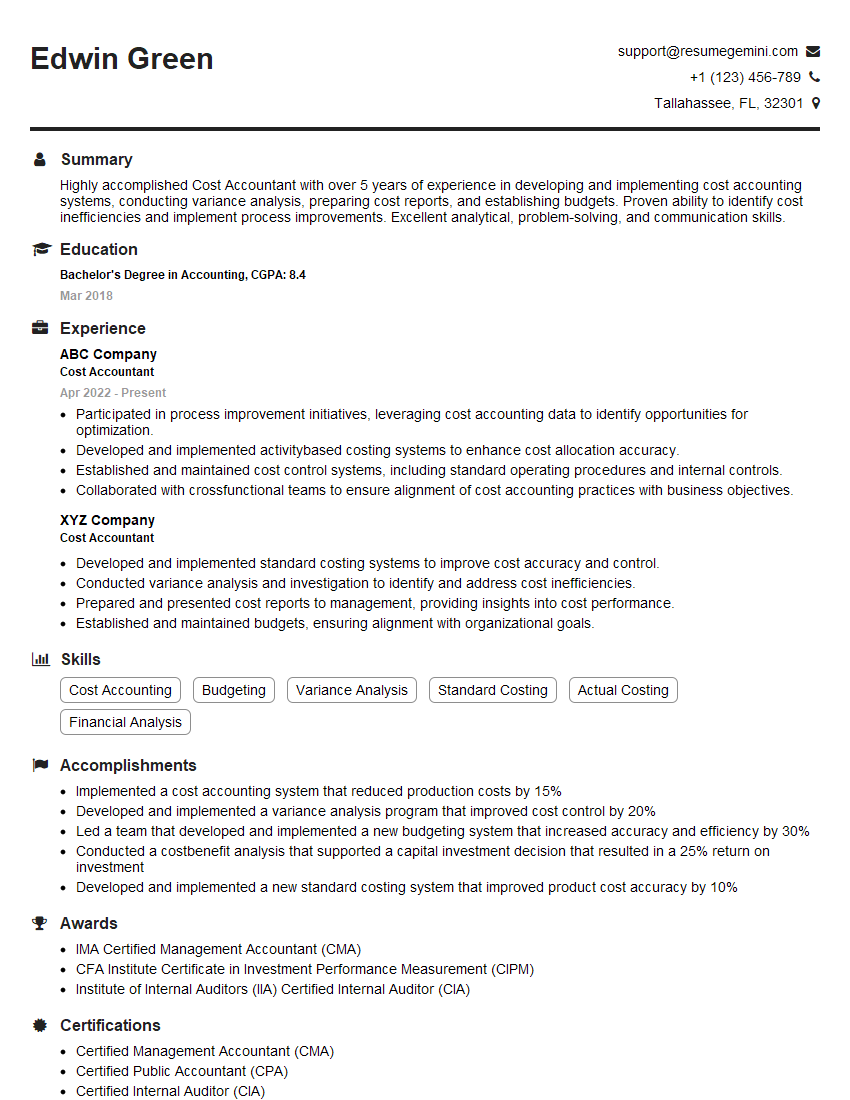
Cost Accountant Resume Sample
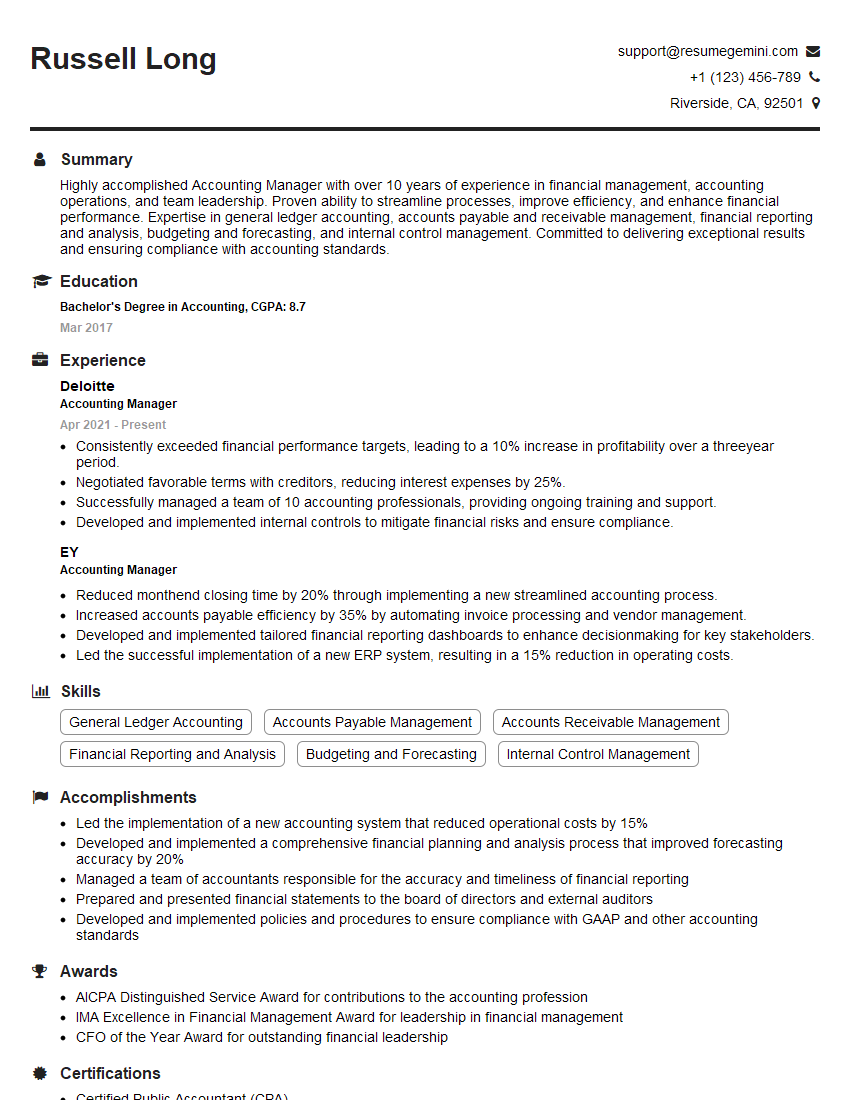
Accounting Manager Resume Sample
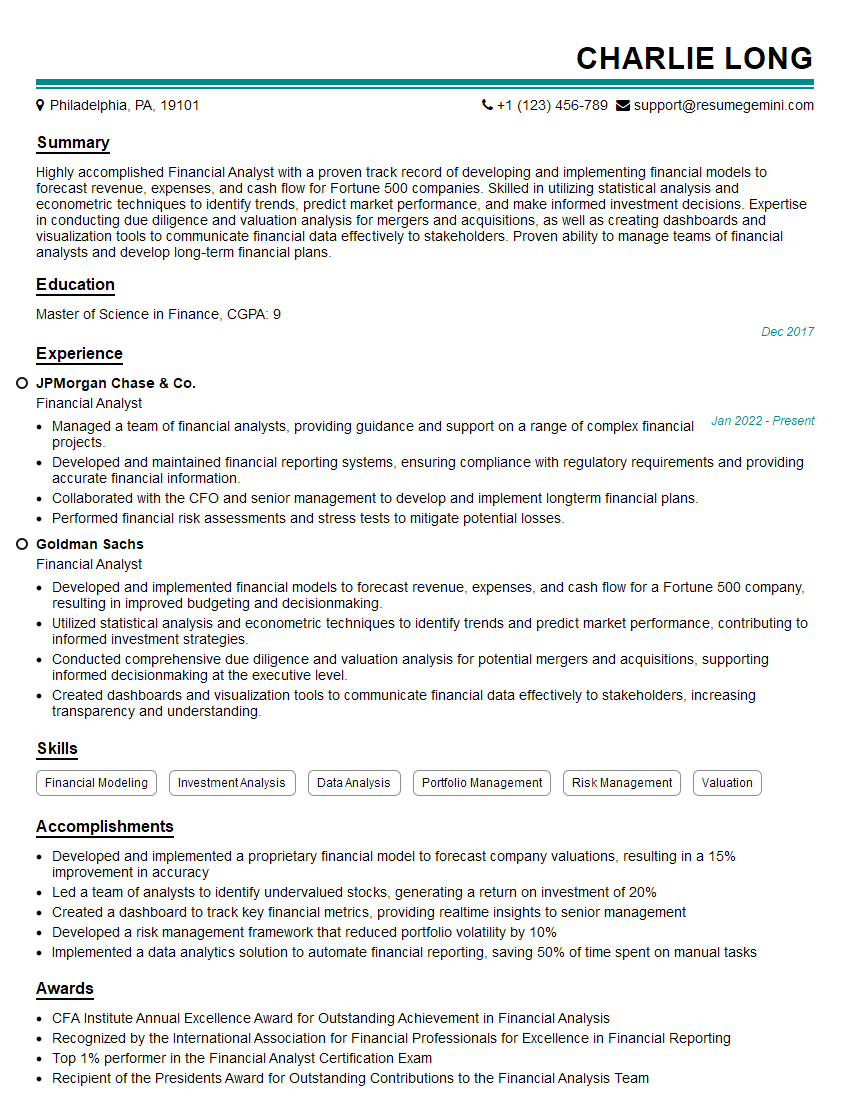
Financial Analyst Resume Sample
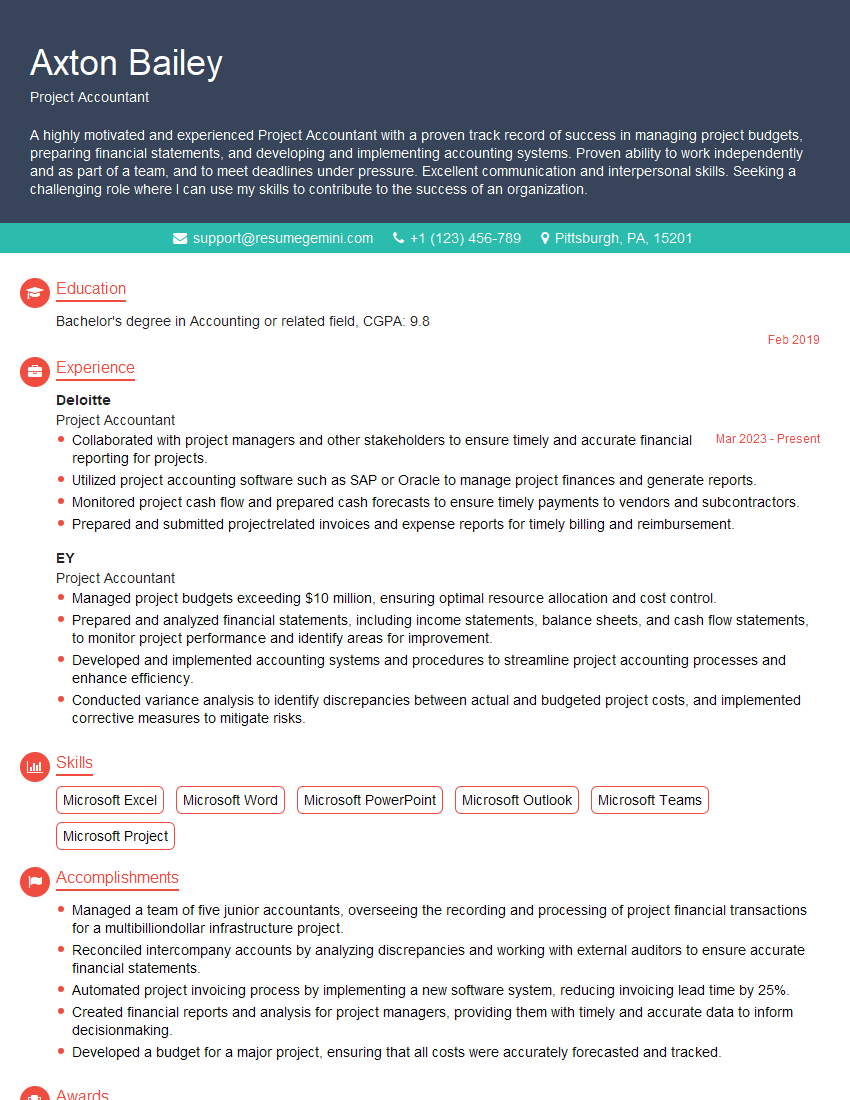
Project Accountant Resume Sample
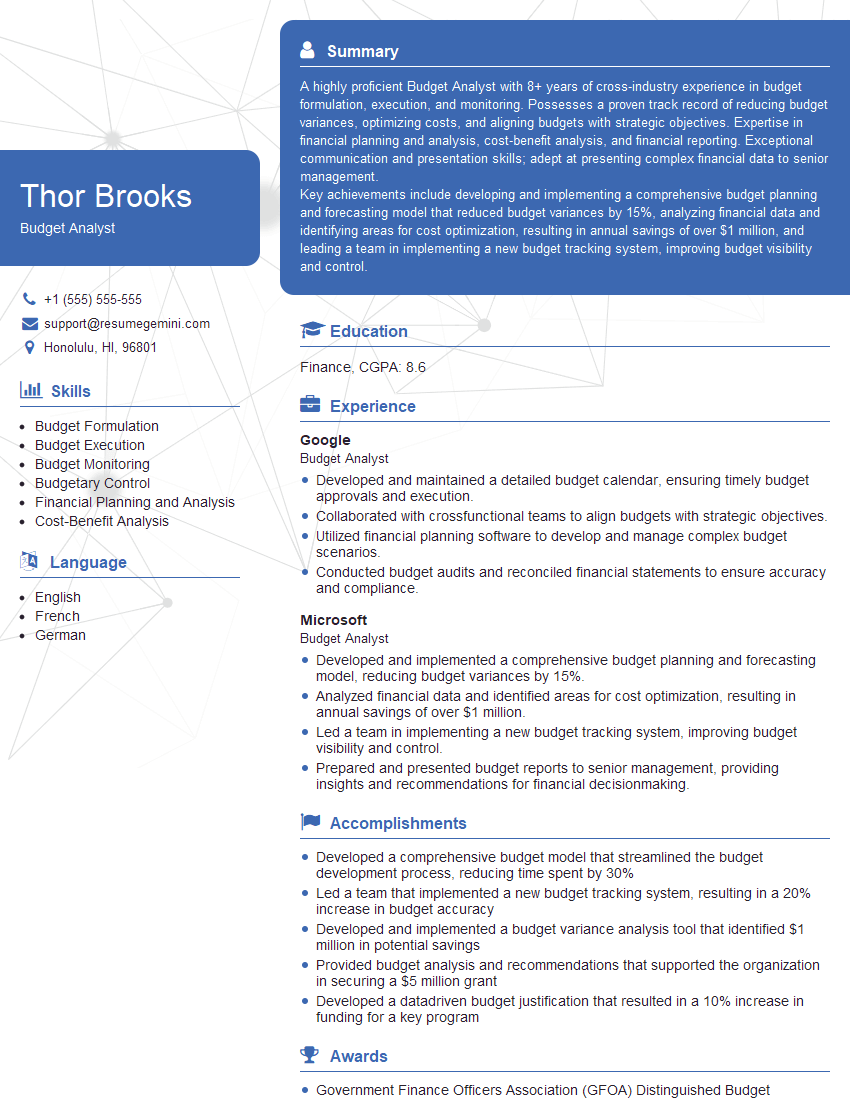
Budget Analyst Resume Sample
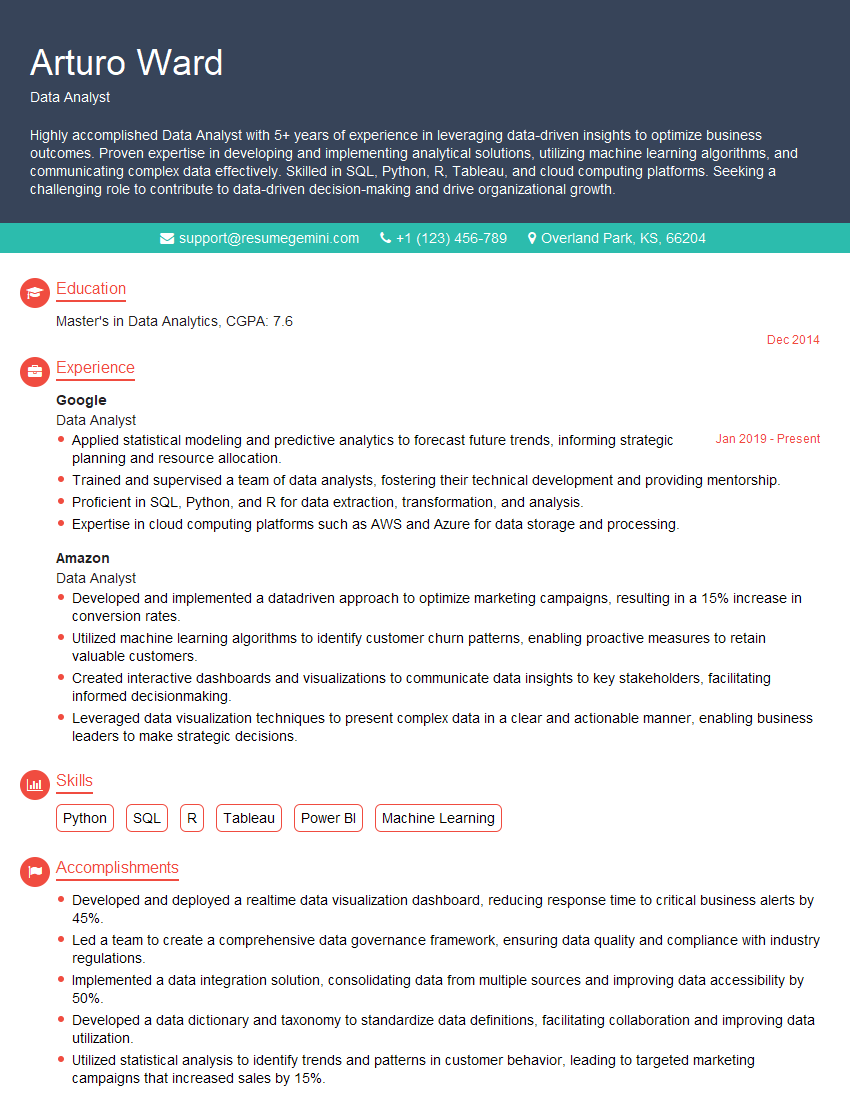
Data Analyst Resume Sample
Explore more articles
Users Rating of Our Blogs
Share Your Experience
We value your feedback! Please rate our content and share your thoughts (optional).
What Readers Say About Our Blog
To the interviewgemini.com Webmaster.
Very helpful and content specific questions to help prepare me for my interview!
Thank you
To the interviewgemini.com Webmaster.
This was kind of a unique content I found around the specialized skills. Very helpful questions and good detailed answers.
Very Helpful blog, thank you Interviewgemini team.