Cracking a skill-specific interview, like one for Freight Modeling, requires understanding the nuances of the role. In this blog, we present the questions you’re most likely to encounter, along with insights into how to answer them effectively. Let’s ensure you’re ready to make a strong impression.
Questions Asked in Freight Modeling Interview
Q 1. Explain the difference between deterministic and stochastic freight models.
The core difference between deterministic and stochastic freight models lies in how they treat uncertainty. A deterministic model assumes all parameters are known with certainty. Think of it like a perfectly predictable machine: input A always results in output B. In freight, this might mean assuming a constant travel time between two points, regardless of traffic or weather. This is a simplification, useful for initial analysis, but often unrealistic.
Conversely, a stochastic model incorporates randomness and variability into its parameters. It acknowledges that things like travel times, demand fluctuations, and equipment breakdowns are uncertain. We represent this uncertainty using probability distributions. For example, instead of a fixed travel time, a stochastic model might use a normal distribution, reflecting the likelihood of various travel times based on historical data. This allows for a more realistic and robust analysis, revealing potential risks and opportunities that a deterministic model would miss.
Example: Imagine modeling the delivery of packages from a warehouse. A deterministic model might assume each delivery takes exactly 30 minutes. A stochastic model would account for factors like traffic congestion (perhaps modeled with a triangular distribution), unexpected delays (using a Poisson distribution for random events), and driver variability (with a gamma distribution).
Q 2. Describe your experience with different freight modeling software (e.g., AnyLogic, Arena, Simio).
I have extensive experience with several freight modeling software packages, including AnyLogic, Arena, and Simio. My choice depends heavily on the project’s specifics. AnyLogic, for instance, excels at agent-based modeling, which is particularly valuable when simulating complex interactions between various actors in a transportation network, such as trucks, drivers, and customers. It’s especially well-suited for scenarios involving dynamic routing and decision-making.
Arena, on the other hand, is a powerful discrete-event simulation tool that’s strong in its statistical capabilities and ease of model verification. I’ve used it extensively for projects involving detailed analysis of warehouse operations, optimizing throughput and minimizing wait times. Finally, Simio offers a user-friendly interface and versatile modeling capabilities, making it ideal for rapid prototyping and exploring various ‘what-if’ scenarios quickly. I’ve found Simio particularly helpful in early-stage projects where we’re trying to quickly assess the feasibility of different approaches.
In my experience, the selection isn’t always about choosing ‘the best’ tool, but the tool that best matches the complexity of the problem and the client’s specific needs and technical capabilities. Frequently, I’ll utilize a combination of software to best solve the problem at hand.
Q 3. How do you handle data inconsistencies or missing data in freight modeling?
Data inconsistencies and missing data are common challenges in freight modeling. My approach is multi-faceted. First, I thoroughly investigate the sources of the data inconsistencies to identify and understand the root causes. This might involve discussions with stakeholders to understand data collection processes, or examining the data for patterns that might suggest errors or biases.
For missing data, I employ several techniques. If the missing data is relatively small, I might use imputation methods, such as mean, median, or mode imputation, or more sophisticated techniques like k-nearest neighbors or multiple imputation. The choice depends on the nature of the data and the potential impact of the imputation on the model’s accuracy. For larger gaps, I might consider using alternative data sources or adjusting the model scope to exclude data points with significant missing information.
Importantly, I always document my data handling choices, including any assumptions made, and analyze the potential sensitivity of the model results to different data imputation or handling strategies. Transparency and careful consideration are critical in ensuring model credibility.
Q 4. What are the key performance indicators (KPIs) you track in freight modeling projects?
The key performance indicators (KPIs) I track in freight modeling projects vary based on the specific goals, but commonly include:
- On-Time Delivery Rate: The percentage of shipments delivered on or before their scheduled time.
- Total Transportation Cost: The overall cost of moving goods, considering fuel, labor, and other expenses.
- Average Transportation Time: The average time taken to move shipments from origin to destination.
- Vehicle Utilization Rate: The percentage of time vehicles are actively transporting goods.
- Inventory Turnover Rate: The rate at which inventory is sold and replenished.
- Customer Satisfaction: Measured through surveys or other feedback mechanisms.
- Warehouse Throughput: The amount of goods processed by a warehouse in a given period.
- Number of Shipments: Simple metric to track project volume.
By tracking these KPIs, I can assess the effectiveness of different transportation strategies, identify areas for improvement, and optimize the overall efficiency of the freight system.
Q 5. Explain the concept of network optimization in freight transportation.
Network optimization in freight transportation focuses on designing and managing the most efficient network possible for moving goods. This involves finding the optimal routes, schedules, and modes of transport to minimize costs, delivery times, and other relevant metrics. Think of it like mapping out the most efficient highway system for a country – you want to minimize congestion while maximizing the ability to transport goods from any origin to any destination.
This often involves complex algorithms and mathematical models, such as linear programming, integer programming, and metaheuristics. Techniques like vehicle routing problem (VRP) algorithms, which determine the most efficient routes for a fleet of vehicles to serve multiple customers, are central to network optimization. Consideration must also be given to the selection of transportation modes – balancing speed (air freight), cost (trucking), and capacity (rail or sea).
Example: A company might use network optimization to determine the optimal locations for its warehouses, considering factors such as proximity to customers, transportation costs, and available infrastructure. This would minimize the overall distance goods have to travel and consequently reduce transportation costs and delivery times.
Q 6. How do you validate the accuracy of your freight models?
Validating the accuracy of freight models is a crucial step. I typically employ a combination of techniques:
- Historical Data Comparison: I compare model outputs (e.g., predicted delivery times, costs) against historical data to assess the model’s ability to accurately represent past performance.
- Sensitivity Analysis: I systematically vary model inputs (e.g., travel times, demand) to understand how sensitive the model’s outputs are to changes in these inputs. This helps identify areas of uncertainty and potential risks.
- Expert Review: I involve subject matter experts (e.g., logistics managers, transportation planners) in reviewing the model’s assumptions, structure, and outputs to ensure they align with real-world knowledge and experience.
- Real-World Pilot Testing: Where feasible, I might implement the model’s recommendations on a smaller scale before full-scale deployment, allowing me to directly observe the model’s performance in a real-world setting.
- Statistical Tests: Using statistical methods to compare the model outputs with actual results, for example calculating confidence intervals and using hypothesis testing to assess the significance of any differences.
The specific validation methods employed depend on the complexity of the model, the availability of data, and the resources available. The goal is to build confidence in the model’s ability to provide reliable and useful insights.
Q 7. Describe your experience with different types of transportation modes (truck, rail, air, sea).
My experience spans all major transportation modes: truck, rail, air, and sea. Each mode presents unique characteristics relevant to freight modeling.
- Truck: The most flexible and widely used mode, offering door-to-door service but with limitations on capacity and speed. Modeling often involves considerations of driver hours of service regulations, fuel consumption, and route optimization.
- Rail: High capacity but slower and less flexible than trucking. Modeling focuses on train scheduling, capacity constraints, and intermodal transfers.
- Air: The fastest but most expensive mode. Modeling emphasizes speed, cost considerations, and potential weather delays.
- Sea: Offers the highest capacity and lowest cost per unit but is the slowest. Modeling requires accounting for port congestion, vessel schedules, and potential disruptions from weather or geopolitical events.
Understanding the strengths and limitations of each mode is crucial for developing accurate and effective freight models. Often, the optimal solution involves integrating multiple modes, leveraging the advantages of each to create a robust and efficient transportation network. A well-designed model needs to reflect these complex interactions.
Q 8. How do you incorporate fuel costs and driver wages into your freight models?
Incorporating fuel costs and driver wages into freight models is crucial for accurate cost estimations and optimal route planning. We treat these as variable costs directly impacting the overall transportation expense.
Fuel Costs: These are typically modeled using fuel price forecasts and fuel consumption rates per mile, which vary depending on vehicle type, load weight, and terrain. For instance, a heavier load climbing a mountain will consume significantly more fuel than a lighter load on flat terrain. We often use regression models to predict fuel consumption based on historical data and external factors like fuel price indices. The formula might look something like this: Total Fuel Cost = Fuel Price per Gallon * Fuel Consumption Rate (gallons/mile) * Distance
Driver Wages: Driver wages are more complex. They include hourly rates, overtime pay, benefits (health insurance, retirement contributions), and potentially per-mile payments. We might use a cost per hour or per mile depending on the contract structure. For instance, if a driver is paid a flat rate per delivery, that becomes a fixed cost for that delivery. However, if they are paid hourly with overtime considerations, it requires a more dynamic model that accounts for the estimated time spent on the route.
Integration: Both fuel and wage components are added to the total cost function within the freight model. This allows us to evaluate various routes and compare their overall costs, ultimately identifying the most economically efficient option. We might also include things like tolls, maintenance costs, and potential delays as part of this comprehensive cost calculation.
Q 9. Explain your understanding of different routing algorithms (e.g., Dijkstra’s algorithm, A* search).
Routing algorithms are the backbone of efficient freight transportation. They determine the shortest or most cost-effective path between origin and destination points, considering various constraints.
- Dijkstra’s Algorithm: This algorithm finds the shortest path between nodes in a graph with non-negative edge weights. It’s conceptually straightforward: it iteratively explores nodes, assigning them tentative distances from the starting node, updating these distances as shorter paths are discovered. Imagine it like exploring a map, always choosing the closest unexplored location until the destination is reached. It’s great for situations with known and consistent travel times.
- A* Search: This is a more sophisticated algorithm that improves upon Dijkstra’s by using a heuristic function to estimate the distance to the goal. This heuristic guides the search, prioritizing nodes that seem more promising, leading to faster convergence compared to Dijkstra’s, particularly for large networks. Think of it as having a rough estimate of the remaining distance before reaching your destination – this estimation helps narrow down the search space and get you to your goal faster. It’s beneficial when dealing with complex networks or imprecise travel times.
Real-world Application: In freight modeling, we use these algorithms to find optimal routes for trucks, considering factors such as road distances, traffic conditions, speed limits, and delivery deadlines. The choice of algorithm depends on the specific problem. For simpler scenarios with reliable travel times, Dijkstra’s might suffice. However, for more complex situations involving real-time traffic updates or uncertain travel times, A* Search offers significant advantages.
Q 10. How do you address capacity constraints in freight modeling?
Capacity constraints are a major challenge in freight modeling. They represent limitations on the resources available, such as the number of trucks, the weight capacity of each truck, or the volume of goods each truck can carry. Ignoring these constraints can lead to unrealistic and infeasible solutions.
Addressing Capacity: We address capacity constraints through several techniques:
- Integer Programming: This mathematical optimization technique allows us to model the constraints directly. We use variables representing the number of trucks assigned to each route, ensuring that the total weight or volume carried doesn’t exceed the truck’s capacity and the overall capacity of the fleet is not surpassed.
- Constraint Programming: Similar to integer programming, this approach explicitly states the capacity constraints as part of the problem formulation. The solver then finds solutions that satisfy these constraints.
- Decomposition Techniques: For large-scale problems, decomposition methods break down the problem into smaller, more manageable subproblems, addressing capacity constraints within each subproblem and then coordinating the solutions.
Example: Suppose we have 5 trucks, each with a capacity of 10 tons, and we need to transport 40 tons of goods. The model must ensure that no more than 5 trucks are used and that no single truck carries more than 10 tons. Ignoring these constraints might lead to a solution suggesting the use of 8 trucks, which is not feasible.
Q 11. Describe your experience with forecasting freight demand.
Forecasting freight demand is vital for effective resource allocation and efficient planning. Accurately predicting future demand helps logistics companies optimize their fleet size, warehouse space, and workforce.
Methods: We employ various techniques depending on data availability and the forecasting horizon:
- Time Series Analysis: This approach uses historical freight data to identify patterns and trends. Methods like ARIMA (Autoregressive Integrated Moving Average) and Exponential Smoothing can be used to extrapolate these patterns into the future. For example, examining past years’ shipping volumes during peak seasons (like holidays) to project future demand.
- Regression Analysis: This statistical method identifies relationships between freight demand and other relevant factors, such as economic indicators (GDP growth), consumer spending, and seasonal effects. A model could predict demand based on anticipated economic growth in a region.
- Machine Learning: Advanced machine learning models, such as neural networks or random forests, can analyze large datasets encompassing various factors to generate highly accurate forecasts. These models can consider complex non-linear relationships impacting freight demand.
Data Sources: Data sources include historical shipping records, economic indicators, weather patterns, and even social media trends (indicating consumer behaviour). The quality of the forecast hinges on the availability and quality of this input data.
Q 12. How do you handle unexpected disruptions (e.g., weather events, traffic congestion) in your models?
Unexpected disruptions pose a significant challenge to freight operations. Incorporating the possibility of disruptions into freight models ensures robustness and resilience.
Strategies:
- Scenario Planning: We develop multiple scenarios to represent different levels of disruption severity (e.g., minor traffic congestion, severe weather event). The model assesses the impact of each scenario on the transportation plan. For example, simulating the impact of a highway closure or a major storm on a delivery schedule.
- Stochastic Modeling: Incorporating probabilistic elements into the model to reflect uncertainty. This includes using probability distributions to represent potential delays due to weather or traffic, allowing the model to generate solutions that are robust to unexpected events.
- Real-time Data Integration: Integrating real-time data feeds (e.g., GPS tracking of vehicles, traffic information, weather forecasts) to dynamically adjust routes and schedules as disruptions occur. This adaptive approach can reroute trucks around traffic congestion or re-optimize deliveries to account for unforeseen delays.
Example: If a weather event is forecast, the model could re-route trucks to avoid affected areas, potentially increasing travel time but ensuring successful delivery.
Q 13. What are the limitations of freight modeling?
Freight modeling, despite its power, has several limitations:
- Data Availability and Quality: Accurate models require high-quality, comprehensive data, which isn’t always available. Inaccurate or incomplete data can lead to flawed forecasts and suboptimal solutions. This is especially relevant for less-traveled routes or new transportation networks.
- Model Simplification: Real-world freight transportation is incredibly complex. Models often simplify aspects of the system (like driver behavior or unpredictable events) to make calculations manageable, potentially sacrificing some accuracy.
- Computational Complexity: Optimizing large-scale freight networks can be computationally expensive, particularly when dealing with complex constraints and uncertain parameters. This limits the scalability of some models.
- Unforeseen Events: Models can’t anticipate all possible disruptions. Unforeseen events (e.g., accidents, political instability) can significantly impact transportation plans, highlighting the limitations of predictive modeling.
It’s crucial to acknowledge these limitations when interpreting model results and to consider them as decision-support tools rather than definitive predictors.
Q 14. How do you communicate complex modeling results to non-technical stakeholders?
Communicating complex modeling results to non-technical stakeholders requires clear, concise, and visually appealing presentations. Avoid jargon and focus on the key insights.
Effective Communication Techniques:
- Visualizations: Use charts, graphs, and maps to illustrate key findings. For example, a map showing optimal routes or a bar chart comparing the cost of different transportation strategies. This instantly translates complex information into digestible visuals.
- Storytelling: Frame the results within a narrative, highlighting the problem addressed, the methodology used, and the key conclusions. A story-driven presentation makes the information more engaging and easier to understand.
- Simplified Language: Avoid technical terms whenever possible. Explain concepts using analogies and real-world examples relatable to the audience’s experience. For example, comparing routing algorithms to finding the shortest path on a road map.
- Interactive Dashboards: Develop interactive dashboards that allow stakeholders to explore different scenarios and understand the impact of various factors on the freight transportation system. This hands-on approach fosters understanding and engagement.
By focusing on clear communication and visual aids, we ensure stakeholders understand the implications of the model’s findings and can make informed decisions.
Q 15. Explain your experience with sensitivity analysis in freight modeling.
Sensitivity analysis in freight modeling is crucial for understanding how changes in input parameters affect the model’s output, such as total cost or delivery time. It helps us identify the most influential factors and assess the robustness of our model’s predictions.
In practice, I typically use a ‘what-if’ approach. For instance, I might systematically vary fuel prices, transportation times, or demand levels within a reasonable range. I then observe the resulting changes in total freight cost or on-time delivery percentages. This might involve creating multiple scenarios, each with different parameter settings. I often use data visualization tools to graphically represent the results, making it easy to identify the parameters with the most significant impact. For example, if a small change in fuel price leads to a large increase in total cost, it suggests that fuel price is a critical factor to monitor and potentially mitigate.
Imagine a scenario where we’re modeling the transportation of goods across the country. Through sensitivity analysis, we might find that fuel costs are far more influential than driver wages on the overall cost, allowing us to focus our risk mitigation strategies appropriately.
Career Expert Tips:
- Ace those interviews! Prepare effectively by reviewing the Top 50 Most Common Interview Questions on ResumeGemini.
- Navigate your job search with confidence! Explore a wide range of Career Tips on ResumeGemini. Learn about common challenges and recommendations to overcome them.
- Craft the perfect resume! Master the Art of Resume Writing with ResumeGemini’s guide. Showcase your unique qualifications and achievements effectively.
- Don’t miss out on holiday savings! Build your dream resume with ResumeGemini’s ATS optimized templates.
Q 16. How do you optimize for both cost and service level in freight transportation?
Optimizing for both cost and service level in freight transportation is a classic multi-objective optimization problem. It’s rarely a simple matter of minimizing one while ignoring the other. A balanced approach is crucial. My approach usually involves a combination of techniques:
- Weighted Objective Function: I assign weights to cost and service level (e.g., on-time delivery percentage) reflecting their relative importance. A higher weight for cost prioritizes minimizing expenses, while a higher weight for service level focuses on reliable delivery. This combined objective function is then optimized using suitable algorithms.
- Pareto Optimization: If no single optimal solution exists (which is often the case), Pareto optimization identifies a set of non-dominated solutions. Each solution in this set represents a trade-off between cost and service level. This enables decision-makers to choose a solution that best aligns with their specific priorities.
- Scenario Planning: I often create multiple scenarios with different levels of service expectations, each with its corresponding optimal solution. This provides decision-makers with a range of options and the associated cost implications.
For instance, one scenario might prioritize speed of delivery (higher service level, potentially higher cost), while another prioritizes minimizing the total cost (lower service level, possibly longer transit times). Presenting these options enables stakeholders to make informed choices based on their specific business needs.
Q 17. Describe your experience with different types of freight (LTL, FTL, parcel).
My experience encompasses all three – LTL (Less-than-Truckload), FTL (Full Truckload), and Parcel shipping – each requiring a distinct modeling approach.
- LTL: Modeling LTL requires considering consolidation and network optimization. The focus is on efficiently combining shipments from multiple shippers to utilize truck space effectively. Factors like loading/unloading times and hub-and-spoke network structures are crucial for accurate LTL cost and time estimations. I’ve used specialized LTL routing software and algorithms to achieve this.
- FTL: FTL modeling is relatively simpler in that it involves dedicated trucks for specific shipments. However, it still necessitates efficient route planning, considering factors like distance, road conditions, and driver availability. I often employ techniques like vehicle routing algorithms (VRP) to optimize FTL routes.
- Parcel: Parcel shipping, especially high-volume e-commerce shipping, involves high-throughput and sophisticated network optimization. The focus is on optimizing delivery routes, considering factors like package dimensions, weight, and delivery deadlines. Dimensional weight calculation plays a critical role in accurate cost estimation. I have extensive experience using parcel shipping APIs and software to model this type of freight.
The key difference lies in scale and complexity. LTL involves complex network optimization, FTL focuses on efficient routing, and parcel shipping emphasizes high-throughput and last-mile delivery optimization.
Q 18. How do you select appropriate model parameters and assumptions?
Selecting appropriate model parameters and assumptions is paramount for model accuracy and reliability. It’s a critical step requiring deep understanding of the freight transportation domain.
- Data Analysis: I begin by thoroughly analyzing historical data, including shipment data, transportation costs, delivery times, fuel prices, and weather patterns. This data informs the parameter values and distribution functions used in the model.
- Domain Expertise: My industry experience plays a vital role. I leverage my knowledge of industry best practices, regulations, and operational realities to make informed assumptions about aspects not directly reflected in data, like driver behavior or unforeseen delays.
- Sensitivity Analysis: As mentioned previously, I use sensitivity analysis to test the impact of changes in model parameters on the results. This step helps identify critical parameters and assumptions requiring more detailed investigation and ensures the model’s robustness.
- Validation and Calibration: I validate the model by comparing its outputs against real-world data. Calibration involves adjusting parameters to improve the model’s accuracy and fit to historical data.
For example, when modeling fuel consumption, I might use historical data to inform the baseline but incorporate expert knowledge to adjust for potential future fuel price fluctuations and variations in driving conditions.
Q 19. Explain your experience with Monte Carlo simulation in freight modeling.
Monte Carlo simulation is an invaluable tool in freight modeling, particularly when dealing with uncertainty. It allows us to account for the probabilistic nature of many factors, improving the reliability of predictions.
In a typical application, I might use Monte Carlo simulation to model the variability in transit times due to traffic congestion or unforeseen weather events. I define probability distributions for these uncertain variables (e.g., a normal distribution for transit times, a triangular distribution for fuel prices). The simulation then repeatedly samples from these distributions to create many different scenarios. Each scenario generates a unique outcome for the key performance indicators (KPIs) like total cost and on-time delivery rate. The results are then aggregated to provide a probability distribution of the KPIs, rather than a single point estimate. This distribution shows the range of possible outcomes and the associated probabilities, providing a richer and more realistic understanding of the situation.
Imagine predicting the total cost of a freight shipment. Instead of providing a single cost estimate, a Monte Carlo simulation could show a range of costs and their respective probabilities, such as a 70% chance the cost will fall within a certain range and a 30% chance it will exceed that range, giving a much more nuanced understanding of the risk involved.
Q 20. How do you incorporate risk management into your freight modeling projects?
Risk management is integrated throughout my freight modeling projects. It’s not an afterthought, but a fundamental consideration.
- Identifying Risks: I start by identifying potential risks that can impact freight operations. This includes supply chain disruptions, fuel price volatility, driver shortages, weather events, and regulatory changes.
- Quantifying Risks: Using Monte Carlo simulation or other probabilistic methods, I quantify the likelihood and potential impact of each identified risk. This provides a measure of the potential financial or operational consequences.
- Mitigation Strategies: Based on the risk assessment, I develop and evaluate various mitigation strategies. These might involve diversifying transportation modes, securing fuel contracts, investing in better forecasting, or implementing contingency plans.
- Scenario Planning: I often create scenarios that simulate different risk events (e.g., a major port closure, extreme weather). This allows for proactive planning and the development of resilient strategies.
- Sensitivity Analysis: This helps identify the most critical risks and understand the model’s sensitivity to those risks.
For example, if my model reveals high sensitivity to fuel price fluctuations, I would recommend strategies to hedge against fuel price increases, such as securing long-term fuel contracts.
Q 21. Describe your experience with different optimization techniques (e.g., linear programming, integer programming).
I have extensive experience with various optimization techniques, particularly linear programming (LP) and integer programming (IP).
- Linear Programming (LP): LP is well-suited for problems where the objective function and constraints are linear. In freight modeling, LP can be used to optimize transportation routes, warehouse allocation, and vehicle scheduling, as long as the assumptions of linearity hold. For example, minimizing transportation costs subject to constraints on truck capacity and delivery deadlines can be effectively modeled using LP.
- Integer Programming (IP): IP extends LP to scenarios where some or all decision variables must be integers. This is crucial in many freight problems. For instance, deciding how many trucks to allocate to a particular route cannot be a fractional value. IP allows us to model such situations more accurately.
- Other techniques: Depending on the problem’s complexity, I may also employ other techniques, such as metaheuristics (e.g., genetic algorithms, simulated annealing) for large-scale, complex optimization challenges where traditional LP or IP solvers struggle to find optimal solutions in a reasonable timeframe.
The choice of optimization technique depends heavily on the specific problem and the nature of the constraints. For example, a simple vehicle routing problem with a small number of locations might be effectively solved using LP, while a more complex problem with many locations and intricate constraints might require the more powerful capabilities of IP or a metaheuristic approach.
Q 22. How do you handle dynamic pricing in your freight models?
Dynamic pricing in freight modeling involves incorporating real-time factors like fuel costs, market demand, and competition to optimize pricing strategies. It’s not a simple flat rate; instead, it’s a constantly adjusting algorithm. Think of it like airline tickets – prices fluctuate based on how many seats are left and how close the flight is.
I handle this using a multi-faceted approach. First, I integrate external data sources providing real-time fuel prices, weather forecasts impacting delivery times, and market indices reflecting supply and demand. Then, I build predictive models – often using machine learning techniques like regression analysis or neural networks – to forecast future demand and costs. Finally, I implement a pricing engine that uses these forecasts to dynamically adjust rates, optimizing for profitability while remaining competitive. For example, if fuel prices suddenly spike, the model would automatically adjust prices upward to maintain margins while accounting for potential competitor reactions.
A crucial aspect is setting parameters to control price fluctuations. This prevents wildly erratic pricing and ensures stable business operations. We might set upper and lower price bounds, adjust prices gradually rather than abruptly, or prioritize maintaining certain customer relationships even if it means slightly lower margins in some cases.
Q 23. What is your experience with warehouse management system (WMS) data integration?
My experience with WMS data integration is extensive. I’ve successfully integrated data from various WMS systems – including Manhattan Associates, Blue Yonder, and Oracle – into freight models to enhance accuracy and efficiency. This integration allows for real-time visibility into inventory levels, order fulfillment status, and warehouse throughput.
The integration process typically involves establishing secure data connections using APIs or ETL (Extract, Transform, Load) processes. Data cleaning and transformation are critical steps to ensure consistency and compatibility with the freight modeling software. For example, ensuring consistent unit of measure (e.g., kilograms vs. pounds) across different systems is crucial. Once integrated, the data provides valuable insights for optimizing warehouse operations, shipment planning, and route optimization. For instance, knowing the precise location of goods within a warehouse allows for more accurate shipment planning and faster turnaround times.
Example: An API call might retrieve data on pending orders, including product dimensions and weight, which are vital inputs for calculating transportation costs and determining the most efficient route.Q 24. How do you evaluate the efficiency of different transportation networks?
Evaluating the efficiency of transportation networks requires a holistic approach, considering various metrics. I typically use a combination of quantitative and qualitative methods.
- Cost Analysis: Comparing total transportation costs (including fuel, labor, and infrastructure) across different networks. This includes evaluating both fixed and variable costs.
- Time Analysis: Measuring the transit time for shipments, considering factors like delivery speed and on-time performance.
- Capacity Analysis: Assessing the network’s ability to handle current and future volumes, including potential bottlenecks or congestion points.
- Reliability Analysis: Evaluating the consistency of delivery performance across various conditions. This might include analyzing on-time delivery rates and shipment failure rates.
- Sustainability Analysis: Considering the environmental impact of the network. This can involve measuring carbon emissions and waste generation.
For example, I might use network optimization algorithms to simulate different transportation network scenarios, comparing their performance across these key metrics. This allows for data-driven decision-making to identify the most efficient and cost-effective network configuration.
Q 25. Explain your experience using statistical software packages (e.g., R, Python).
I’m proficient in both R and Python for freight modeling. R is particularly useful for statistical modeling and data visualization. I’ve extensively used packages like ggplot2 for creating insightful charts and graphs to communicate findings to stakeholders. Python, on the other hand, offers more versatility in terms of data manipulation, web scraping, and integration with other systems. Libraries such as pandas, NumPy, and scikit-learn are essential tools in my workflow.
For instance, I recently used Python to build a machine learning model that predicted freight demand based on historical sales data and economic indicators. This model helped a client optimize their fleet size and reduce transportation costs. In R, I’ve developed custom functions to analyze large datasets and generate reports detailing key performance indicators (KPIs) for various transportation modes.
Example (Python): import pandas as pd; data = pd.read_csv('freight_data.csv'); #Loads data for analysisQ 26. How do you measure the return on investment (ROI) of freight modeling projects?
Measuring the ROI of freight modeling projects requires careful consideration of both costs and benefits. The cost side includes the initial investment in software, data acquisition, and consulting fees. The benefits can be more complex and require a thorough evaluation. I use a multi-stage approach.
- Cost Savings: Quantifying the reduction in transportation costs, warehousing costs, or inventory holding costs. This is typically the most significant benefit.
- Efficiency Gains: Measuring improvements in delivery times, on-time performance, or reduced fuel consumption. These are translated into cost savings or revenue improvements.
- Revenue Increase: Assessing any increases in sales or revenue resulting from improved service levels or supply chain agility.
- Risk Reduction: Evaluating the reduction in potential losses due to disruptions, delays, or stockouts.
I then calculate the ROI using a standard formula: (Total Benefits - Total Costs) / Total Costs. It’s crucial to use a realistic timeframe (e.g., 3-5 years) for calculating ROI and to account for potential uncertainties.
Q 27. Describe a time you had to make a significant change to a freight model during a project.
In a recent project for a major retailer, we initially modeled their transportation network using a deterministic approach, assuming stable demand and predictable transit times. However, during implementation, we encountered significant variability in demand due to unexpected promotional events and unforeseen weather disruptions. This caused the model to be inaccurate and ineffective.
We responded by transitioning to a stochastic model that incorporated probabilistic elements, accounting for the uncertainty in demand and transit times. This involved using Monte Carlo simulations to generate a range of potential scenarios and assessing their impact on the network. The updated model significantly improved accuracy and provided more robust recommendations for fleet planning and route optimization. This switch required extra time and resources but ultimately saved the client significant costs by better handling unexpected disruptions and demand fluctuations.
Q 28. How do you stay up-to-date with the latest trends and technologies in freight modeling?
Staying current in freight modeling requires a proactive approach. I regularly attend industry conferences and webinars, read relevant publications (academic journals and industry magazines), and actively participate in online forums and communities.
I also leverage online resources such as research databases (e.g., ScienceDirect, Scopus) to access the latest research papers. Following key influencers and thought leaders on social media (LinkedIn, Twitter) provides insights into emerging trends. Exploring open-source tools and libraries helps me stay ahead of technological advancements. Finally, engaging in continuous learning through online courses and workshops on topics like machine learning, optimization algorithms, and supply chain management keeps my skillset sharp and adaptable to the ever-evolving landscape of freight modeling.
Key Topics to Learn for Freight Modeling Interview
- Network Optimization: Understanding algorithms and techniques for optimizing transportation networks, including route planning and fleet management. Practical application: Designing efficient delivery routes to minimize transportation costs.
- Demand Forecasting: Applying statistical methods to predict future freight demand. Practical application: Accurately estimating future shipping volumes to optimize resource allocation.
- Cost Modeling: Developing models to estimate and analyze various transportation costs, considering fuel, labor, and infrastructure. Practical application: Identifying cost-saving opportunities within existing logistics operations.
- Freight Rate Analysis: Analyzing market trends and pricing strategies to determine optimal freight rates. Practical application: Negotiating favorable contracts with carriers and optimizing pricing strategies.
- Simulation and Modeling Software: Proficiency in using software tools for freight modeling and simulation (mentioning specific software is optional, focus on the concept). Practical application: Creating realistic simulations to test different scenarios and optimize logistics strategies.
- Data Analysis and Visualization: Extracting insights from large datasets to inform decision-making. Practical application: Using data visualization techniques to present complex findings clearly to stakeholders.
- Risk Management: Identifying and mitigating potential risks in freight transportation, such as delays, disruptions, and unforeseen costs. Practical application: Developing contingency plans to minimize the impact of disruptions on supply chains.
Next Steps
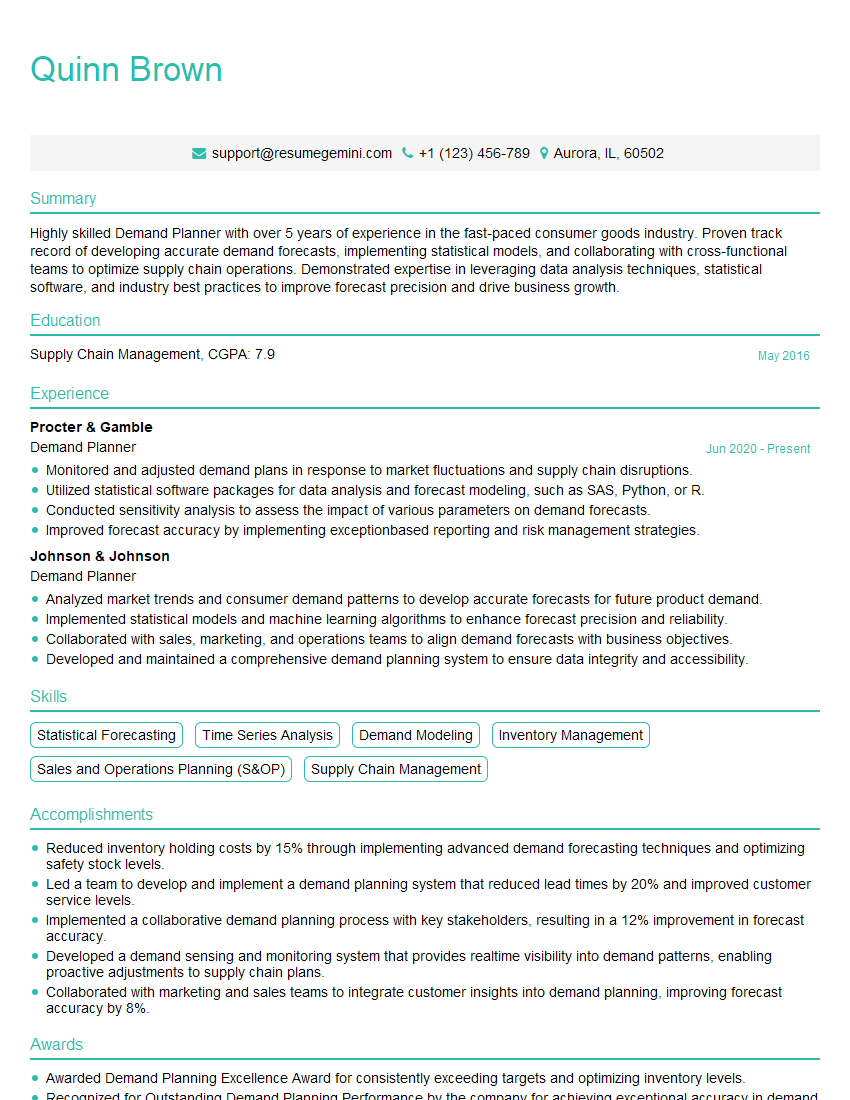
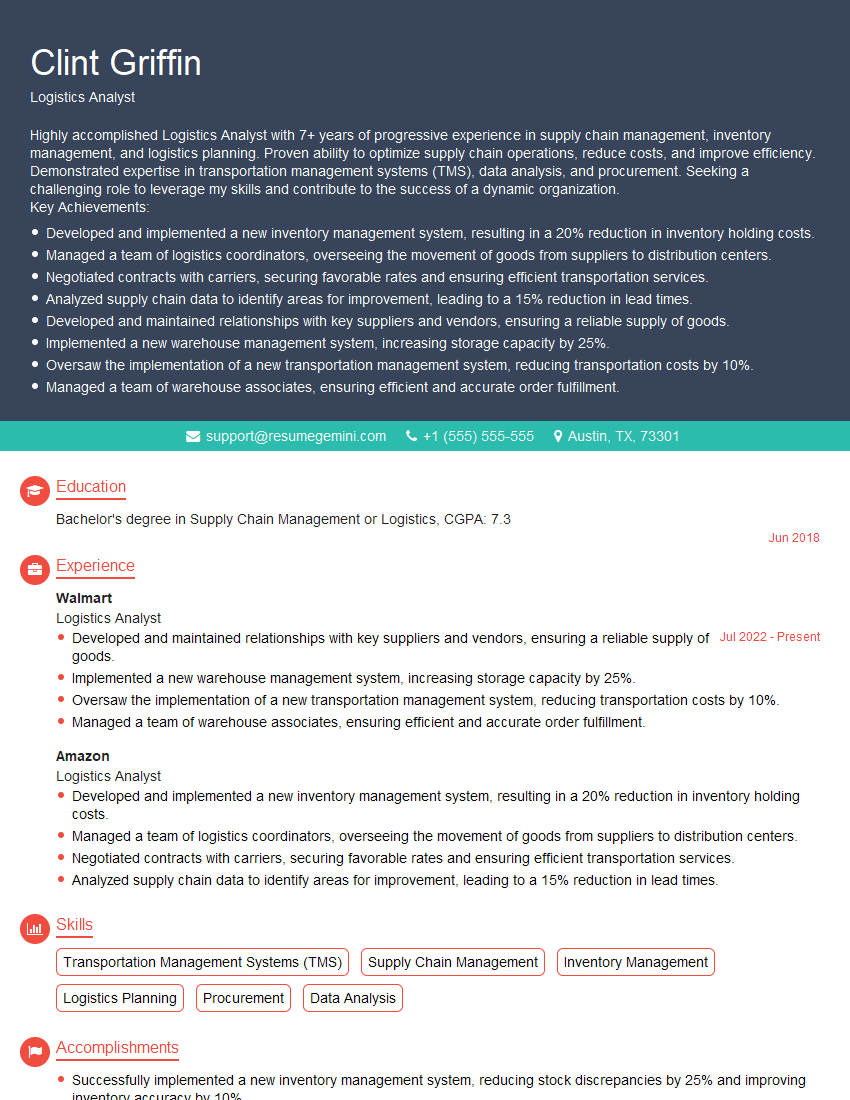
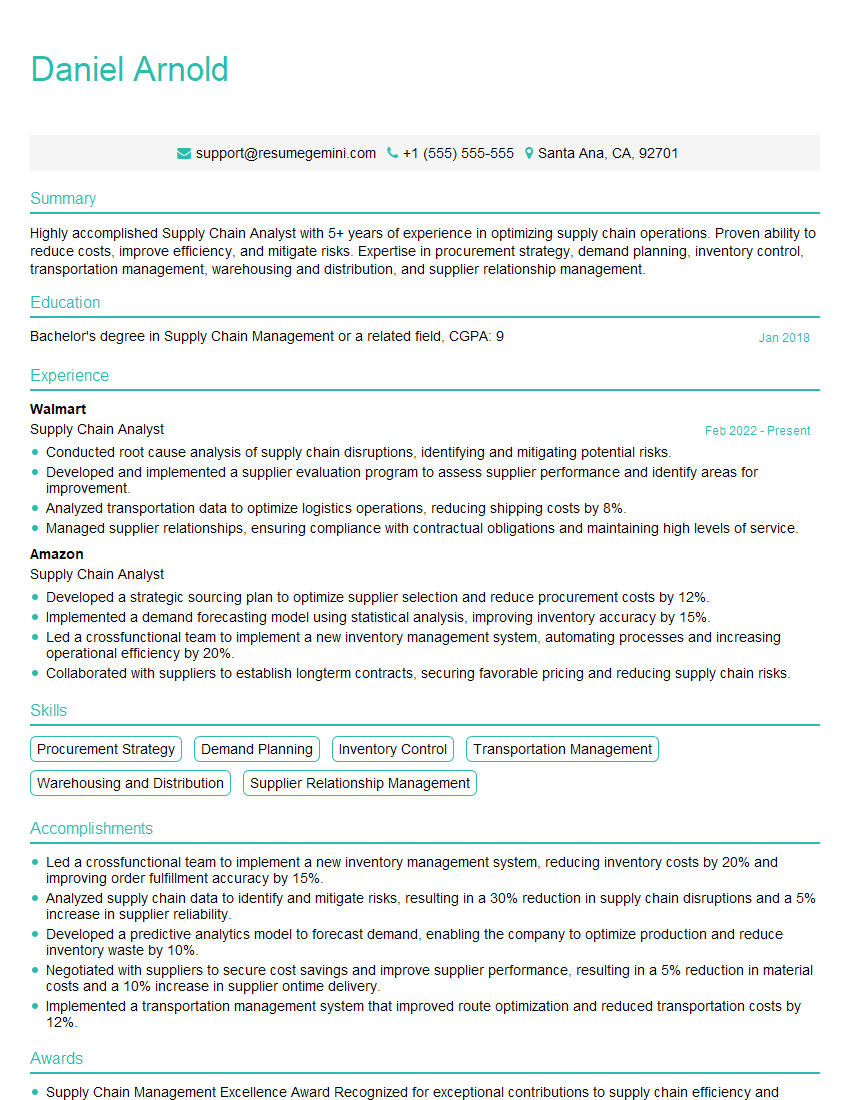
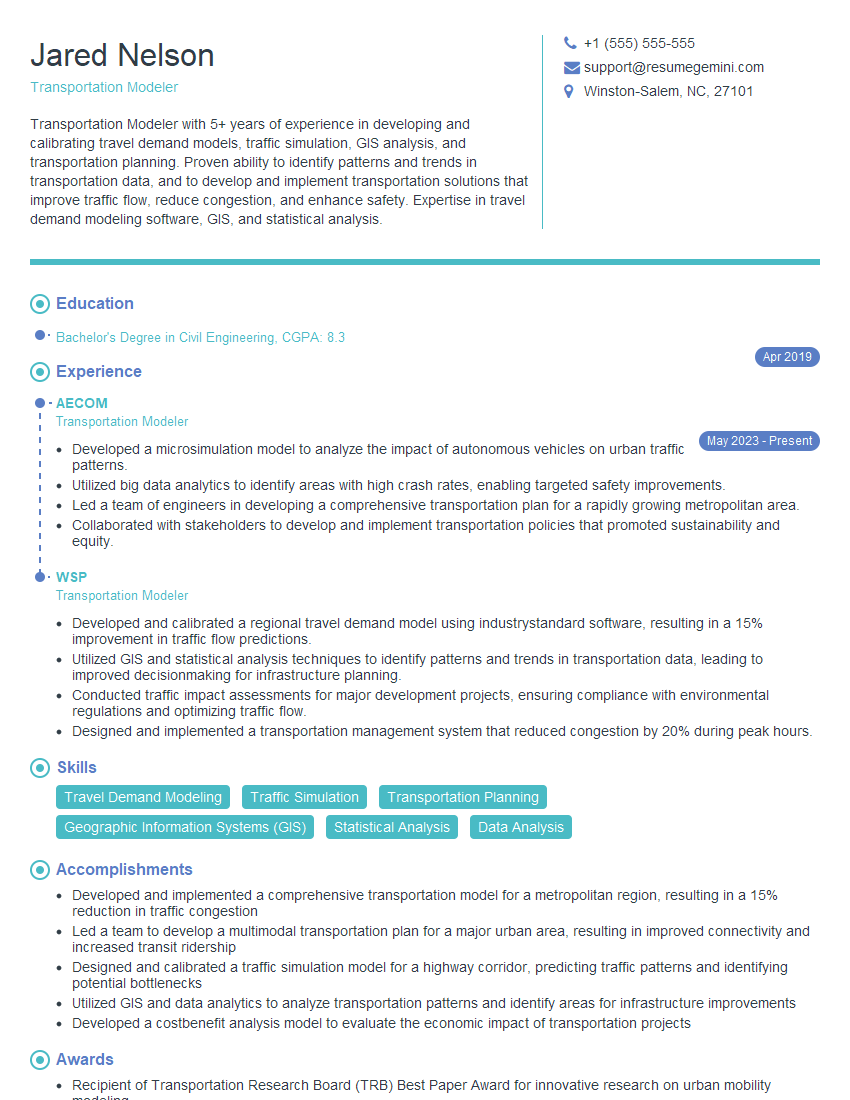
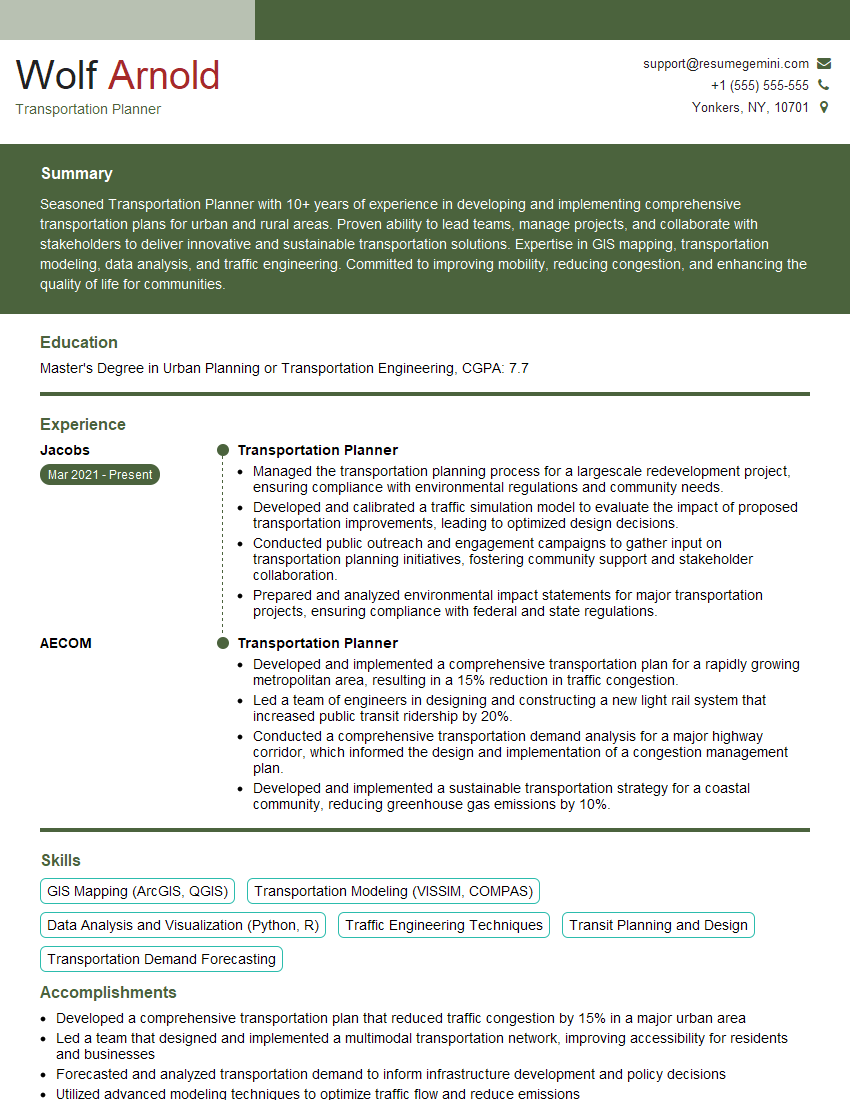
Mastering freight modeling opens doors to exciting career opportunities in logistics, supply chain management, and transportation planning, offering higher earning potential and greater professional responsibility. To maximize your job prospects, it’s crucial to create a compelling, ATS-friendly resume that highlights your skills and experience effectively. ResumeGemini is a trusted resource that can help you build a professional resume that stands out. We provide examples of resumes tailored specifically to Freight Modeling to guide you through the process. Invest time in crafting a strong resume; it’s your first impression on potential employers.
Explore more articles
Users Rating of Our Blogs
Share Your Experience
We value your feedback! Please rate our content and share your thoughts (optional).
What Readers Say About Our Blog
To the interviewgemini.com Webmaster.
Very helpful and content specific questions to help prepare me for my interview!
Thank you
To the interviewgemini.com Webmaster.
This was kind of a unique content I found around the specialized skills. Very helpful questions and good detailed answers.
Very Helpful blog, thank you Interviewgemini team.