Are you ready to stand out in your next interview? Understanding and preparing for Demographic Impact Assessment interview questions is a game-changer. In this blog, we’ve compiled key questions and expert advice to help you showcase your skills with confidence and precision. Let’s get started on your journey to acing the interview.
Questions Asked in Demographic Impact Assessment Interview
Q 1. Explain the key stages involved in a typical Demographic Impact Assessment.
A Demographic Impact Assessment (DIA) systematically evaluates how a policy, project, or program will affect a population’s size, structure, and distribution. It’s a crucial step in responsible planning, ensuring that initiatives don’t inadvertently create inequalities or exacerbate existing social problems.
- Scoping and Defining Objectives: This initial stage clearly outlines the project’s goals and the specific demographic factors to be assessed. For example, a new housing development’s DIA might focus on its impact on school enrollment, healthcare demand, and overall population density.
- Data Collection and Analysis: This involves gathering relevant demographic data from various sources (discussed in the next answer). This data is then analyzed to establish baseline conditions and predict future changes based on the proposed initiative.
- Impact Prediction: Using appropriate methodologies (like population projection models), the assessment predicts the likely demographic changes resulting from the project. This might involve forecasting changes in birth rates, migration patterns, or age structures.
- Mitigation and Adaptation Strategies: Based on the predicted impacts, this stage identifies potential negative consequences and proposes strategies to mitigate them or adapt to the changes. For example, if a new factory is projected to increase the population, the DIA might recommend building a new school or expanding healthcare facilities.
- Reporting and Communication: The final stage involves compiling the findings into a comprehensive report, communicating the results to stakeholders, and incorporating feedback to refine the assessment or project plans.
Q 2. Describe different data sources used in Demographic Impact Assessment.
Demographic Impact Assessments draw on a variety of data sources, each providing different perspectives on the population. The choice of data sources depends on the specific context of the assessment and the availability of information.
- Census Data: Provides a comprehensive overview of the population’s size, distribution, age, sex, and other key characteristics at a national, regional, or local level. It’s typically the cornerstone of a DIA.
- Vital Registration Data: Records of births, deaths, and marriages offer insights into population dynamics, fertility rates, and mortality patterns. These are crucial for projecting future population changes.
- Migration Data: Internal migration data (movement within a country) and international migration statistics help understand population flows and their influence on local demographics.
- Household Surveys: Surveys like the American Community Survey (ACS) or similar national surveys provide valuable information on household characteristics, income, education, and other socio-economic factors that can indirectly impact demographics.
- Administrative Data: Data from government agencies, such as school enrollment records, healthcare utilization statistics, or employment records, provide valuable context and can help validate findings from other sources.
- Geographic Information Systems (GIS) Data: GIS data provides spatial context for demographic information, allowing for detailed mapping and analysis of population distribution and density. It’s invaluable for visualizing the geographical impact of a project.
Q 3. How do you handle data limitations or missing data in a DIA?
Data limitations and missing data are common challenges in DIA. Handling them effectively requires careful planning and a combination of strategies.
- Data Imputation: For missing data points, techniques like mean imputation (replacing missing values with the average of available data), regression imputation (predicting missing values based on correlations with other variables), or multiple imputation (creating multiple plausible versions of the dataset with imputed values) can be employed. The choice of technique depends on the nature and extent of the missing data.
- Sensitivity Analysis: Assessing the impact of data uncertainty on the results is crucial. This involves running the analysis with different assumptions about the missing data or using different imputation methods to assess the robustness of the findings.
- Alternative Data Sources: If data is unavailable from primary sources, explore secondary sources like academic publications, government reports, or related studies. It’s important to carefully assess the reliability and validity of these alternative data sources.
- Qualitative Methods: In some cases, supplementing quantitative data with qualitative methods like focus groups or key informant interviews can offer valuable insights and fill gaps where quantitative data is missing or unreliable.
- Transparency and Reporting: Clearly document any limitations in the data, methods used to address these limitations, and the potential implications for the overall assessment’s validity. This transparency builds trust and enhances the credibility of the DIA.
Q 4. What are the ethical considerations in conducting a Demographic Impact Assessment?
Ethical considerations are paramount in conducting a DIA. The assessment must be conducted with integrity, fairness, and respect for the rights and dignity of the individuals and communities affected.
- Confidentiality and Data Protection: Ensure the confidentiality of individual-level data and comply with all relevant data protection regulations. Anonymize or aggregate data wherever possible to prevent the identification of individuals.
- Bias and Representation: Be mindful of potential biases in data collection and analysis, and ensure that all relevant groups within the population are represented accurately in the assessment. Avoid making generalizations or stereotyping specific groups.
- Informed Consent: Obtain informed consent from participants in any surveys or interviews conducted as part of the DIA. Clearly explain the purpose of the assessment, how the data will be used, and the participants’ rights.
- Transparency and Stakeholder Engagement: Involve stakeholders throughout the DIA process, ensuring transparency in methods, findings, and decision-making. Provide opportunities for stakeholders to review the assessment and provide feedback.
- Equity and Social Justice: Consider the potential impact of the assessment and any associated projects on different social groups. Strive to ensure that the project does not exacerbate existing inequalities or create new ones.
Q 5. Explain the difference between direct and indirect demographic impacts.
Direct and indirect demographic impacts are distinct ways a project or policy affects the population.
- Direct Impacts: These are immediate and readily observable effects on population characteristics. For example, a new housing development directly increases the population size in that area. The construction of a new hospital might directly increase the number of healthcare workers living nearby.
- Indirect Impacts: These are secondary or consequential effects that are not as immediately obvious. For example, the new housing development might indirectly lead to increased demand for schools and infrastructure, influencing birth rates over time as families move into the area. The new hospital might indirectly attract other medical services and businesses, altering the community’s economic and social profile, potentially influencing population growth and age distribution.
Distinguishing between direct and indirect impacts is crucial for developing comprehensive and effective mitigation strategies.
Q 6. How do you assess the significance of demographic impacts?
Assessing the significance of demographic impacts involves a multifaceted approach that considers both the magnitude and the context of the changes.
- Magnitude: The sheer size of the change is important. A small change might be insignificant, while a large change warrants attention. For example, a 1% increase in population might be insignificant, but a 20% increase would likely necessitate significant infrastructure adjustments.
- Rate of Change: The speed at which the change occurs matters. A rapid change poses more challenges than a gradual one because it leaves less time for adaptation and planning.
- Spatial Distribution: The geographical concentration of the impact is also significant. A concentrated impact in a small area requires different planning responses than a dispersed impact across a larger region.
- Social and Economic Context: The significance of a demographic change depends on the existing social and economic context of the area. For example, a small population increase might be manageable in a well-resourced area, but a similar increase in a resource-constrained area could strain services and infrastructure.
- Stakeholder Perspectives: Understanding the perspectives of the affected communities on the significance of the impact is critical. Consultation with stakeholders helps identify priorities and concerns.
Often, a combination of quantitative analysis and qualitative feedback is needed to fully assess the significance of demographic impacts.
Q 7. Describe your experience using statistical software for demographic analysis (e.g., R, SPSS, SAS).
I have extensive experience using statistical software for demographic analysis, primarily R and SPSS. My expertise spans data manipulation, statistical modeling, and visualization.
- R: I leverage R’s powerful packages like
dplyrfor data manipulation,ggplot2for data visualization, andpopbiofor population projection modeling. For example, I’ve usedpopbioto model the impact of a proposed conservation project on an endangered species population, considering factors like birth rates, death rates, and migration. - SPSS: I utilize SPSS for descriptive statistics, regression analysis, and other statistical techniques relevant to demographic analysis. I’ve used SPSS to analyze census data, examining relationships between demographic variables and social indicators such as income inequality and healthcare access. I’ve also used it for analyzing survey data, exploring the impact of specific policies on different population subgroups.
My proficiency extends to creating custom scripts and functions within these packages to address unique analytic challenges arising from complex datasets and research questions. I prioritize reproducible research practices and meticulously document my code and analysis for transparency and validation.
Q 8. How do you incorporate qualitative data into a quantitative DIA?
Incorporating qualitative data into a quantitative Demographic Impact Assessment (DIA) is crucial for gaining a holistic understanding. While quantitative data provides the numbers (population size, age structure, etc.), qualitative data offers context and depth. Think of it like this: quantitative data tells you *how many* people are moving into an area, while qualitative data tells you *why*.
We use mixed-methods approaches. For example, after analyzing population projections (quantitative), we might conduct surveys or focus groups to understand residents’ concerns about increased traffic or strain on local resources (qualitative). This qualitative data helps us validate quantitative findings, identify unforeseen impacts, and add nuance to our conclusions. We might analyze open-ended survey responses using thematic analysis to identify recurring themes related to community impact. This richer understanding allows us to provide more comprehensive and relevant recommendations.
For instance, in assessing the impact of a new housing development, quantitative data might show a projected increase in school-aged children. Qualitative interviews with parents could then reveal anxieties about school overcrowding or concerns about the quality of education. This qualitative information enriches the DIA, making it more actionable for policymakers.
Q 9. Explain different methodologies for forecasting population changes.
Forecasting population change involves several methodologies, each with its strengths and limitations. The choice depends on the available data, the time horizon, and the desired level of detail.
- Cohort-component method: This is the most common approach. It projects future population based on current age-sex structure, fertility rates, mortality rates, and migration rates. It’s like a detailed accounting of births, deaths, and migration, building a future population picture year by year.
- Time-series analysis: This statistical method analyzes historical population trends to extrapolate future growth or decline. It’s useful when historical data is reliable and shows consistent patterns, but it might not capture sudden shifts or unforeseen events.
- Agent-based modeling: This sophisticated technique simulates individual decisions and interactions to predict population dynamics. It’s particularly useful for understanding complex scenarios, like urban sprawl or the impact of policy changes on migration patterns, but it requires extensive data and computational power.
Often, we use a combination of these methods. For instance, we might use the cohort-component method as a baseline projection, then adjust it based on insights from time-series analysis or agent-based modeling to improve accuracy.
Q 10. How do you present the findings of a Demographic Impact Assessment to stakeholders?
Presenting DIA findings requires clear, concise communication tailored to the audience. We use a multi-faceted approach:
- Executive summary: A brief overview highlighting key findings and recommendations for decision-makers.
- Visualizations: Charts, graphs, and maps illustrating population trends, projected changes, and impact areas. GIS maps are particularly powerful for showing spatial distribution of impacts.
- Tables: Detailed data tables providing the quantitative basis for the analysis.
- Narrative report: A comprehensive report explaining the methodology, findings, and their implications. This section will incorporate qualitative data insights.
- Interactive presentations: Engaging presentations using multimedia to convey complex information effectively.
- Stakeholder workshops: Interactive sessions to discuss findings, address questions, and gather feedback. This collaborative approach ensures the DIA’s relevance and usefulness.
The key is to avoid overwhelming stakeholders with technical details. Instead, we focus on conveying the most important findings and their practical implications. The presentation style should be clear, accessible, and visually engaging, suitable for both technical and non-technical audiences.
Q 11. How do you address potential biases in demographic data?
Addressing biases in demographic data is crucial for the credibility of a DIA. Biases can arise from several sources, including:
- Undercounting: Certain population groups (e.g., homeless individuals, undocumented immigrants) might be underrepresented in census data.
- Sampling bias: Non-representative samples can lead to skewed results.
- Data collection errors: Inaccurate data entry or flawed survey design can introduce errors.
- Data interpretation bias: Interpretations can be influenced by preconceived notions or assumptions.
We mitigate these biases through various strategies:
- Data triangulation: Comparing data from multiple sources to identify inconsistencies and potential biases.
- Sensitivity analysis: Assessing the impact of data variations on the DIA’s conclusions.
- Weighting adjustments: Correcting for known biases in the data, like applying weights to underrepresented groups.
- Qualitative data: Using qualitative methods (interviews, focus groups) to validate quantitative findings and capture information missing from existing data.
- Critical self-reflection: Actively acknowledging and addressing potential biases in our own assumptions and interpretations.
A rigorous approach to data quality control and bias mitigation is vital for producing reliable and trustworthy DIA results.
Q 12. Describe your experience with geographic information systems (GIS) in the context of DIA.
Geographic Information Systems (GIS) are indispensable tools in DIA. They allow us to visualize and analyze demographic data spatially, revealing patterns and relationships that wouldn’t be apparent from tables and charts alone. For example, we can overlay population density maps with maps of essential services (hospitals, schools) to identify areas facing potential strain.
In a recent project assessing the impact of a new highway, we used GIS to model the projected changes in commute times, accessibility to jobs, and residential density. We integrated demographic data (age, income, ethnicity) with GIS layers to identify communities potentially most affected by the construction. This allowed us to develop targeted mitigation strategies. We also use GIS to create visually compelling maps for presentations and reports, making complex information easily digestible for stakeholders.
Specific GIS functionalities we utilize include spatial analysis, map creation, data visualization, and geoprocessing. The spatial analysis helps in identifying spatial clusters and correlations and aids in impact area analysis. These powerful capabilities enable deeper insights and more effective communication of DIA findings.
Q 13. How do you integrate demographic projections into long-term planning?
Integrating demographic projections into long-term planning is essential for informed decision-making. We use these projections to anticipate future demands on resources and infrastructure and develop strategies to meet those demands effectively.
For example, a municipality might use population projections to plan for future school construction, healthcare facilities, or public transportation systems. We might provide projections showing potential increases in the elderly population, which then informs the development of senior care services and housing. These projections help guide resource allocation, infrastructure development, and policy formulation, ensuring that plans are sustainable and meet the needs of future populations.
In practice, this involves collaborating with planners and policymakers to incorporate demographic scenarios into long-term planning models. We often create multiple scenarios (e.g., high, medium, low growth) to account for uncertainty in future population trends. This helps decision-makers make robust plans that can adapt to changing circumstances.
Q 14. Explain your understanding of different demographic indicators (e.g., birth rates, mortality rates, migration).
Understanding demographic indicators is fundamental to DIA. These indicators provide crucial insights into population dynamics:
- Birth rates: The number of live births per 1,000 people per year. A high birth rate indicates a young and growing population, while a low birth rate suggests an aging population.
- Mortality rates: The number of deaths per 1,000 people per year. Mortality rates are influenced by factors such as healthcare access, lifestyle, and disease prevalence. High mortality rates generally indicate a lower life expectancy.
- Migration: The movement of people from one place to another, including both internal migration (within a country) and international migration. Migration patterns significantly impact population distribution and age-sex structures. Understanding net migration (the difference between in-migration and out-migration) is crucial.
- Age-sex structure: The distribution of the population by age and sex. This indicator is fundamental for understanding the dependency ratio (the proportion of dependents – children and elderly – to the working-age population). A high dependency ratio can strain public resources.
- Fertility rate: The average number of children a woman is expected to have during her lifetime. Fertility rate is a key driver of population growth or decline.
Analyzing these indicators in conjunction with other socioeconomic factors helps us to develop a comprehensive understanding of the population’s present state and predict future trends. These indicators are central to formulating evidence-based policies and effective strategies for managing population change.
Q 15. How do you assess the socioeconomic impacts of demographic change?
Assessing the socioeconomic impacts of demographic change requires a multifaceted approach. We analyze how shifts in population size, age structure, and geographic distribution affect various aspects of society. For example, an aging population might strain social security systems, while a shrinking workforce could lead to labor shortages and reduced economic growth. Conversely, a growing young population could increase demand for education and healthcare services.
My assessment typically involves:
- Analyzing labor market dynamics: Examining changes in employment rates, skill shortages, and the impact on wages.
- Evaluating the burden on social security and healthcare systems: Projecting future demands and analyzing the sustainability of existing systems.
- Assessing housing market impacts: Analyzing changes in housing demand, prices, and the availability of affordable housing.
- Investigating impacts on infrastructure and public services: Determining the need for adjustments in public transportation, schools, and other public facilities.
- Examining impacts on economic productivity and growth: Evaluating the overall effect of demographic change on GDP and economic output.
For instance, in a study I conducted for a rural community facing out-migration, we identified a decline in local businesses and a need for strategies to attract younger populations. This involved modeling future population scenarios to predict the future strain on local services.
Career Expert Tips:
- Ace those interviews! Prepare effectively by reviewing the Top 50 Most Common Interview Questions on ResumeGemini.
- Navigate your job search with confidence! Explore a wide range of Career Tips on ResumeGemini. Learn about common challenges and recommendations to overcome them.
- Craft the perfect resume! Master the Art of Resume Writing with ResumeGemini’s guide. Showcase your unique qualifications and achievements effectively.
- Don’t miss out on holiday savings! Build your dream resume with ResumeGemini’s ATS optimized templates.
Q 16. What are the key challenges in conducting a DIA in a rapidly changing environment?
Conducting a DIA in a rapidly changing environment presents significant challenges. The most critical is the inherent uncertainty about future demographic trends. Rapid technological advancements, unexpected migration flows, and unforeseen events like pandemics can significantly alter projections.
Other key challenges include:
- Data limitations: Accurate and timely data may be scarce, especially in rapidly changing contexts. Data quality issues can greatly affect the reliability of the DIA.
- Model limitations: Demographic models often rely on assumptions that may not hold true in rapidly evolving circumstances. This requires constant model adaptation and validation.
- Stakeholder engagement: Keeping stakeholders engaged and informed throughout the process is challenging given the rapidly evolving landscape and potential for shifting priorities.
- Uncertainty quantification: Accurately incorporating and communicating the uncertainties inherent in projections and their impacts is crucial but complex.
For example, in a project assessing the impact of climate change-induced migration, we had to constantly revise our assumptions based on new scientific evidence and observed migration patterns, which required considerable flexibility in our methodology.
Q 17. How do you ensure the validity and reliability of your DIA findings?
Ensuring validity and reliability in a DIA requires meticulous attention to detail throughout the process. This involves:
- Using robust data sources: Employing data from multiple reliable sources, such as census data, vital registration systems, and surveys, to reduce bias and error. Data triangulation is crucial.
- Applying appropriate methodologies: Selecting and rigorously applying validated demographic modeling techniques that are suitable for the specific context and data availability.
- Transparency and documentation: Clearly documenting the data sources, methods, assumptions, and limitations of the analysis to ensure replicability and transparency.
- Peer review and validation: Seeking external peer review of the methods and findings to identify potential biases and errors.
- Sensitivity analysis: Conducting sensitivity analyses to assess the impact of uncertainties in data and assumptions on the results.
For instance, in one of my projects, we conducted extensive sensitivity analysis to determine how different migration scenarios would impact the results, explicitly highlighting this uncertainty in our final report.
Q 18. Describe your experience working with different stakeholders in a DIA project.
Stakeholder engagement is paramount in a DIA project. It’s crucial to effectively communicate with and involve diverse stakeholders including government agencies, community organizations, businesses, and the general public.
My approach typically involves:
- Early stakeholder consultation: Identifying key stakeholders early in the project to understand their concerns and information needs.
- Participatory methods: Employing participatory methods such as workshops, focus groups, and public forums to elicit diverse perspectives and ensure inclusivity.
- Communication and dissemination: Developing clear and accessible communication strategies to disseminate findings to different stakeholder groups.
- Building consensus: Facilitating discussions and collaboration among stakeholders to build consensus on priorities and strategies.
In a recent project involving urban planning, we facilitated a series of workshops with local residents, businesses, and city officials to collaboratively develop scenarios and assess their impacts on the community. This participatory approach ensured the final recommendations were well-received and actionable.
Q 19. How do you incorporate uncertainty and risk into a DIA?
Incorporating uncertainty and risk into a DIA is essential for producing realistic and robust assessments. We acknowledge that demographic projections are not deterministic; they are subject to inherent uncertainties.
My approach includes:
- Scenario planning: Developing multiple plausible scenarios based on different assumptions about future demographic trends, including high, medium, and low growth scenarios.
- Probabilistic modeling: Employing probabilistic modeling techniques to quantify the uncertainty associated with demographic projections and their impacts.
- Risk assessment: Conducting a risk assessment to identify and evaluate the potential risks associated with different demographic changes and their impacts.
- Adaptive management strategies: Recommending adaptive management strategies that allow for adjustments in policy and planning in response to unforeseen demographic changes.
For example, in assessing the impacts of an aging population on healthcare resources, we developed three scenarios: a best-case scenario with significant technological advancements, a moderate scenario, and a worst-case scenario with limited resource expansion. This helped stakeholders understand the range of potential impacts and plan accordingly.
Q 20. Explain your understanding of demographic transition theory.
Demographic transition theory describes the shift in birth and death rates that occurs as countries develop from pre-industrial to industrial societies. It typically involves four stages:
- Stage 1 (High Stationary): High birth rates and high death rates, resulting in slow population growth.
- Stage 2 (Early Expanding): Death rates decline significantly due to improvements in sanitation, healthcare, and food production, while birth rates remain high, leading to rapid population growth.
- Stage 3 (Late Expanding): Birth rates start to decline as societies become more urbanized, women gain more access to education and employment, and family planning becomes more widespread. Population growth slows.
- Stage 4 (Low Stationary): Low birth rates and low death rates, resulting in slow or zero population growth. In some cases, this can lead to population decline.
Understanding this theory helps us predict future population changes and their impacts. For example, countries in stage 2 often experience significant pressure on resources and infrastructure. Countries in stage 4 face challenges related to an aging population and shrinking workforce.
Q 21. How do you assess the cumulative impacts of multiple demographic changes?
Assessing the cumulative impacts of multiple demographic changes requires a systems-thinking approach. Simply adding the individual impacts of each change can be misleading. The effects often interact in complex ways.
My approach involves:
- Integrated modeling: Using integrated models that incorporate multiple demographic factors and their interactions to assess cumulative effects.
- Scenario analysis: Developing multiple scenarios to explore different combinations of demographic changes and their potential cumulative impacts.
- Sensitivity analysis: Conducting sensitivity analysis to evaluate the influence of uncertainties in the interactions between demographic changes.
- Systems dynamics modeling: This approach can help to identify feedback loops and unintended consequences that arise from the interplay of various demographic factors.
For instance, considering the simultaneous impact of an aging population and declining fertility rates requires a holistic approach that accounts for the increased demand for long-term care services, reduced workforce size, and the potential for economic stagnation. A simple sum of individual impacts would not capture the full complexity of this interconnected challenge.
Q 22. How do you apply cost-benefit analysis in the context of a DIA?
Cost-benefit analysis (CBA) in a Demographic Impact Assessment (DIA) involves evaluating the economic implications of demographic changes on a project or policy. It’s about quantifying the positive and negative financial consequences, helping decision-makers choose the most economically efficient option.
For example, imagine a new hospital being built in a region with an aging population. A CBA would consider the costs (construction, staffing, equipment) against the benefits (increased healthcare access, reduced mortality rates, potential tax revenue from increased employment). We’d monetize as many impacts as possible, like calculating the value of lives saved based on statistical life value or the economic benefit of reduced hospital readmissions due to better care. The challenge is in accurately assigning monetary values to less tangible impacts, like improved quality of life. It requires careful consideration of discount rates and the time horizon for analysis.
To perform this, we use a structured approach: 1) Identifying all potential costs and benefits; 2) Quantifying these impacts using relevant data (census data, health statistics, economic models); 3) Assigning monetary values; 4) Discounting future benefits to present value; 5) Comparing the total present value of benefits to the total present value of costs. A positive net present value indicates that the benefits outweigh the costs.
Q 23. Describe your experience with scenario planning in relation to demographic change.
Scenario planning in the context of demographic change involves creating multiple plausible futures based on different assumptions about population trends. This helps anticipate potential challenges and opportunities. Instead of relying on a single projection, we explore a range of possibilities.
For instance, in a DIA for a retirement community development, we might consider three scenarios: a high-growth scenario (assuming rapid population aging), a medium-growth scenario (a more moderate aging trend), and a low-growth scenario (slowing aging or even population decline). Each scenario would have its own population projections, influencing the demand for housing, healthcare services, and other amenities. This allows us to identify robust strategies that work across a range of possible futures and avoid being overly reliant on one specific projection.
My experience includes working on a project assessing the impact of population decline on rural communities. We developed three scenarios: one with continued population loss, one with modest population stabilization, and one with population growth through targeted economic development initiatives. This allowed the community to plan for various possibilities, including resource allocation and infrastructure investments.
Q 24. How do you measure the effectiveness of mitigation measures related to demographic impacts?
Measuring the effectiveness of mitigation measures related to demographic impacts requires a robust evaluation framework. This typically involves comparing the projected demographic impacts with mitigation measures implemented against a baseline projection without the measures.
Let’s consider a city facing challenges due to an aging population. A key mitigation measure might be the creation of age-friendly infrastructure, such as ramps and accessible public transport. We can measure effectiveness by comparing the number of mobility-related incidents among older adults in the city with the new infrastructure against a control group or a pre-intervention period without the improved infrastructure. Statistical tests would determine the significance of any observed differences. Surveys and qualitative feedback from the elderly population are also valuable in assessing the overall effectiveness in terms of well-being and quality of life.
Key indicators for evaluation can include: reduced healthcare costs, improved levels of social interaction among older adults, increased economic participation rates among seniors, and enhanced safety and accessibility.
Q 25. What are the limitations of using demographic projections in decision-making?
Demographic projections are invaluable tools, but they have limitations. They are essentially educated guesses about the future based on current trends and assumptions. These assumptions can be inaccurate, leading to flawed projections. Moreover, unexpected events (pandemics, economic crises, natural disasters) can significantly alter population dynamics, rendering projections obsolete.
For example, migration patterns are notoriously difficult to predict. A sudden shift in immigration or emigration can drastically change a region’s population composition. Similarly, fertility rates can fluctuate unexpectedly due to changes in social norms or economic conditions. Therefore, it’s crucial to acknowledge the uncertainty inherent in demographic projections and use sensitivity analyses to explore the impacts of different assumptions. Over-reliance on a single projection can lead to poor decision-making.
It’s essential to incorporate qualitative data and expert judgment alongside quantitative projections to create a more comprehensive and robust understanding of future demographic trends. Scenario planning, as discussed previously, is a vital strategy for acknowledging this uncertainty.
Q 26. Describe your experience with participatory approaches to DIA.
Participatory approaches to DIA are crucial for ensuring that assessments are relevant, equitable, and address the needs of diverse populations. It’s about involving stakeholders from the start—not just as recipients of the final report but as active participants in the entire process.
In my experience, I have facilitated workshops and focus groups with community members, policymakers, and other stakeholders to gather insights and perspectives on the demographic challenges and opportunities facing their communities. This might involve using participatory mapping exercises to identify areas needing improvements in accessibility or conducting interviews to understand the lived experiences of different age groups.
One example is a project where we worked with a local council to plan for increased numbers of elderly residents. Through participatory mapping workshops, residents identified key areas that needed improvement. This included better street lighting in areas with poor visibility, better public transportation, and improved access to community facilities, shaping more effective and relevant mitigation strategies.
Q 27. How do you adapt your DIA approach based on the specific context and scale of a project?
Adapting the DIA approach to specific contexts and scales is essential for its effectiveness. A DIA for a small rural community will differ significantly from one for a large metropolitan area.
Scale: For smaller-scale projects (e.g., a new residential development), the assessment might focus on localized demographic trends and their specific impacts on housing demand, infrastructure needs, and local services. Larger-scale projects (e.g., regional transportation planning) require broader demographic projections and analyses considering broader regional trends and interactions between different communities.
Context: The specific context influences the relevant demographic variables. For a project focused on healthcare access, aging trends, health status indicators, and access to services would be crucial. For an education-related project, data on school-age population, educational attainment levels, and language proficiency would be vital. The methodology must be tailored accordingly. A rural community grappling with population decline would require a very different approach than a rapidly urbanizing city facing housing shortages.
Ultimately, a flexible and adaptable DIA framework is necessary, capable of integrating both qualitative and quantitative data, and designed for meaningful engagement with a wide range of stakeholders.
Key Topics to Learn for Demographic Impact Assessment Interview
- Data Collection and Analysis: Understanding various data sources (census data, surveys, administrative records), data cleaning techniques, and statistical methods for analyzing demographic data.
- Impact Assessment Methodologies: Familiarize yourself with different frameworks and models used to assess demographic impacts, including quantitative and qualitative approaches.
- Population Projections and Forecasting: Mastering techniques for projecting future population trends and their implications for impact assessments.
- Equity and Social Justice Considerations: Understanding how to identify and address potential disparities and inequities in demographic impacts. This includes exploring concepts like environmental justice and intersectionality.
- Scenario Planning and Sensitivity Analysis: Developing the ability to explore different possible future scenarios and assess the robustness of your impact assessment findings.
- Communication and Visualization of Results: Practicing clear and effective communication of complex demographic data and findings through reports, presentations, and visualizations.
- Legislation and Policy Context: Understanding the relevant legal and policy frameworks that inform demographic impact assessments within your field of interest.
- Case Studies and Practical Applications: Reviewing real-world examples of demographic impact assessments to understand practical application and problem-solving approaches.
- Ethical Considerations: Understanding the ethical implications of collecting, analyzing, and interpreting demographic data and ensuring responsible use of this information.
Next Steps
Mastering Demographic Impact Assessment opens doors to exciting career opportunities in diverse fields, offering significant professional growth and impactful contributions to society. To maximize your job prospects, it’s crucial to present your skills effectively. Building an ATS-friendly resume is key to getting your application noticed. ResumeGemini is a trusted resource that can help you create a compelling and effective resume highlighting your expertise in Demographic Impact Assessment. Examples of resumes tailored to this field are available to guide you. Take the next step towards a successful career by crafting a resume that truly showcases your capabilities.
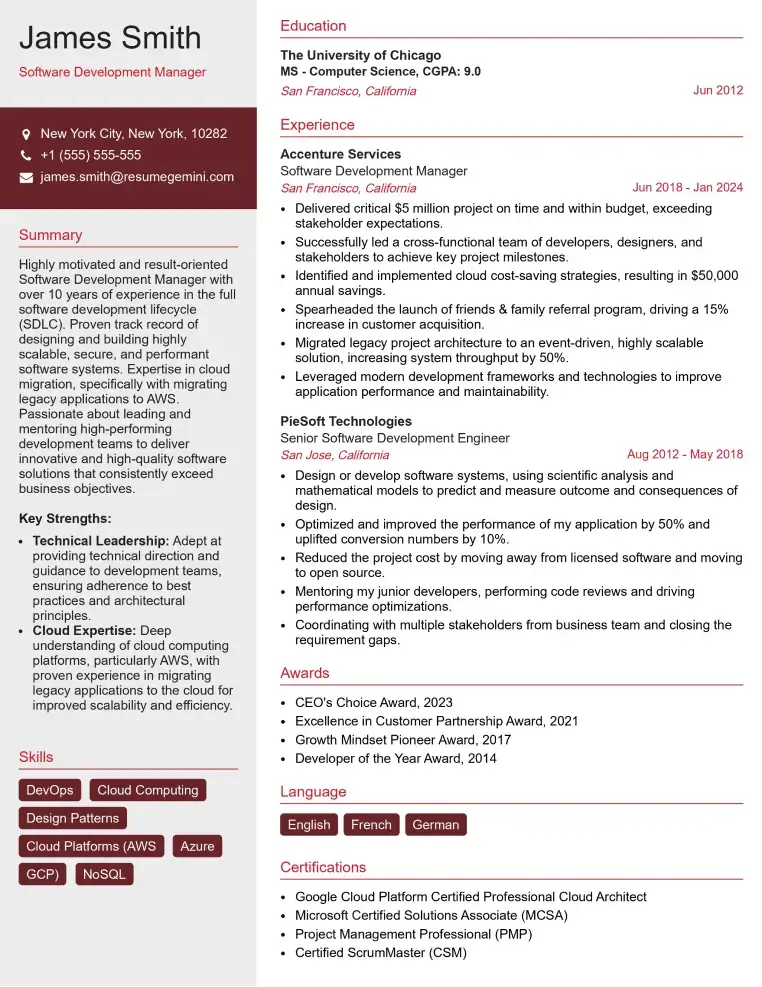
Check Out Resume Samples at ResumeGemini
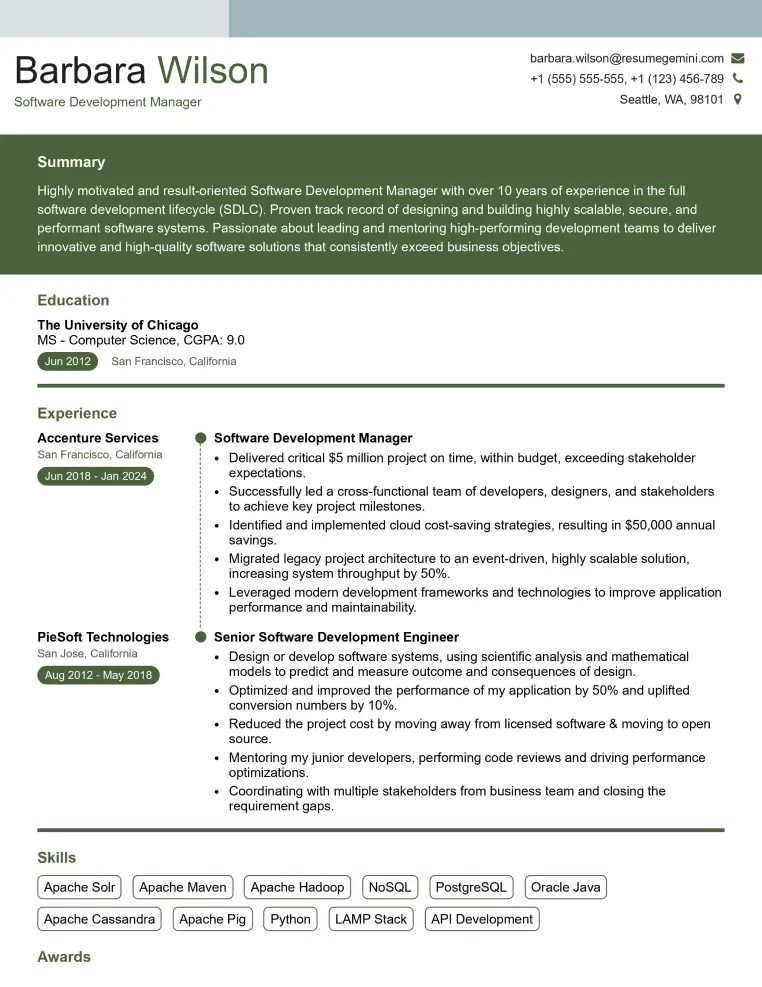
Check Out Resume Samples at ResumeGemini
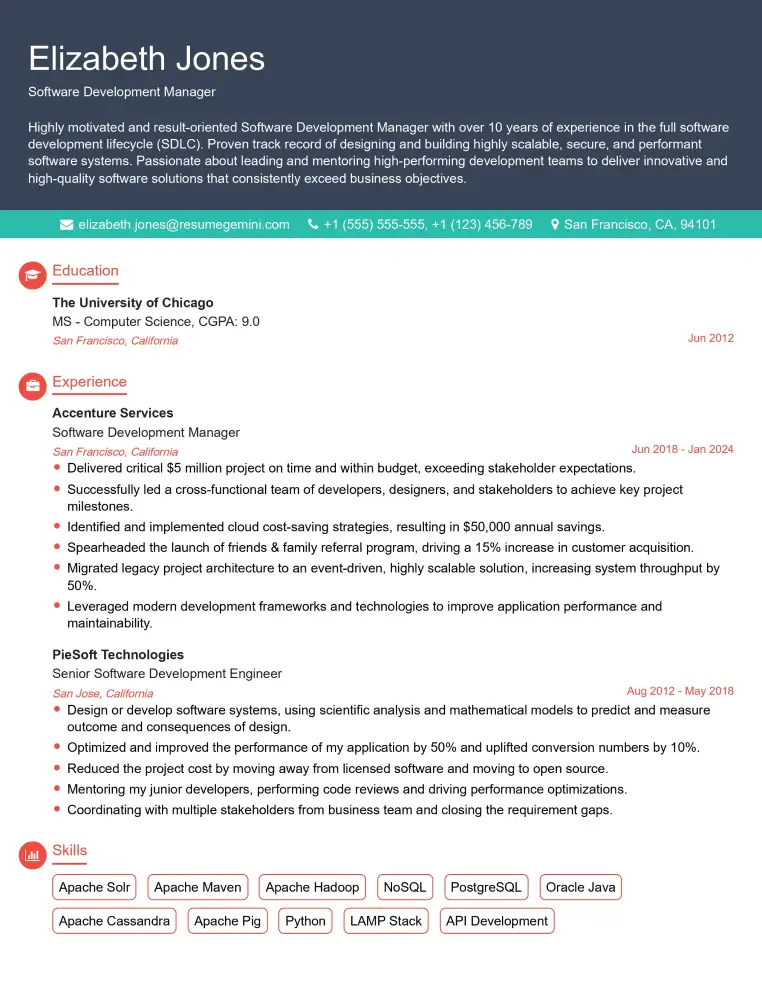
Check Out Resume Samples at ResumeGemini

Check Out Resume Samples at ResumeGemini
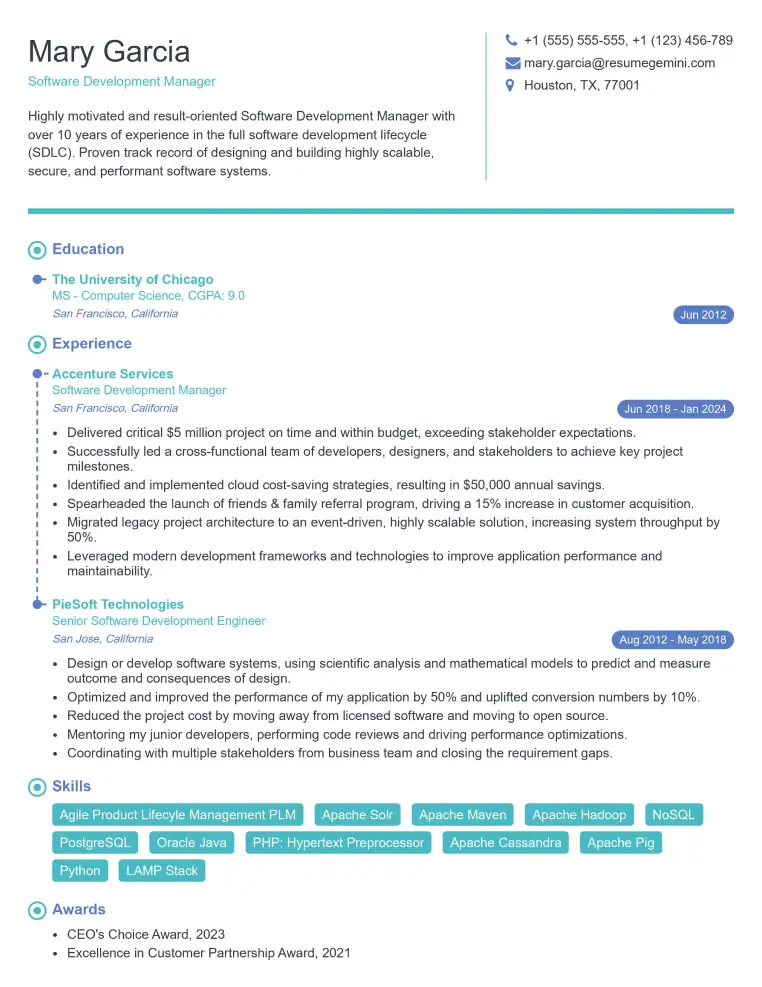
Check Out Resume Samples at ResumeGemini
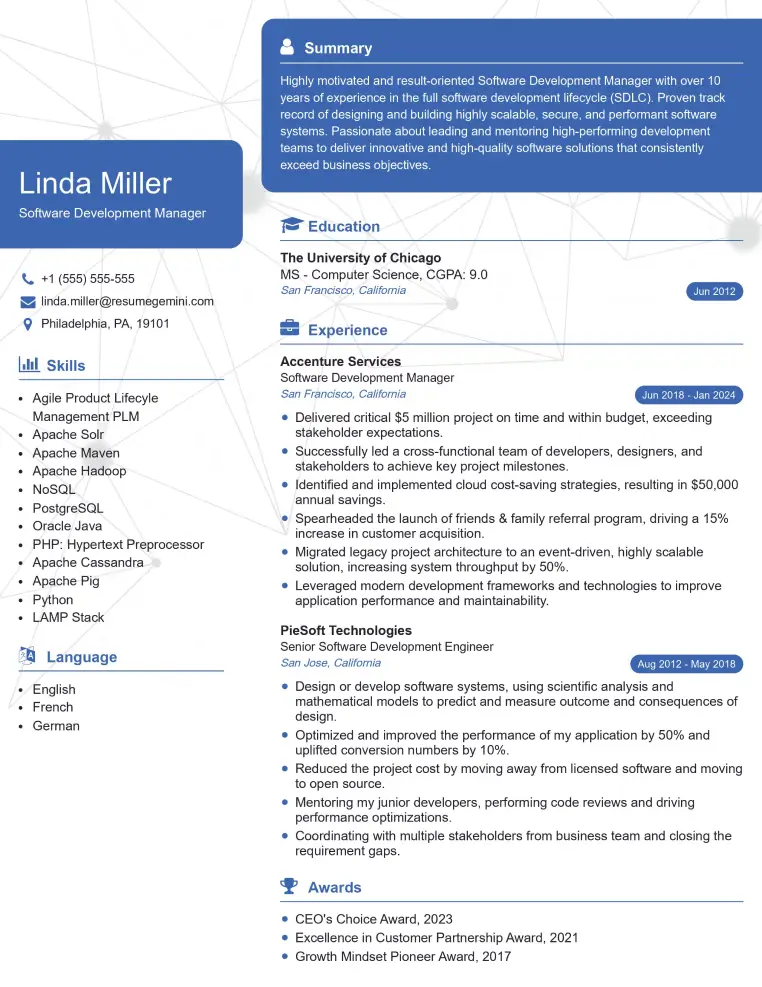
Check Out Resume Samples at ResumeGemini
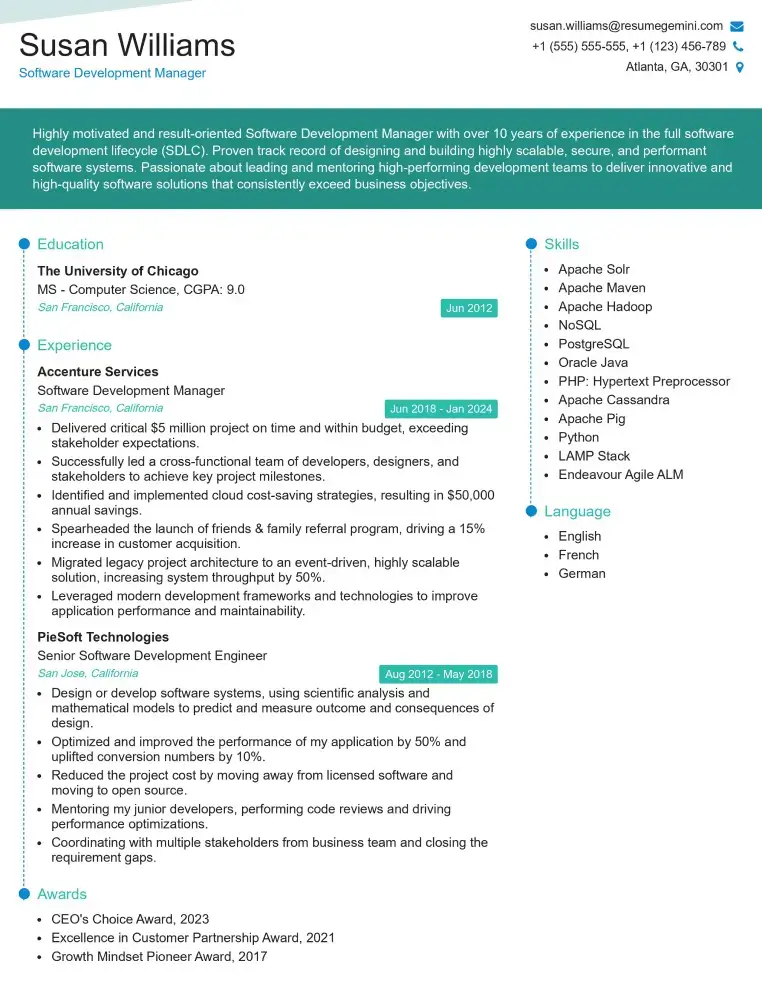
Check Out Resume Samples at ResumeGemini
Explore more articles
Users Rating of Our Blogs
Share Your Experience
We value your feedback! Please rate our content and share your thoughts (optional).
What Readers Say About Our Blog
To the interviewgemini.com Webmaster.
Very helpful and content specific questions to help prepare me for my interview!
Thank you
To the interviewgemini.com Webmaster.
This was kind of a unique content I found around the specialized skills. Very helpful questions and good detailed answers.
Very Helpful blog, thank you Interviewgemini team.