Interviews are more than just a Q&A session—they’re a chance to prove your worth. This blog dives into essential Device Monitoring and Management interview questions and expert tips to help you align your answers with what hiring managers are looking for. Start preparing to shine!
Questions Asked in Device Monitoring and Management Interview
Q 1. Explain the difference between proactive and reactive device monitoring.
The key difference between proactive and reactive device monitoring lies in their approach to identifying and resolving issues. Reactive monitoring is like waiting for a car to break down before fixing it. You only address problems *after* they’ve occurred, typically responding to alerts or user reports. This approach is inefficient and can lead to downtime and data loss. In contrast, proactive monitoring is akin to regularly servicing your car to prevent breakdowns. It involves continuously monitoring devices for potential problems *before* they escalate into failures. This allows for early detection and timely intervention, minimizing disruptions and maximizing uptime.
For example, a reactive approach to server monitoring might involve only noticing a server is down when a user reports an outage. A proactive approach, however, would involve monitoring CPU usage, disk space, and network connectivity. If CPU usage consistently nears 100%, the system administrator receives an alert *before* the server crashes, enabling them to investigate the cause (e.g., a runaway process) and prevent the outage.
Q 2. Describe your experience with various monitoring tools (e.g., Nagios, Zabbix, Prometheus).
I have extensive experience with several prominent monitoring tools, including Nagios, Zabbix, and Prometheus. Each excels in different areas. Nagios is a robust and versatile tool, particularly strong in its event handling and alert escalation features. I’ve used it to build comprehensive monitoring systems for large networks, leveraging its plugin architecture for customized checks. Zabbix provides a powerful and scalable solution with a user-friendly interface, making it suitable for managing diverse environments. Its auto-discovery feature significantly simplifies setup and management of new devices. Finally, Prometheus, with its time-series database, is excellent for metrics-driven monitoring and alerting. I utilized its flexibility to build sophisticated dashboards visualizing complex system behaviors and identifying performance bottlenecks – for example, tracking HTTP request latency across multiple microservices.
Q 3. How do you handle alerts generated by your monitoring system?
My approach to handling alerts is systematic and prioritizes efficient resolution. First, I triage the alert based on severity and impact. Critical alerts, such as complete server failures, demand immediate attention. I use a combination of automated responses (e.g., restarting a service) and manual intervention, depending on the situation. For less critical alerts, I investigate the root cause, often using the monitoring system’s detailed logs and metrics. After addressing the issue, I document the resolution process to aid future troubleshooting and to improve monitoring configurations if necessary. I also regularly review alert thresholds and configurations to fine-tune sensitivity and reduce noise. The ultimate goal is to minimize false positives while ensuring that critical issues are addressed promptly.
For instance, if I receive an alert indicating high disk usage on a server, I will first check the disk space using tools like df -h. Depending on the cause (e.g., log files exceeding storage, temporary files), I’ll implement appropriate solutions like deleting unnecessary files, increasing disk space, or adjusting application settings.
Q 4. What metrics are most important to monitor in a server environment?
The most crucial metrics to monitor in a server environment vary depending on the server’s role, but some key indicators are universally important. CPU usage and memory usage are essential for assessing overall system health and detecting potential bottlenecks. Disk space monitoring helps prevent storage exhaustion, leading to application failures. Network traffic analysis reveals potential bandwidth issues or security breaches. Furthermore, monitoring process activity helps to identify runaway processes or resource hogs. For database servers, monitoring query performance and database size is vital. Finally, tracking uptime and response times provides key insights into overall system availability and performance. Regularly reviewing these metrics allows for proactive identification of performance degradation or potential issues before they impact users.
Q 5. Describe your experience with creating and managing dashboards for device monitoring.
Creating and managing dashboards for device monitoring is crucial for presenting complex information clearly and efficiently. My experience involves designing dashboards using tools like Grafana and Zabbix’s built-in dashboarding capabilities. I prioritize a clear and intuitive layout, using visualizations like graphs, charts, and tables to effectively communicate key metrics. The dashboards are structured to highlight critical information, with clear alerts and thresholds to indicate potential problems. The level of detail is tailored to the audience; for example, a senior management dashboard might focus on high-level overviews, while a technical dashboard might delve deeper into specific component performance. I always ensure the dashboards are responsive and easily accessible across various devices.
For instance, a dashboard for a web server might display key metrics like CPU usage, memory usage, HTTP request response times, and error rates, allowing for quick identification of performance issues or potential outages.
Q 6. How do you ensure the accuracy and reliability of your monitoring data?
Ensuring the accuracy and reliability of monitoring data is paramount. This involves multiple strategies. First, I use redundant monitoring agents and sensors to avoid single points of failure. Second, regular calibration and verification of sensors and agents are crucial. I cross-reference data from multiple sources to identify inconsistencies or anomalies. Data validation checks are essential – for example, verifying that CPU usage values are within the expected range. Third, I carefully consider the potential sources of error, such as network latency or sensor drift, and implement measures to minimize their impact. Robust logging and auditing mechanisms help track data integrity and facilitate troubleshooting of potential discrepancies. Finally, continuous testing and validation of monitoring processes guarantee data accuracy and reliability over time.
Q 7. Explain your experience with different monitoring methodologies (e.g., SNMP, WMI).
My experience encompasses several monitoring methodologies. SNMP (Simple Network Management Protocol) is widely used for network device monitoring, providing a standardized way to collect information like CPU utilization, memory usage, and interface statistics. I’ve used SNMP extensively for monitoring routers, switches, and other network devices. WMI (Windows Management Instrumentation) offers a powerful mechanism for gathering data from Windows systems, providing deep insights into operating system performance, applications, and hardware. I’ve leveraged WMI for detailed monitoring of Windows servers and applications. Choosing the right methodology depends on the environment. SNMP is suitable for heterogeneous networks, while WMI is specific to Windows. Often, a hybrid approach is used, combining SNMP for network devices and WMI for Windows servers.
Q 8. How do you troubleshoot network connectivity issues using monitoring tools?
Troubleshooting network connectivity issues starts with understanding the layers of the network stack. Monitoring tools provide crucial data at each level. For example, if a device is unreachable, I’d first check the basic physical layer: are cables plugged in correctly? Is the device powered on? Then I move up the stack.
Layer 2 (Data Link): Monitoring tools like SolarWinds or PRTG can show MAC address information and link status. A missing MAC address on a switch port indicates a physical connection problem. Low link utilization might signal a cabling issue or faulty NIC.
Layer 3 (Network): I’d check IP addresses, subnet masks, and default gateways using tools like ping, traceroute (tracert on Windows), and nslookup. A failed ping indicates a problem with IP configuration or network routing. Traceroute helps pinpoint where the connection breaks down. For example, if traceroute stops at a specific router, that router is likely the source of the problem.
Higher Layers: Issues at layers 4-7 (transport, session, presentation, application) require different approaches. Monitoring tools often integrate with application performance monitoring (APM) solutions to show application-level errors. For example, if a web server is unreachable, I’d check server logs and web server metrics to determine if the issue is network-related or application-specific.
A systematic approach using monitoring tools at different network layers ensures quick identification and resolution of connectivity issues.
Q 9. Describe your experience with log analysis and how it relates to device monitoring.
Log analysis is fundamental to effective device monitoring. Device logs contain a wealth of information about their operation, including errors, warnings, and performance data. My experience involves using various log management systems like Splunk, ELK stack, and Graylog to analyze logs from diverse sources: servers, network devices, applications, and security systems.
For instance, I once investigated a sudden spike in database query times. By analyzing database server logs, I found numerous error messages related to disk I/O. Further investigation using monitoring tools revealed high disk utilization, indicating a potential disk failure. This was confirmed by the monitoring tool’s disk I/O metrics, allowing proactive replacement of the failing disk before a major outage.
Log analysis is not just reactive; it’s also proactive. By establishing baselines for log events and using anomaly detection techniques, we can identify potential problems before they impact services. For example, a sudden increase in failed login attempts as seen in security logs could signal a potential intrusion attempt.
Q 10. Explain the concept of baselining in device monitoring.
Baselining in device monitoring involves establishing a normal range of performance metrics for a device or system. Think of it like establishing a healthy ‘vital signs’ profile for your devices. This ‘normal’ performance acts as a benchmark. Any deviation from this baseline triggers alerts, indicating potential problems.
For example, if a web server typically handles 100 requests per second with an average response time of 200ms, we’d set those values as our baseline. A sudden drop in requests per second to 50 or a rise in response time to 500ms would signal a potential issue, such as increased load or a performance bottleneck. The baseline is created by observing the device’s performance over a period of time under normal operating conditions, and sophisticated monitoring tools can automatically generate these baselines.
Baselining enhances the accuracy of alerts, filters out false positives, and allows for early detection of subtle performance degradations that might otherwise go unnoticed. It’s a cornerstone of proactive device monitoring.
Q 11. How do you prioritize alerts and determine which issues require immediate attention?
Prioritizing alerts requires a multi-faceted approach that considers severity, impact, and urgency. I use a combination of techniques:
Severity Levels: Most monitoring tools allow defining severity levels (critical, major, minor, warning). Critical alerts, like a complete server failure, require immediate attention. Minor alerts, such as low disk space warnings, can often wait.
Impact Assessment: I consider the potential impact of an issue on business operations. A problem affecting a critical application deserves higher priority than a problem affecting a less critical service. For example, an outage of the payment gateway is far more serious than a minor issue on an internal intranet site.
Automated Rules and Escalation Paths: I often automate alert routing and escalation using rules based on severity and impact. Critical alerts might trigger immediate notifications to on-call engineers, while minor alerts could be routed to a support team.
Contextual Information: The context surrounding an alert is critical. For instance, a high CPU utilization alert might be benign during peak load but critical during off-peak hours. The monitoring tools should present contextual data alongside the alert.
These strategies ensure that critical problems get the attention they deserve while minimizing alert fatigue.
Q 12. What are some common challenges in device monitoring, and how have you overcome them?
Common challenges in device monitoring include:
Alert Fatigue: Too many alerts can desensitize engineers, leading to missed critical events. I’ve mitigated this by implementing robust alerting strategies, including baselining, prioritization, and sophisticated filtering to reduce noise.
Data Silos: Different monitoring tools may not integrate seamlessly. I’ve addressed this by adopting a centralized monitoring platform or using integration tools that consolidate data from diverse sources.
Scalability: As the number of monitored devices grows, the monitoring system needs to scale effectively. Using cloud-based monitoring solutions or distributed monitoring architectures helps to handle this scalability.
Complexity: Configuring and maintaining complex monitoring systems requires expertise. I’ve countered this by using standardized procedures, comprehensive documentation, and investing in training.
Successfully overcoming these challenges requires a proactive approach, continuous improvement, and a focus on automation and integration.
Q 13. Describe your experience with automating device monitoring tasks.
I have extensive experience automating device monitoring tasks using scripting languages like Python and tools like Ansible and Terraform. Automation improves efficiency, reduces manual effort, and enhances consistency.
Examples of automated tasks include:
Automated provisioning of monitoring agents: Using Ansible playbooks, we can automatically deploy monitoring agents to new servers, ensuring consistent monitoring across the infrastructure.
Automated alert escalation: Python scripts can be used to trigger automated email or SMS alerts based on the severity of events.
Automated report generation: Scheduled scripts can automatically generate performance reports and dashboards, providing regular insights into the health and performance of monitored systems.
Automated remediation: In some cases, automation can even be used to automatically remediate certain issues, such as restarting a failing service. This requires careful planning and testing to avoid unintended consequences.
Automation is critical for scalability and maintaining a robust monitoring system.
Q 14. Explain your understanding of different alert escalation procedures.
Alert escalation procedures define how alerts are handled and escalated when initial response fails to resolve an issue. A well-defined escalation path is vital for ensuring timely resolution of critical problems.
Here are a few common escalation procedures:
Tiered Support: A common approach involves multiple support tiers, starting with a Level 1 support team who handle basic issues. If they can’t resolve the problem, it’s escalated to Level 2, then Level 3 (often specialized engineers), and so on. This structure is efficient for handling different types of issues.
On-Call Rotation: For critical systems, an on-call rotation ensures that engineers are available 24/7 to respond to urgent alerts. This requires a well-defined communication channel (pagerduty, Slack alerts, etc.) and clear guidelines on response times.
Automated Escalation: Monitoring tools can automate escalation based on pre-defined rules and severity levels. For instance, an unacknowledged critical alert could automatically escalate to a manager or a dedicated team after a certain period.
Integration with Ticketing Systems: Escalation procedures often integrate with ticketing systems (e.g., Jira, ServiceNow) to track and manage incidents and their resolutions.
The best escalation procedure depends on the criticality of the monitored systems, the size of the support team, and the complexity of the infrastructure. A clearly documented and well-tested escalation path is essential for effective incident management.
Q 15. How do you ensure the security of your monitoring systems?
Securing monitoring systems is paramount. It’s like guarding the key to your entire IT infrastructure. My approach is multi-layered, focusing on prevention, detection, and response. This includes:
Network Security: Implementing strong firewalls, intrusion detection/prevention systems (IDS/IPS), and regularly updating security protocols to prevent unauthorized access.
Access Control: Utilizing role-based access control (RBAC) to limit access to sensitive data and functionalities based on user roles and responsibilities. Only authorized personnel should have access to crucial monitoring dashboards and configuration settings. For instance, a network engineer might need full access, while a helpdesk representative might only need read-only access to basic system status.
Data Encryption: Encrypting all sensitive data both in transit and at rest, protecting against data breaches. This is especially crucial for monitoring data containing sensitive system configurations or user information.
Regular Security Audits and Penetration Testing: Conducting regular security audits and penetration tests to identify vulnerabilities and proactively address them. This helps identify weaknesses before malicious actors can exploit them.
System Hardening: Regularly patching and updating the monitoring software and underlying infrastructure to address known vulnerabilities. This is often done through automated patch management systems.
Log Management and Security Information and Event Management (SIEM): Centralized log management and SIEM solutions are essential for monitoring system activity, detecting anomalies, and generating alerts in case of suspicious behavior. This allows for rapid response to security incidents.
In one project, we successfully prevented a significant data breach by proactively identifying and patching a vulnerability in our monitoring system’s web interface during a routine penetration test. This highlights the critical role of proactive security measures.
Career Expert Tips:
- Ace those interviews! Prepare effectively by reviewing the Top 50 Most Common Interview Questions on ResumeGemini.
- Navigate your job search with confidence! Explore a wide range of Career Tips on ResumeGemini. Learn about common challenges and recommendations to overcome them.
- Craft the perfect resume! Master the Art of Resume Writing with ResumeGemini’s guide. Showcase your unique qualifications and achievements effectively.
- Don’t miss out on holiday savings! Build your dream resume with ResumeGemini’s ATS optimized templates.
Q 16. What is your experience with capacity planning and how it relates to device monitoring?
Capacity planning is crucial for preventing performance bottlenecks and ensuring the smooth operation of your monitoring system and the devices it monitors. It’s like planning for a party – you need to estimate how many guests (devices), how much food (data), and what kind of space (storage) you’ll need.
My experience involves using historical data, forecasting tools, and performance modeling to predict future resource needs. This includes:
Data Volume Analysis: Analyzing historical data to determine trends in data volume growth and predict future needs. This allows us to plan for adequate storage and processing power.
Performance Baseline: Establishing performance baselines to identify potential bottlenecks and plan for upgrades or scaling. We can use this to set thresholds for alerts and proactively handle issues before they impact service.
Resource Forecasting: Using forecasting models to predict future resource requirements, such as CPU, memory, storage, and network bandwidth. Tools such as
nagiosorZabbixprovide insights into resource usage and help inform forecasting.What-if scenarios: Analyzing different scenarios and their impact on resource utilization. For example, simulating a sudden increase in the number of monitored devices or a surge in data volume helps determine the system’s robustness.
In a recent project, accurate capacity planning allowed us to anticipate a large-scale infrastructure upgrade, preventing system slowdowns and potential outages during a period of rapid growth in monitored devices.
Q 17. Explain the concept of synthetic monitoring and its benefits.
Synthetic monitoring uses scripts or agents to simulate real-user interactions with applications and services to proactively identify and resolve performance issues *before* they impact end users. It’s like having a robot test-drive your car to ensure everything runs smoothly, before you take it for a spin.
Benefits include:
Proactive Issue Detection: Synthetic monitoring detects issues before real users experience them, reducing downtime and improving user experience.
Performance Baselining: Provides a baseline for measuring performance and identifying deviations, enabling proactive capacity planning.
Improved Application Performance: By identifying and addressing issues early, synthetic monitoring enhances overall application performance and stability.
Comprehensive Monitoring: Provides a holistic view of performance across various components, including network, servers, and applications.
Faster Mean Time to Resolution (MTTR): By proactively identifying issues, the time to resolve problems is greatly reduced.
For example, a synthetic monitoring script could simulate a customer logging into a web application and verifying the response time, ensuring a seamless user experience. Any slowdowns or errors are flagged immediately, facilitating prompt remediation.
Q 18. Describe your experience working with various operating systems in a monitoring context.
I have extensive experience working with a variety of operating systems in monitoring contexts, including Windows, Linux (various distributions like Red Hat, CentOS, Ubuntu), macOS, and network devices (Cisco IOS, Juniper Junos). My expertise extends to understanding their specific monitoring needs and configurations.
For example, monitoring Windows servers often involves using Performance Monitor and event logs, while Linux systems frequently leverage tools like top, htop, ps, iostat, and netstat, along with log analysis. Network devices require specialized tools and protocols (SNMP, NetFlow) to monitor their performance and status. My skills encompass the ability to tailor my approach to the specific operating system and its peculiarities.
I am comfortable using diverse monitoring tools capable of handling these varied environments, and can easily adapt to new operating systems as needed. This adaptability is essential in today’s diverse IT landscapes.
Q 19. How do you ensure the scalability of your monitoring system?
Ensuring scalability in a monitoring system is vital for accommodating growth and changes in infrastructure. It’s like building a house with expandable wings—able to accommodate a growing family. My approach centers on several key strategies:
Horizontal Scaling: Adding more monitoring agents or servers to distribute the load, ensuring that the system can handle an increasing number of devices and data without performance degradation.
Distributed Architecture: Designing a distributed architecture that allows components to operate independently, preventing single points of failure and enabling easier scaling.
Database Optimization: Selecting and optimizing the database to efficiently handle growing data volumes. This could involve using a scalable database technology like NoSQL or sharding an existing SQL database.
Cloud-based solutions: Leveraging cloud-based monitoring solutions that can automatically scale resources based on demand, eliminating the need for manual intervention.
Modular Design: Designing a modular monitoring system that allows for easy addition or removal of components as needed, adapting to evolving monitoring requirements.
In a previous project, we migrated our monitoring system to a cloud-based platform, achieving significant scalability gains while reducing operational overhead. The system effortlessly adapted to a dramatic increase in the number of monitored devices with no noticeable impact on performance.
Q 20. What are your preferred methods for documenting monitoring processes and configurations?
Thorough documentation is essential for maintaining and troubleshooting a monitoring system. It’s like a detailed instruction manual for your infrastructure. My preferred methods include:
Configuration Management Tools: Using configuration management tools such as Ansible, Puppet, or Chef to automate the deployment and management of monitoring agents and infrastructure. These tools provide an audit trail and make it easier to reproduce configurations across environments.
Version Control Systems: Storing all monitoring configurations in a version control system (e.g., Git) to track changes, facilitate rollbacks, and ensure collaboration among team members.
Centralized Documentation Repository: Maintaining a centralized repository for all documentation, including architecture diagrams, network diagrams, monitoring configurations, procedures, and troubleshooting guides. Tools such as Confluence or Notion are commonly used.
Runbooks and Standard Operating Procedures (SOPs): Creating detailed runbooks and SOPs for common tasks, such as adding new devices, troubleshooting alerts, and performing upgrades. These documents provide standardized guidance, ensuring consistency and efficiency.
Automated Reporting: Generating automated reports on system performance and status to track key metrics and identify trends.
By adhering to these practices, we can ensure that the monitoring system remains well-documented, understandable, and easily maintainable over time, reducing potential downtime and enabling efficient troubleshooting.
Q 21. Describe your experience with integrating monitoring tools with other IT systems.
Integrating monitoring tools with other IT systems is crucial for a holistic view of the IT infrastructure. Think of it as connecting different pieces of a puzzle to create a complete picture. My experience includes:
APIs and Integrations: Using APIs and pre-built integrations to connect monitoring tools with other IT systems such as ticketing systems (e.g., ServiceNow, Jira), CMDB (Configuration Management Database), and ITSM (IT Service Management) tools. This allows for automated incident response and streamlined workflows.
Data Exchange: Implementing secure data exchange mechanisms between monitoring tools and other systems to share critical performance data. This enables more comprehensive analysis and reporting.
Event Correlation: Using event correlation techniques to analyze events from multiple sources to identify root causes and resolve incidents more efficiently. For example, correlating a spike in CPU utilization with a database error can greatly expedite troubleshooting.
Custom Scripting and Automation: Utilizing custom scripting (Python, PowerShell, etc.) to create custom integrations and automate tasks when pre-built integrations are not available.
In a recent project, we integrated our monitoring system with the company’s ticketing system. This automation ensured that when a critical system alert was triggered, a ticket was automatically created, notifying the appropriate teams and accelerating the resolution process.
Q 22. How do you handle false positives in your monitoring system?
False positives in device monitoring are alerts that signal a problem when, in reality, no issue exists. Handling them efficiently is crucial for maintaining a productive monitoring system and avoiding alert fatigue. My approach involves a multi-layered strategy:
Sophisticated Alerting Logic: I focus on implementing robust alerting rules based on multiple data points rather than relying on single thresholds. For example, instead of alerting on a single high CPU spike, I’d set alerts triggered only if high CPU usage persists for a certain duration, combined with high disk I/O or memory consumption. This helps filter out transient anomalies.
Correlation and Contextual Analysis: I leverage correlation engines to analyze multiple alerts simultaneously. If multiple unrelated alerts occur at the same time, it might indicate a false positive wave triggered by a temporary network blip or software update. I’d investigate the root cause before acting on individual alerts.
Machine Learning and Anomaly Detection: Integrating machine learning algorithms into the monitoring system allows for the identification of unusual patterns that deviate from established baselines. This helps to pinpoint true anomalies more accurately while filtering out expected variations.
Regular Review and Tuning: Regularly reviewing the alerts generated, focusing on those frequently marked as false positives, is key. This allows for adjustments to alert thresholds and rules, improving the system’s accuracy over time. Automated reporting on false positives can streamline this process.
Automated Suppression (with Caution): In specific cases, automated suppression can be implemented for alerts consistently identified as false positives. However, this requires careful consideration and meticulous testing to avoid masking real issues.
For instance, in one project, we reduced false positives by 60% by implementing a correlation rule that dismissed high memory usage alerts if they occurred alongside scheduled backups. This dramatically improved the efficiency of our monitoring team.
Q 23. Explain your experience with performance tuning based on monitoring data.
Performance tuning based on monitoring data is a critical aspect of maintaining optimal system efficiency. My experience encompasses a systematic approach involving these steps:
Data Collection and Analysis: I start by thoroughly reviewing the monitoring data, focusing on key performance indicators (KPIs) like CPU utilization, memory usage, disk I/O, network latency, and application response times. Tools like Nagios, Prometheus, or Datadog are frequently utilized.
Bottleneck Identification: Through analyzing trends and patterns in the data, I pinpoint bottlenecks that limit performance. For example, consistently high CPU usage might indicate the need for more powerful hardware or code optimization. Slow disk I/O could necessitate upgrading storage or optimizing database queries.
Targeted Optimization: Once bottlenecks are identified, I implement targeted optimization strategies. This might involve upgrading hardware, optimizing software code, adjusting database configurations, or improving network infrastructure. Detailed logging and monitoring are crucial to evaluate the effectiveness of changes.
Testing and Validation: After implementing changes, rigorous testing is conducted to validate that performance improvements have been achieved. This often involves using load testing tools to simulate real-world conditions.
Iterative Process: Performance tuning is an iterative process. Continuous monitoring allows for the identification of new bottlenecks and the implementation of further optimizations. Regular review of monitoring data provides insights into the ongoing performance and potential future issues.
For example, in a recent project, by analyzing monitoring data showing consistently high database query times, we identified inefficient queries. Optimizing these queries resulted in a 40% reduction in database response times and a significant improvement in overall application performance.
Q 24. What is your experience with using monitoring data for reporting and analysis?
Monitoring data is invaluable for generating insightful reports and conducting in-depth analysis. My experience includes:
Custom Report Generation: I frequently create custom reports that track key performance indicators (KPIs) over time, highlighting trends and identifying potential problems. These reports utilize data visualization techniques to make complex information accessible and understandable.
Capacity Planning: Monitoring data is crucial for effective capacity planning. By analyzing historical trends in resource utilization, I can accurately predict future needs and avoid performance bottlenecks. This helps optimize resource allocation and reduce costs.
Performance Analysis and Troubleshooting: Monitoring data plays a vital role in identifying the root causes of performance issues. By analyzing logs and metrics, I pinpoint the source of problems, significantly speeding up troubleshooting and reducing downtime.
Compliance and Auditing: In regulated industries, monitoring data provides evidence of system performance and compliance with regulatory requirements. I use this data to generate compliance reports and support audits.
Data Visualization Tools: I’m proficient in using various data visualization tools, such as Grafana and Kibana, to create clear and concise dashboards that provide real-time insights into system performance.
For example, using historical monitoring data, I was able to predict a future storage capacity shortage, allowing us to proactively upgrade our storage infrastructure and prevent a potential service disruption. This saved the organization both time and money.
Q 25. Describe your understanding of different types of device monitoring (e.g., network, server, application).
Device monitoring encompasses several key areas, each with its specific requirements and methodologies:
Network Monitoring: This involves tracking network traffic, bandwidth usage, latency, and device availability. Tools like SolarWinds or PRTG are commonly used to monitor routers, switches, and firewalls, ensuring network connectivity and performance. Key metrics include packet loss, jitter, and round-trip time.
Server Monitoring: This focuses on tracking the performance of servers, including CPU utilization, memory usage, disk I/O, and network activity. Metrics like uptime, response times, and error rates are essential. Tools like Nagios, Zabbix, or Centreon are often employed.
Application Monitoring: This involves tracking the performance and availability of applications, including response times, error rates, and resource consumption. Application Performance Monitoring (APM) tools provide insights into application behavior and identify bottlenecks. Examples include Dynatrace, AppDynamics, and New Relic.
Database Monitoring: This focuses on the performance and availability of databases, monitoring metrics such as query execution times, connection pools, and disk I/O. Tools like DataGrip, pgAdmin, or MySQL Workbench, along with specialized database monitoring solutions, are used.
Cloud Monitoring: This involves monitoring cloud resources such as virtual machines, storage, and network connectivity using cloud-specific monitoring tools such as AWS CloudWatch, Azure Monitor, or Google Cloud Monitoring. This ensures efficient resource utilization and optimal performance within the cloud environment.
My experience spans all these areas, allowing me to develop comprehensive monitoring strategies tailored to the specific needs of different systems and applications.
Q 26. How do you stay up-to-date with the latest advancements in device monitoring technologies?
Staying current in the rapidly evolving field of device monitoring requires a multifaceted approach:
Industry Publications and Conferences: I regularly read industry publications such as Network World, InfoWorld, and TechTarget, and attend relevant conferences to learn about new technologies and best practices.
Online Courses and Webinars: I actively participate in online courses and webinars offered by platforms like Coursera, Udemy, and various technology vendors. This allows me to deepen my knowledge of specific technologies and tools.
Vendor Documentation and Training: I engage with vendor documentation and participate in training sessions provided by leading monitoring solution providers to gain a deeper understanding of their offerings and best practices.
Professional Networking: I actively participate in professional networks and communities, such as those on LinkedIn and other industry-specific forums, to exchange ideas and learn from other experts.
Hands-on Experience: I believe that hands-on experience is crucial. I regularly experiment with new monitoring tools and technologies, applying my learning to real-world scenarios.
This continuous learning ensures I remain informed about the latest advancements in device monitoring, allowing me to apply cutting-edge technologies and techniques to enhance the effectiveness and efficiency of monitoring systems.
Q 27. Describe a situation where you had to troubleshoot a complex device monitoring issue.
In a previous role, we experienced a significant performance degradation in our e-commerce platform during peak shopping hours. Initial monitoring alerts pointed to high CPU utilization on the application servers, but standard troubleshooting steps proved ineffective. This required a more in-depth analysis.
My approach involved the following steps:
Detailed Data Analysis: I went beyond the initial CPU utilization metrics and analyzed detailed logs and performance counters across the entire application stack – web servers, application servers, databases, and caching layers. This revealed that the primary bottleneck was not the CPU, but rather slow database queries triggered by a surge in concurrent user requests.
Database Profiling: Using database profiling tools, I identified specific SQL queries that were consuming excessive resources. This led to the discovery of poorly optimized queries and inefficient database indexing.
Query Optimization and Indexing: We implemented database query optimizations, including rewriting inefficient queries and adding appropriate indexes. This significantly reduced database response times.
Caching Strategy Enhancement: We also enhanced our caching strategy, leveraging a more effective caching mechanism to reduce the load on the database. This further improved response times and overall application performance.
Load Testing: Finally, we performed comprehensive load testing to simulate peak traffic conditions, confirming the effectiveness of our optimizations and ensuring the system’s stability.
Through this systematic approach, we successfully resolved the performance bottleneck, improving application responsiveness and ensuring the platform’s stability during peak hours. The experience highlighted the importance of thorough investigation and using comprehensive monitoring data to identify the root cause of complex issues.
Q 28. What are your salary expectations for this role?
My salary expectations for this role are in the range of $120,000 to $150,000 per year, depending on the specific benefits package and overall compensation structure. This expectation is based on my extensive experience in device monitoring and management, my proven ability to solve complex problems, and my consistent delivery of positive results. I am confident that my skills and experience would be a valuable asset to your organization.
Key Topics to Learn for Device Monitoring and Management Interview
- Network Monitoring Fundamentals: Understanding network protocols, topology, and common monitoring tools (SNMP, NetFlow, etc.). Practical application: Troubleshooting network connectivity issues and identifying performance bottlenecks.
- System Monitoring and Logging: Proficiency in system logs analysis, event correlation, and metric interpretation. Practical application: Identifying and resolving system errors, security breaches, and performance degradation.
- Security Information and Event Management (SIEM): Knowledge of SIEM tools and techniques for threat detection and security incident response. Practical application: Analyzing security logs to identify and mitigate security risks.
- Cloud Monitoring and Management: Experience with cloud-based monitoring platforms (e.g., AWS CloudWatch, Azure Monitor) and understanding of cloud-specific monitoring challenges. Practical application: Optimizing cloud resource utilization and ensuring application availability.
- Data Visualization and Reporting: Ability to create insightful dashboards and reports based on monitoring data. Practical application: Presenting key performance indicators (KPIs) and actionable insights to stakeholders.
- Automation and Orchestration: Familiarity with scripting languages (e.g., Python, PowerShell) and automation tools for efficient device management. Practical application: Automating repetitive tasks, such as software deployments and configuration changes.
- ITIL Framework and Best Practices: Understanding of incident management, problem management, and change management processes within the ITIL framework. Practical application: Contributing to a robust and efficient IT operations team.
- Troubleshooting and Problem-Solving Techniques: Demonstrating a systematic approach to identify the root cause of issues and implement effective solutions. Practical application: Effectively diagnosing and resolving complex technical problems.
Next Steps
Mastering Device Monitoring and Management is crucial for a successful and rewarding career in IT. This skillset is highly sought after, opening doors to diverse roles with excellent growth potential. To maximize your job prospects, it’s essential to create a compelling and ATS-friendly resume that highlights your skills and experience. We encourage you to leverage ResumeGemini, a trusted resource for building professional resumes. ResumeGemini offers examples of resumes tailored to Device Monitoring and Management roles to help you craft the perfect application.
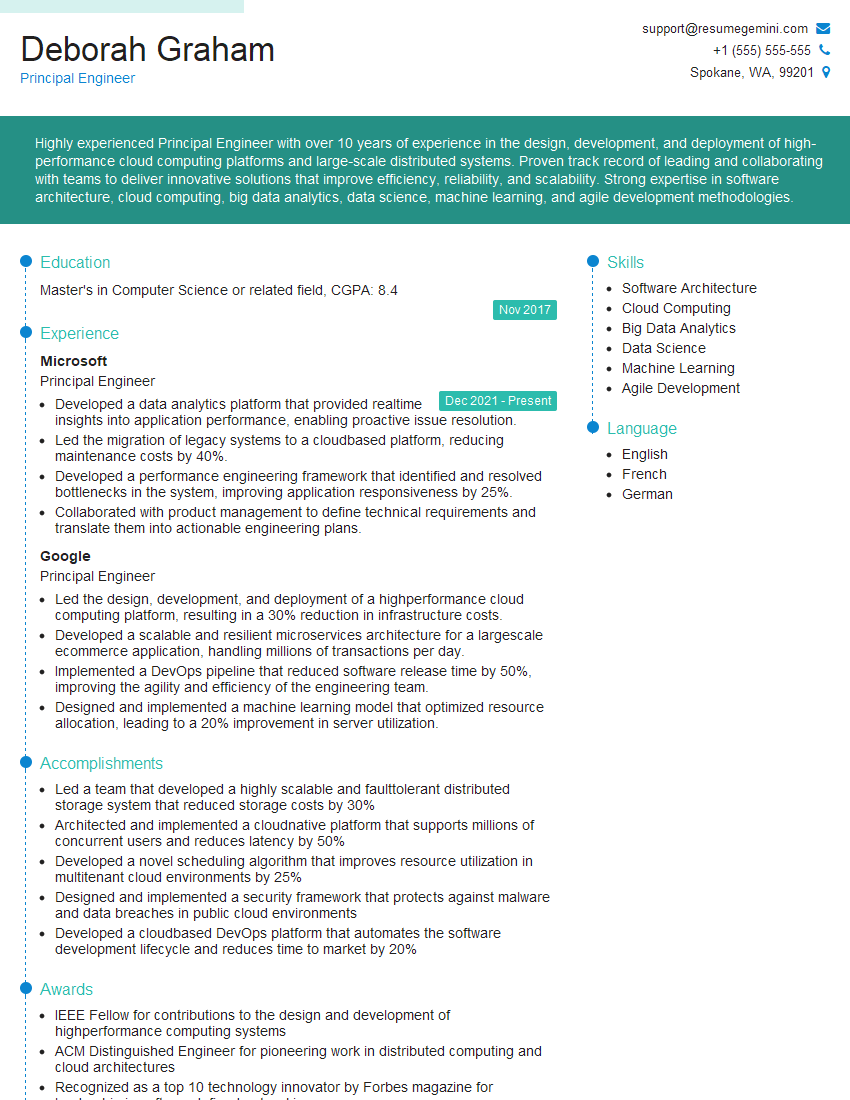
Principal Engineer Resume Sample
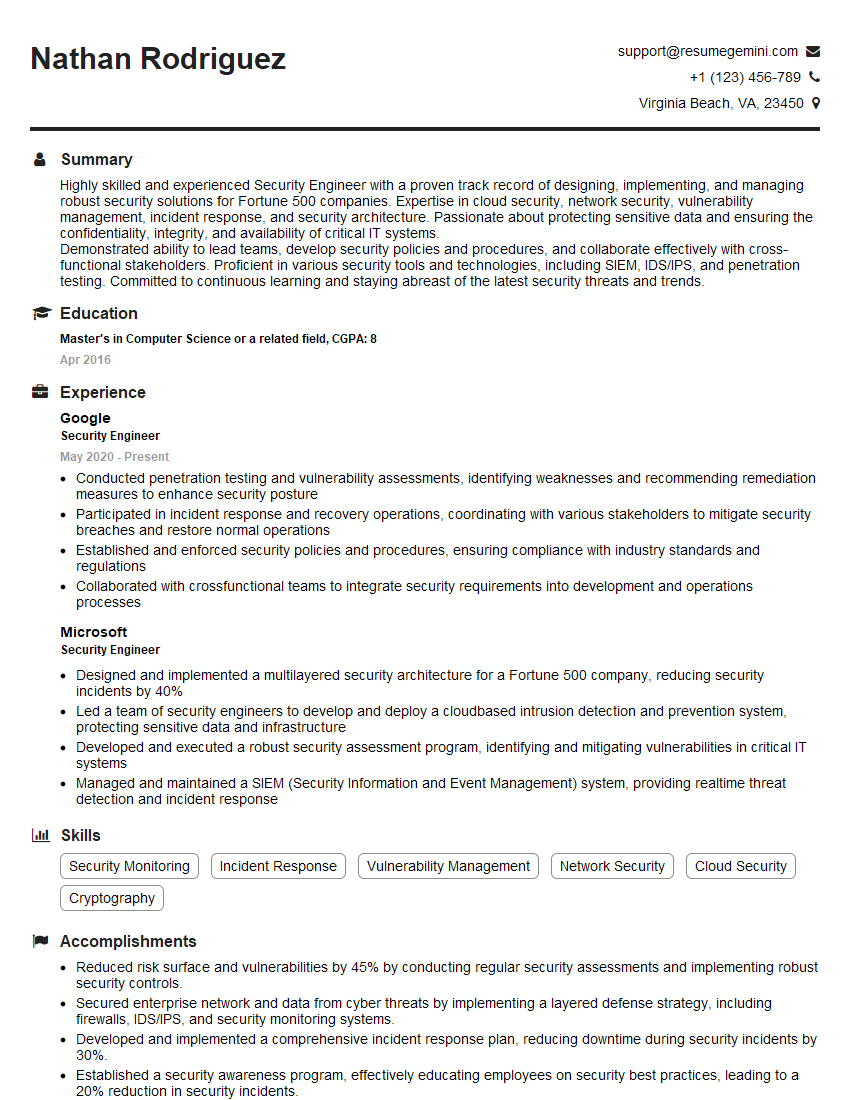
Security Engineer Resume Sample
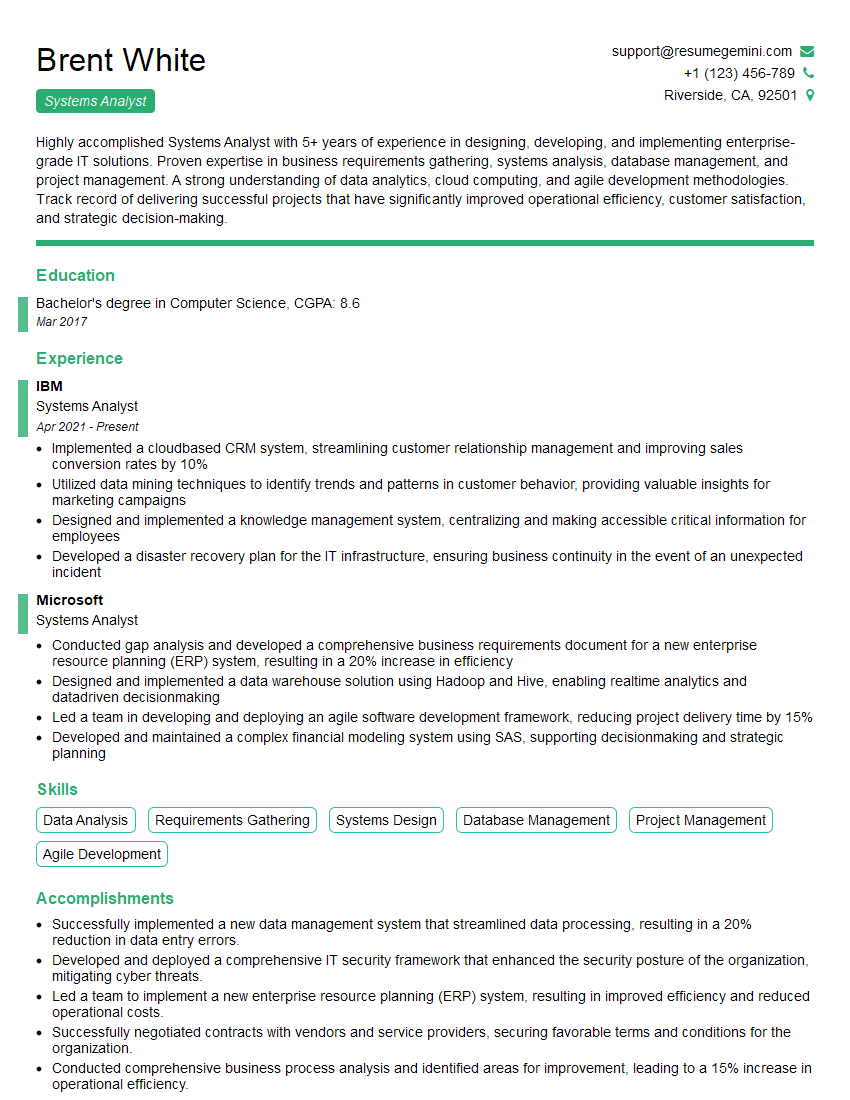
Systems Analyst Resume Sample
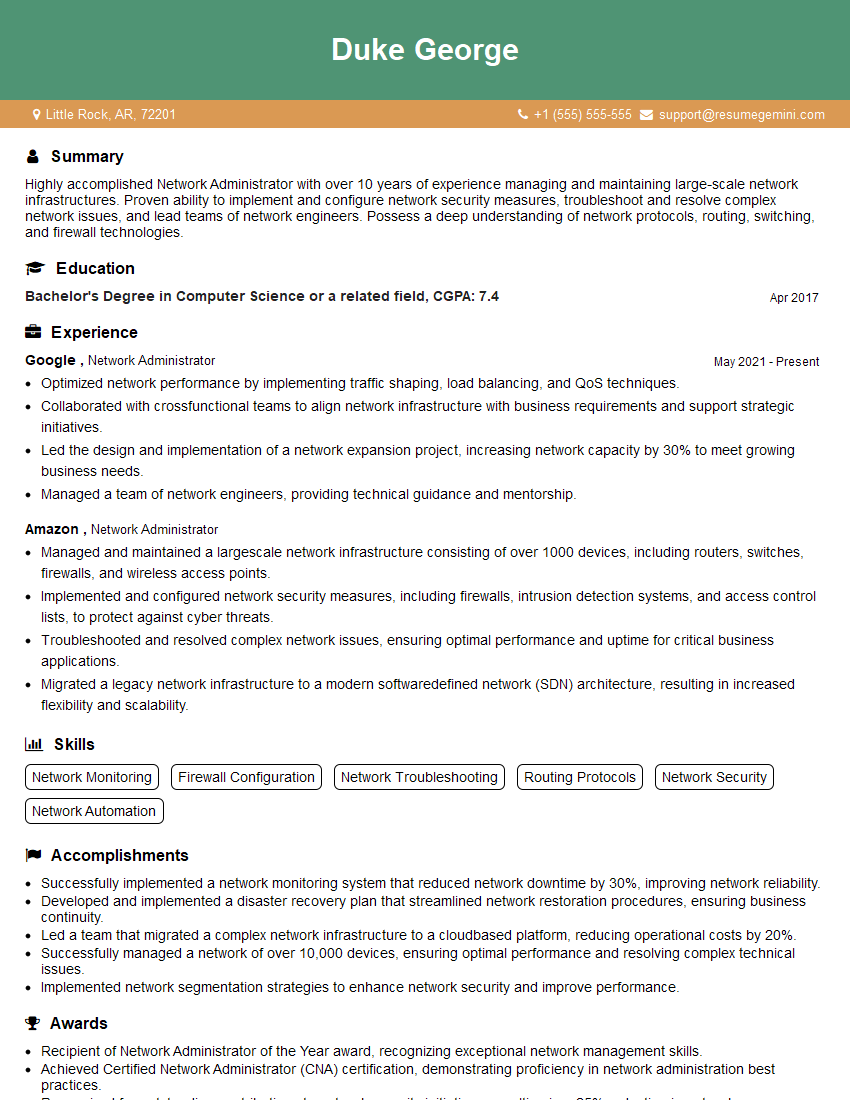
Network Administrator Resume Sample
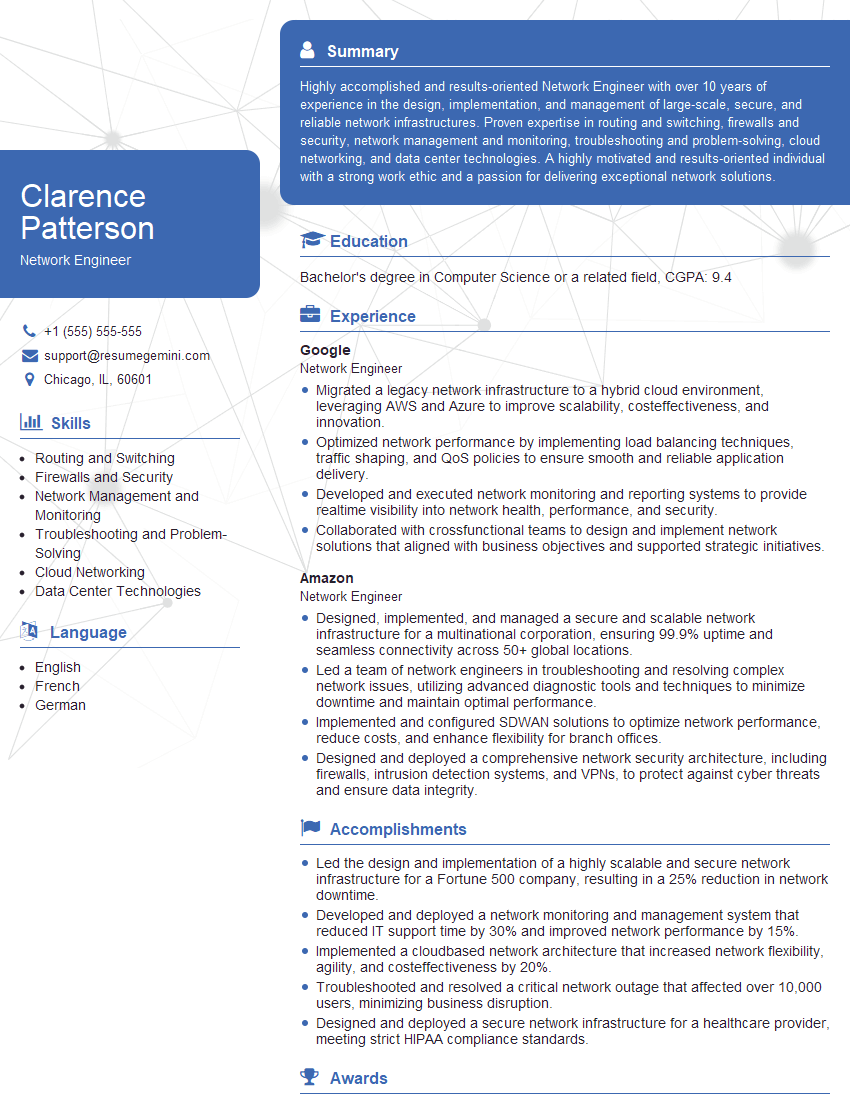
Network Engineer Resume Sample

Technical Support Engineer Resume Sample
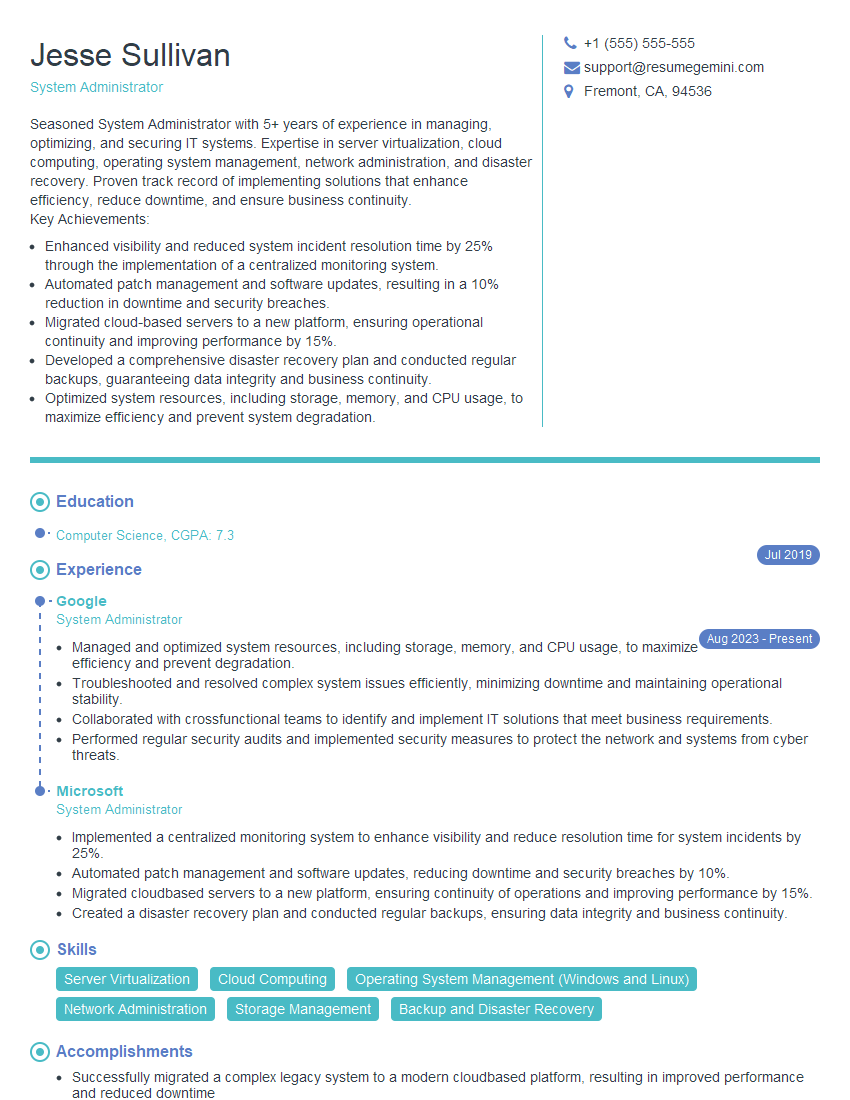
System Administrator Resume Sample
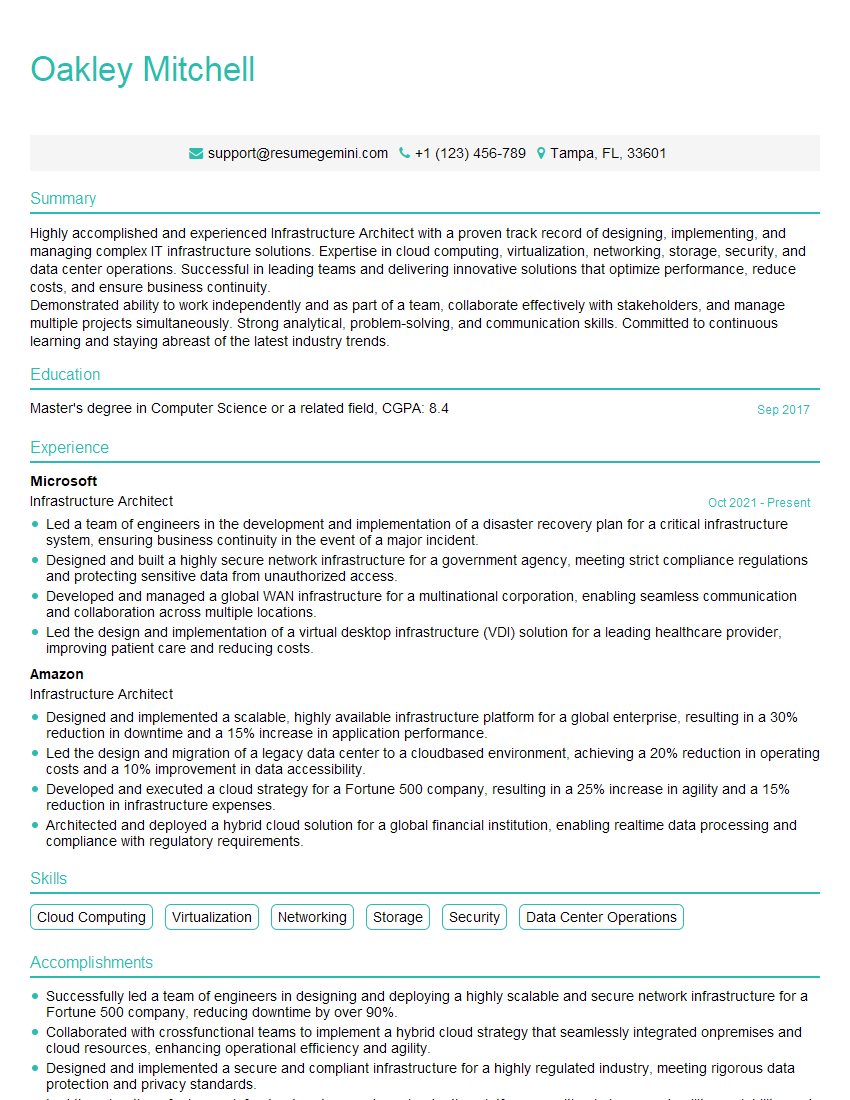
Infrastructure Architect Resume Sample
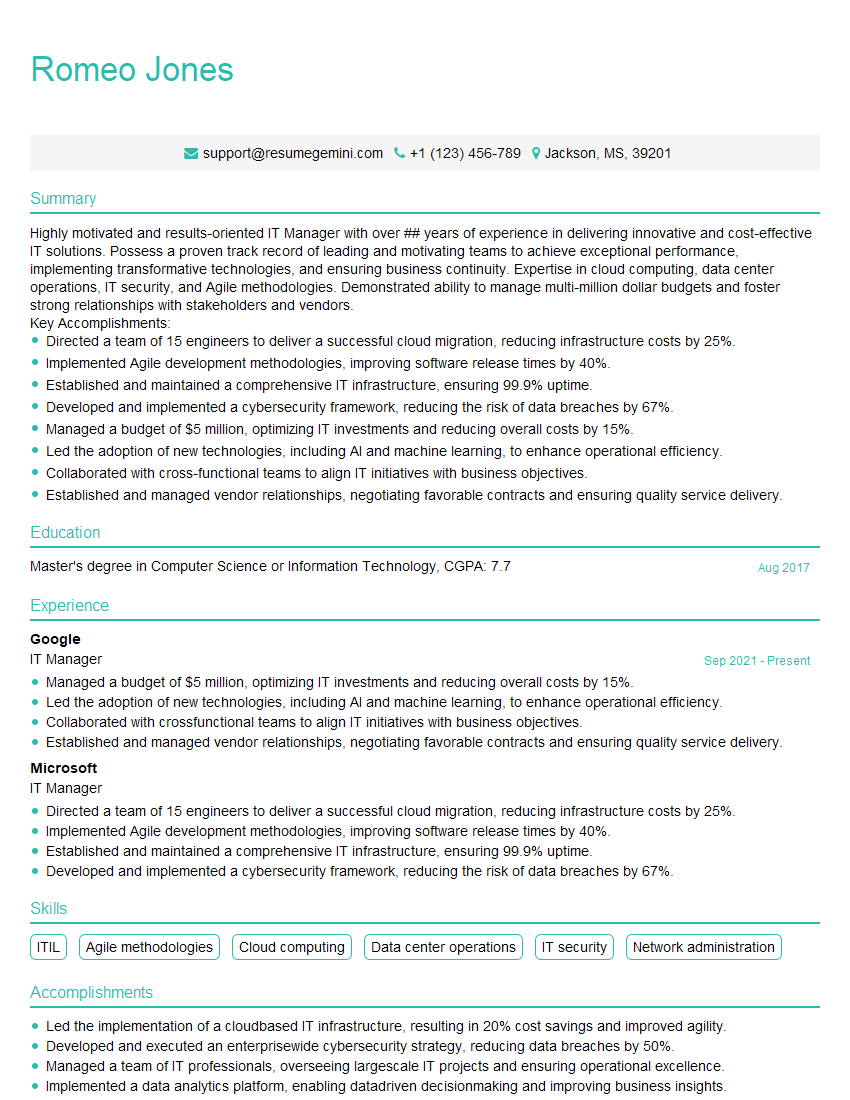
IT Manager Resume Sample
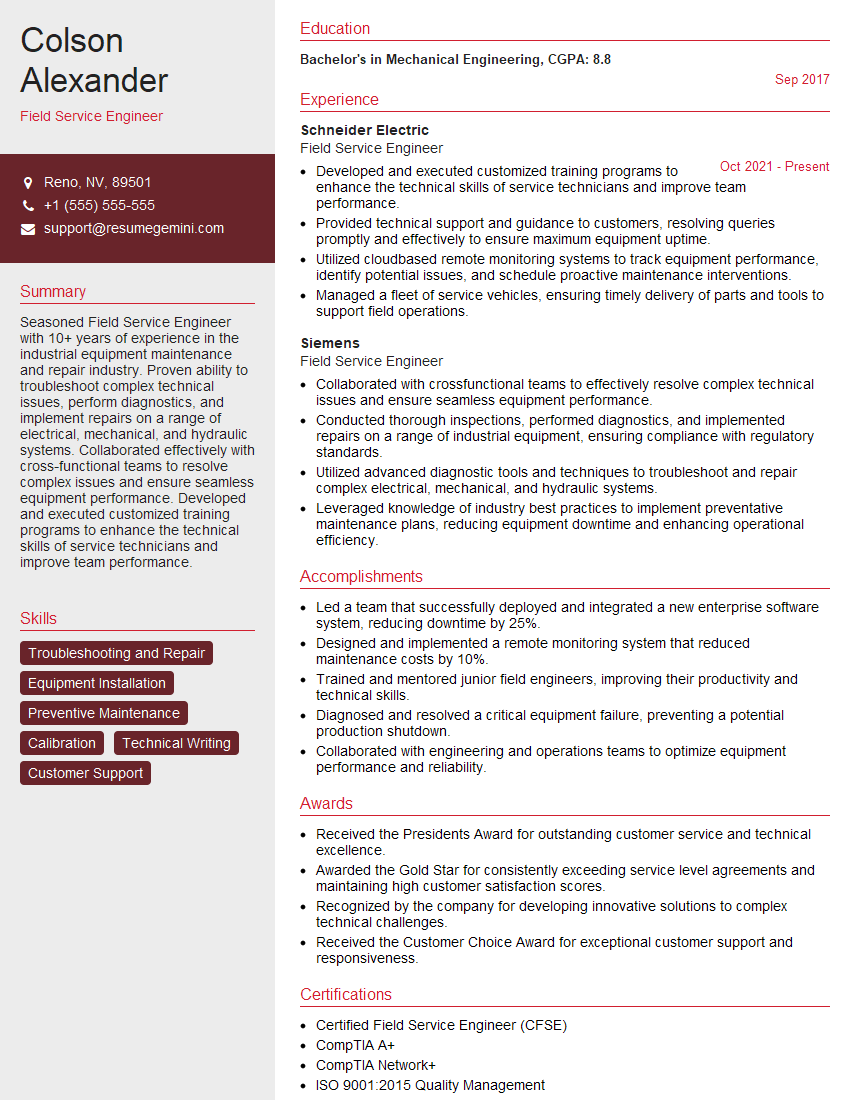
Field Service Engineer Resume Sample
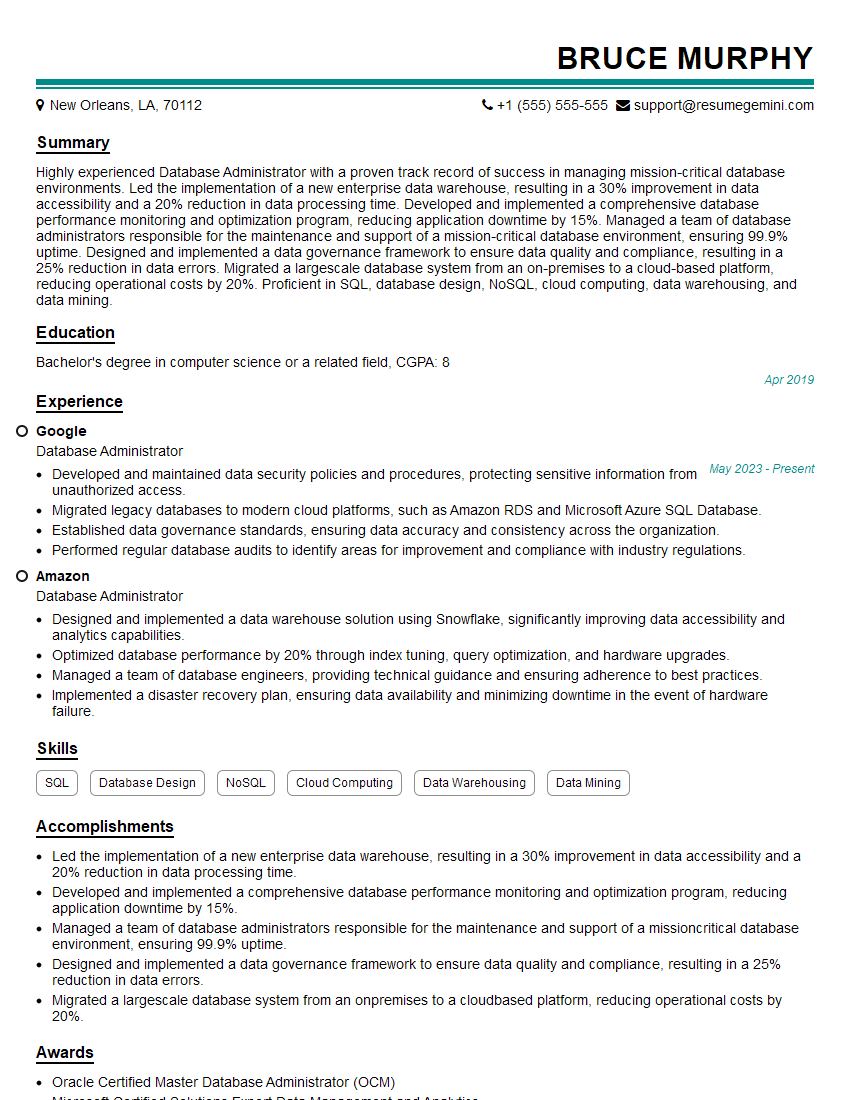
Database Administrator Resume Sample
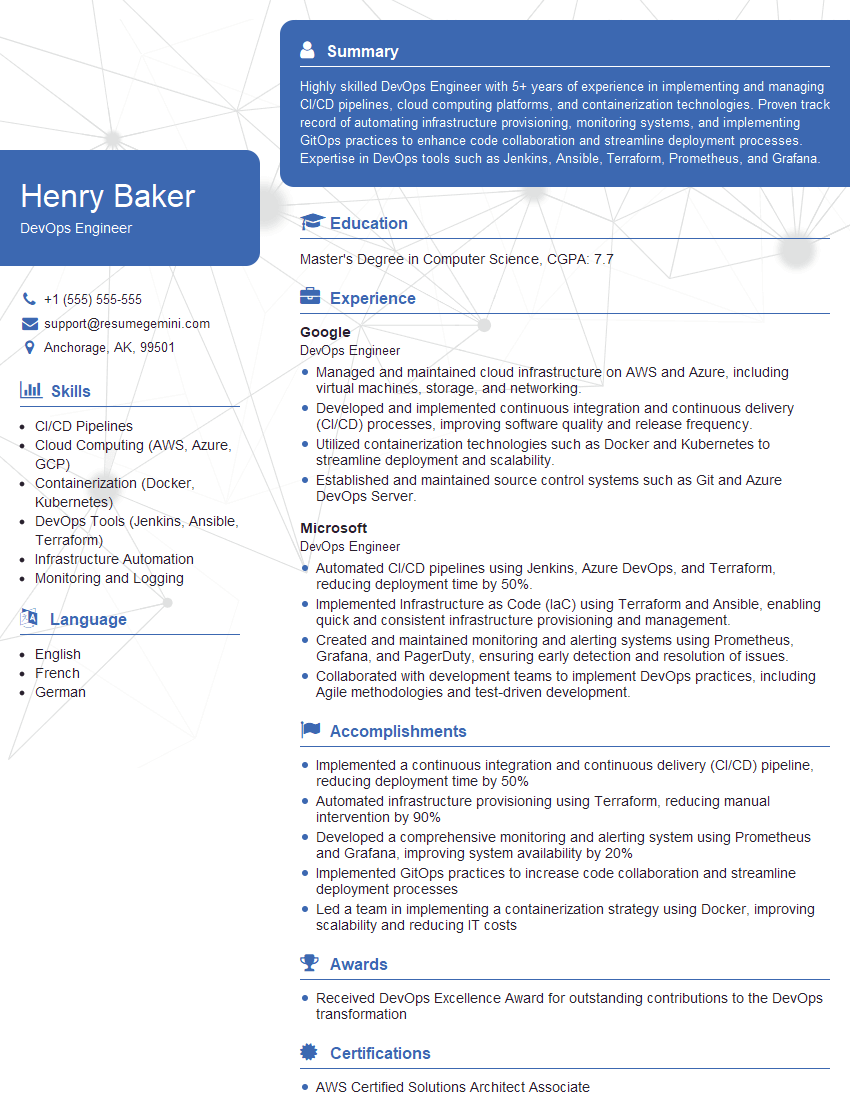
DevOps Engineer Resume Sample
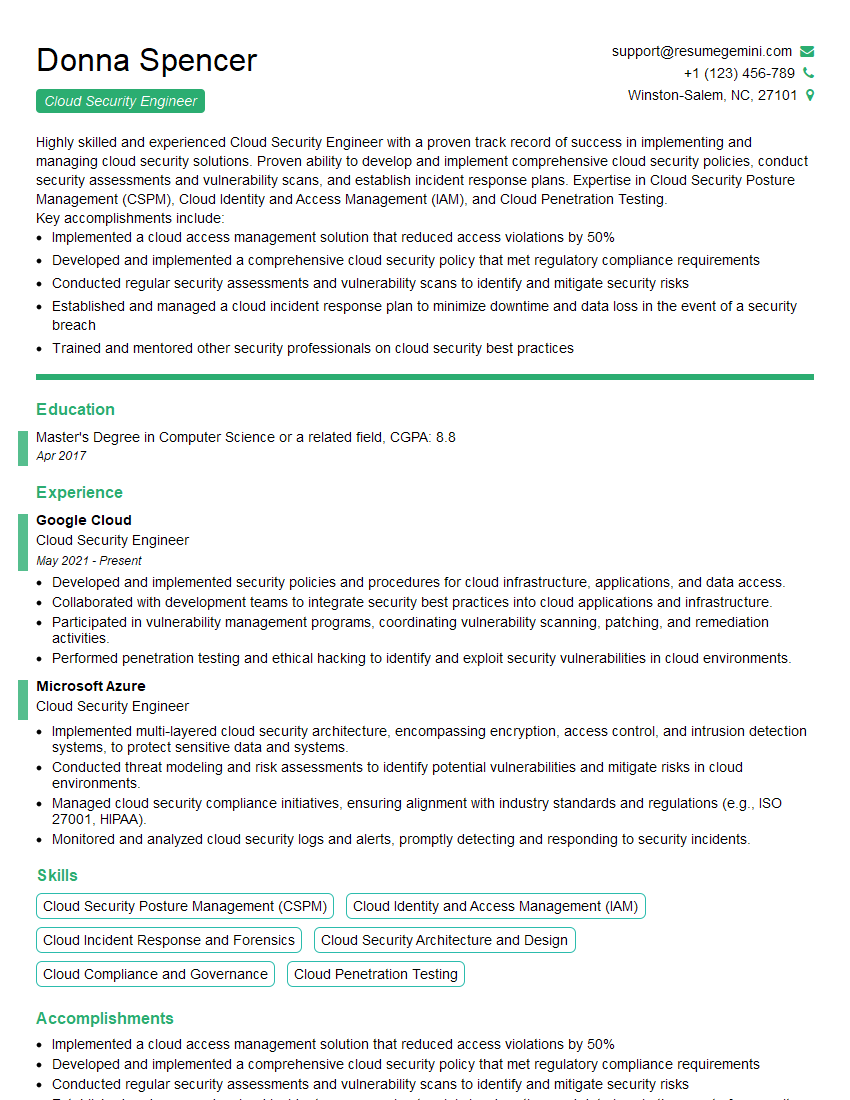
Cloud Security Engineer Resume Sample
Explore more articles
Users Rating of Our Blogs
Share Your Experience
We value your feedback! Please rate our content and share your thoughts (optional).
What Readers Say About Our Blog
To the interviewgemini.com Webmaster.
Very helpful and content specific questions to help prepare me for my interview!
Thank you
To the interviewgemini.com Webmaster.
This was kind of a unique content I found around the specialized skills. Very helpful questions and good detailed answers.
Very Helpful blog, thank you Interviewgemini team.