Are you ready to stand out in your next interview? Understanding and preparing for Expertise in Data Management and Statistical Analysis interview questions is a game-changer. In this blog, we’ve compiled key questions and expert advice to help you showcase your skills with confidence and precision. Let’s get started on your journey to acing the interview.
Questions Asked in Expertise in Data Management and Statistical Analysis Interview
Q 1. Explain the difference between correlation and causation.
Correlation and causation are often confused, but they represent distinct relationships between variables. Correlation simply indicates a statistical association between two or more variables – when one changes, the other tends to change as well. This change can be positive (both increase together), negative (one increases while the other decreases), or zero (no relationship). Causation, on the other hand, implies that one variable directly influences or causes a change in another. A causal relationship suggests a mechanism or process linking the variables.
Example: Ice cream sales and crime rates might show a positive correlation – both tend to increase during summer. However, this doesn’t mean that eating ice cream *causes* crime. Both are influenced by a third variable: hot weather. The hot weather is the causal factor affecting both ice cream sales and crime rates, creating a spurious correlation.
In data analysis, it’s crucial to distinguish correlation from causation. Observing a correlation doesn’t automatically imply causation; further investigation, including controlled experiments or causal inference techniques, is necessary to establish a causal link.
Q 2. What are the assumptions of linear regression?
Linear regression models assume several key conditions for accurate and reliable results. Violating these assumptions can lead to biased or inefficient estimates.
- Linearity: The relationship between the independent and dependent variables should be approximately linear. A scatter plot can help visualize this.
- Independence of Errors: The errors (residuals) should be independent of each other. Autocorrelation (correlation between consecutive errors) violates this assumption, often seen in time series data.
- Homoscedasticity: The variance of the errors should be constant across all levels of the independent variable. Heteroscedasticity (non-constant variance) can lead to inefficient estimates.
- Normality of Errors: The errors should be normally distributed. This assumption is crucial for hypothesis testing and confidence interval calculations, although less critical with large sample sizes (due to the Central Limit Theorem).
- No Multicollinearity: In multiple linear regression, independent variables should not be highly correlated with each other. High multicollinearity can inflate the variance of the coefficient estimates, making it difficult to interpret the individual effects of predictors.
Diagnostics plots, such as residual plots and Q-Q plots, are used to assess these assumptions. If assumptions are violated, transformations of variables (e.g., logarithmic transformation) or alternative modeling techniques might be necessary.
Q 3. How do you handle missing data in a dataset?
Handling missing data is a critical step in data preprocessing. Ignoring missing data can lead to biased results and inaccurate conclusions. The best approach depends on the nature and extent of the missing data, as well as the context of the analysis.
- Deletion methods:
- Listwise deletion (complete case analysis): Remove entire rows with any missing values. Simple but can lead to significant data loss, especially with many variables or a high percentage of missing data.
- Pairwise deletion: Use available data for each analysis, but this can lead to inconsistencies across analyses.
- Imputation methods:
- Mean/median/mode imputation: Replace missing values with the mean, median, or mode of the observed values. Simple but can reduce variance and distort relationships.
- Regression imputation: Predict missing values using a regression model based on other variables. More sophisticated but assumes a linear relationship.
- Multiple imputation: Create multiple plausible imputed datasets and combine the results. Accounts for uncertainty in the imputation process, providing more robust estimates.
- K-Nearest Neighbors (KNN) imputation: Impute missing values based on the values of the ‘k’ nearest neighbors in the data. Considers proximity in feature space.
The choice of method requires careful consideration. Multiple imputation is often preferred for its robustness, while simple methods like mean imputation are suitable only when missing data is minimal and randomly distributed.
Q 4. Describe different methods for data normalization.
Data normalization, also called feature scaling, transforms the range of data features to a standard scale. This is essential for many machine learning algorithms which are sensitive to feature scaling (like distance-based algorithms such as k-NN or algorithms that use gradient descent).
- Min-Max scaling: Scales features to a range between 0 and 1. Formula:
x' = (x - min(x)) / (max(x) - min(x)) - Z-score standardization: Centers the data around a mean of 0 and a standard deviation of 1. Formula:
x' = (x - mean(x)) / std(x) - Robust scaling: Similar to Z-score but uses the median and interquartile range instead of mean and standard deviation, making it less sensitive to outliers. Formula:
x' = (x - median(x)) / IQR(x)
The choice of method depends on the dataset and the algorithm used. Min-max scaling is suitable when the distribution is roughly uniform, while Z-score standardization is useful when the distribution is approximately normal. Robust scaling is robust to outliers.
Q 5. What are the advantages and disadvantages of different data visualization techniques?
Data visualization techniques offer powerful ways to explore and communicate data insights. Different techniques have strengths and weaknesses depending on the type of data and the message to be conveyed.
- Bar charts: Good for comparing categorical data. Simple to understand but can become cluttered with many categories.
- Line charts: Ideal for showing trends over time or continuous data. Easy to interpret but may not be suitable for comparing many categories.
- Scatter plots: Useful for exploring relationships between two numerical variables. Can reveal correlations and outliers but can be difficult to interpret with many data points.
- Histograms: Show the distribution of a single numerical variable. Useful for identifying patterns like skewness and modality but can be sensitive to bin width choices.
- Heatmaps: Display data in a grid format using color intensity to represent values. Excellent for visualizing large matrices but can be difficult to interpret with too many values.
The choice of visualization technique should be guided by the specific data and the insights you want to communicate. Effective visualizations are clear, concise, and avoid misleading interpretations.
Q 6. Explain the bias-variance tradeoff.
The bias-variance tradeoff is a fundamental concept in machine learning. It describes the tension between a model’s ability to fit the training data (low bias) and its ability to generalize to unseen data (low variance).
Bias refers to the error introduced by approximating a real-world problem, which might be complex, by a simplified model. High bias can lead to underfitting, where the model is too simple to capture the underlying patterns in the data and performs poorly on both training and test data.
Variance refers to the model’s sensitivity to fluctuations in the training data. High variance can lead to overfitting, where the model learns the training data too well, including its noise and outliers, and performs poorly on unseen data.
The goal is to find a balance between bias and variance. A model with low bias and low variance is ideal, but this often requires careful model selection and tuning of hyperparameters. Techniques like cross-validation and regularization can help mitigate overfitting and improve generalization.
Q 7. How do you evaluate the performance of a classification model?
Evaluating the performance of a classification model involves assessing its ability to correctly classify new, unseen data. Several metrics are commonly used, often depending on the specific problem and the class distribution.
- Accuracy: The proportion of correctly classified instances. Simple to understand but can be misleading when classes are imbalanced.
- Precision: Out of all instances predicted as positive, what proportion was actually positive? Focuses on the positive class predictions’ accuracy. Formula:
Precision = TP / (TP + FP)(TP=True Positives, FP=False Positives) - Recall (Sensitivity): Out of all the actual positive instances, what proportion did the model correctly identify? Focuses on capturing all positive cases. Formula:
Recall = TP / (TP + FN)(FN=False Negatives) - F1-score: The harmonic mean of precision and recall. Provides a balanced measure considering both false positives and false negatives. Formula:
F1 = 2 * (Precision * Recall) / (Precision + Recall) - AUC (Area Under the ROC Curve): Measures the model’s ability to distinguish between classes across different thresholds. Useful for evaluating the model’s performance across various operating points.
- Confusion Matrix: A table showing the counts of true positives, true negatives, false positives, and false negatives. Provides a detailed breakdown of the model’s performance across all classes.
The choice of metrics depends on the problem’s context. For example, in medical diagnosis, high recall is crucial (avoiding missing positive cases), even if it means accepting more false positives.
Q 8. What are some common data mining techniques?
Data mining techniques are methods used to extract knowledge and insights from large datasets. They range from simple statistical analysis to complex machine learning algorithms. Some common techniques include:
- Classification: Assigning data points to predefined categories (e.g., spam detection, customer churn prediction). Think of it like sorting mail – you’re classifying each letter as junk mail or important mail based on certain characteristics.
- Regression: Predicting a continuous value (e.g., house price prediction, sales forecasting). Imagine predicting the yield of a crop based on factors like rainfall and fertilizer usage.
- Clustering: Grouping similar data points together (e.g., customer segmentation, anomaly detection). This is like organizing your books – grouping them by genre or author.
- Association Rule Mining: Discovering relationships between variables (e.g., market basket analysis – finding products frequently bought together). A classic example is ‘customers who bought diapers also bought beer’.
- Sequential Pattern Mining: Identifying patterns in sequential data (e.g., web clickstream analysis). This involves observing the order of events, for example, understanding the sequence of steps a user takes before making a purchase on a website.
The choice of technique depends heavily on the nature of the data and the goals of the analysis. For instance, if you want to predict a numerical value, you’d use regression. If you want to group similar data points, you’d use clustering.
Q 9. Explain the concept of overfitting and underfitting.
Overfitting and underfitting are common problems in machine learning where a model doesn’t generalize well to new, unseen data. Imagine teaching a dog a trick – you want it to perform reliably in various situations, not just when you’re specifically practicing.
Overfitting occurs when a model learns the training data too well, including its noise and outliers. It performs exceptionally well on the training data but poorly on new data. Think of it as memorizing the answers to a test instead of understanding the underlying concepts – you’ll do great on that specific test but fail the next one. A complex model with many parameters is more prone to overfitting.
Underfitting happens when a model is too simple to capture the underlying patterns in the data. It performs poorly on both the training and new data. This is like using a very basic model to predict house prices – you ignore important factors like location and size, resulting in inaccurate predictions.
To avoid these issues, techniques like cross-validation, regularization, and using simpler models can be employed. The key is finding the right balance between model complexity and generalization ability.
Q 10. What is the difference between supervised and unsupervised learning?
Supervised and unsupervised learning are two major categories of machine learning that differ in how they use data to train models.
Supervised learning uses labeled data, meaning each data point has a corresponding output or target variable. The algorithm learns to map inputs to outputs. Think of it like a teacher guiding a student – the teacher provides labeled examples (inputs and correct outputs), and the student learns to produce the correct output for new inputs. Examples include classification (e.g., image recognition) and regression (e.g., predicting house prices).
Unsupervised learning uses unlabeled data, meaning there’s no predefined output variable. The algorithm identifies patterns and structures in the data without guidance. It’s like giving a child a box of toys and letting them sort them into groups based on their own observations. Examples include clustering (grouping similar data points) and dimensionality reduction (reducing the number of variables while retaining important information).
Q 11. How do you perform A/B testing?
A/B testing (also known as split testing) is a method used to compare two versions of a webpage, app, or other digital experience to determine which performs better. It’s like conducting a controlled experiment to see which approach works best.
Here’s how it’s performed:
- Define your hypothesis: What are you trying to improve? (e.g., increase click-through rates, improve conversion rates).
- Create variations: Develop two or more versions (A and B) of the element you’re testing.
- Split your traffic: Randomly direct a portion of your users to version A and another portion to version B.
- Collect data: Track relevant metrics (e.g., clicks, conversions, time spent on page) for each version.
- Analyze the results: Use statistical tests (e.g., t-test, chi-square test) to determine if there’s a statistically significant difference between the performance of versions A and B. This ensures that the observed difference isn’t simply due to random chance.
- Implement the winning version: Once you have a statistically significant winner, implement that version for all users.
It’s crucial to ensure the test is statistically sound to avoid making decisions based on random variation. For example, using a sufficiently large sample size is vital for accurate results.
Q 12. What is the central limit theorem?
The Central Limit Theorem (CLT) is a fundamental concept in statistics. It states that the distribution of the sample means of a large number of independent, identically distributed random variables, regardless of the shape of their original distribution, will approximate a normal distribution. Imagine you’re measuring the heights of people in a city. Even if the heights aren’t perfectly normally distributed, the average height of many samples (say, 100 people each) will follow a normal distribution.
In simpler terms: If you take many samples from any population (provided it has a finite mean and variance), the average of those samples will be approximately normally distributed, with the mean of the sample means equal to the population mean, and the standard deviation equal to the population standard deviation divided by the square root of the sample size.
The CLT is critical for hypothesis testing and building confidence intervals because it allows us to make inferences about a population based on sample data, even if we don’t know the population’s true distribution.
Q 13. Explain different types of database joins.
Database joins combine rows from two or more tables based on a related column between them. They are essential for retrieving data from relational databases. Common types include:
- INNER JOIN: Returns rows only when there is a match in both tables based on the join condition.
- LEFT (OUTER) JOIN: Returns all rows from the left table (the one specified before
LEFT JOIN), even if there is no match in the right table. For rows without a match in the right table, the columns from the right table will haveNULLvalues. - RIGHT (OUTER) JOIN: Similar to
LEFT JOIN, but returns all rows from the right table andNULLvalues for unmatched rows in the left table. - FULL (OUTER) JOIN: Returns all rows from both tables. If there is a match, the corresponding rows are combined; otherwise,
NULLvalues are used for the unmatched columns.
For example, consider two tables: Customers (CustomerID, Name) and Orders (OrderID, CustomerID, OrderDate). An INNER JOIN would only return orders for customers present in both tables, while a LEFT JOIN would include all customers, even those without any orders.
The choice of join type depends entirely on the desired outcome of the query. If you only need matching data, an INNER JOIN suffices. If you need to include all data from one table regardless of matches, use a LEFT or RIGHT JOIN. For a comprehensive view of both tables, a FULL JOIN is appropriate. It’s important to understand these differences to correctly retrieve the necessary data.
Q 14. What are some common SQL queries you use frequently?
The specific SQL queries I frequently use depend on the task at hand, but some common examples include:
SELECT * FROM table_name;(Retrieves all columns and rows from a table)SELECT column1, column2 FROM table_name WHERE condition;(Selects specific columns based on a condition)SELECT COUNT(*) FROM table_name;(Counts the number of rows in a table)SELECT AVG(column_name) FROM table_name;(Calculates the average of a column)INSERT INTO table_name (column1, column2) VALUES (value1, value2);(Inserts a new row into a table)UPDATE table_name SET column1 = value1 WHERE condition;(Updates values in existing rows)DELETE FROM table_name WHERE condition;(Deletes rows based on a condition)JOINqueries (as detailed in the previous answer) are used extensively to combine data from multiple tables.
Beyond these basic queries, I frequently utilize subqueries, aggregate functions (SUM(), MAX(), MIN()), and window functions to perform more complex data manipulations and analysis. The specific queries become more sophisticated depending on the problem being solved – the need for more complex queries arises when dealing with large datasets and extracting nuanced insights.
Q 15. Describe your experience with ETL processes.
ETL, or Extract, Transform, Load, is the process of collecting data from various sources, cleaning and preparing it, and loading it into a target data warehouse or database. My experience spans several years and includes working with diverse data sources, from relational databases and flat files to APIs and cloud-based data stores.
For example, in a previous role, I worked on an ETL pipeline that extracted customer data from a legacy CRM system, transformed it to conform to a standardized data model, and loaded it into a Snowflake data warehouse. This involved handling data inconsistencies, cleansing dirty data (missing values, incorrect formats), and creating custom transformations using scripting languages like Python with libraries such as Pandas and SQLAlchemy.
Another project involved building an ETL pipeline using Apache Kafka and Spark for real-time data ingestion and processing of high-volume streaming data from various sensors. This highlighted the importance of robust error handling, performance optimization, and scalability in ETL processes.
- Data Extraction: Identifying and connecting to data sources, defining extraction criteria, and handling various data formats.
- Data Transformation: Cleaning and preparing data for loading, including data type conversions, data validation, deduplication, and data enrichment.
- Data Loading: Loading the transformed data into the target system efficiently and reliably, handling potential loading errors and ensuring data integrity.
Career Expert Tips:
- Ace those interviews! Prepare effectively by reviewing the Top 50 Most Common Interview Questions on ResumeGemini.
- Navigate your job search with confidence! Explore a wide range of Career Tips on ResumeGemini. Learn about common challenges and recommendations to overcome them.
- Craft the perfect resume! Master the Art of Resume Writing with ResumeGemini’s guide. Showcase your unique qualifications and achievements effectively.
- Don’t miss out on holiday savings! Build your dream resume with ResumeGemini’s ATS optimized templates.
Q 16. How do you handle outliers in a dataset?
Outliers are data points that significantly deviate from the rest of the data. Handling them is crucial as they can heavily influence statistical analyses and modeling. My approach is multifaceted and depends on the context and cause of the outlier.
- Identifying Outliers: I typically use visual methods like box plots and scatter plots, and statistical methods like the Z-score or Interquartile Range (IQR) to identify potential outliers.
- Investigating the Cause: It’s vital to understand *why* an outlier exists. Is it a data entry error, a measurement issue, or a genuine but rare event? If it’s an error, correction is the best approach. If it’s a genuine extreme value, removal might bias the results.
- Handling Outliers: Depending on the cause and impact, I might:
- Correct Errors: If an outlier is a clear error (e.g., a typo), I correct it if possible.
- Remove Outliers: If an outlier is genuinely extreme and substantially skews the results, and its cause can’t be identified or remedied, I might remove it, after careful consideration and documentation. This should only be done after thorough investigation.
- Transform Data: Techniques like log transformations can reduce the influence of outliers on the analysis.
- Use Robust Methods: Statistical methods less sensitive to outliers, such as median instead of mean, or robust regression techniques, are preferable in these situations.
- Winsorizing/Trimming: Replacing extreme values with less extreme values. For example, replacing the highest value with the 95th percentile value.
For example, in an analysis of customer purchase amounts, an outlier might represent a large corporate order that’s vastly different from individual purchases. Removing it might be justifiable if it skews the analysis of typical customer spending patterns, but would need careful documentation and justification.
Q 17. What are your preferred tools for data analysis?
My preferred tools depend on the task, but I’m highly proficient in a variety of software. For data manipulation and analysis, I rely heavily on Python with libraries like Pandas, NumPy, and Scikit-learn. Pandas offers excellent data wrangling capabilities, NumPy provides efficient numerical computations, and Scikit-learn is invaluable for machine learning tasks. For data visualization, I use Matplotlib, Seaborn, and Plotly, depending on the desired level of detail and interactivity. For larger datasets and distributed computing, I utilize Spark.
I’m also comfortable using SQL for database querying and management, and I have experience with business intelligence tools like Tableau and Power BI for creating interactive dashboards and reports. Finally, R is a solid tool for statistical analysis, though I typically find Python more versatile for my diverse tasks.
Q 18. How do you choose appropriate statistical tests?
Choosing the right statistical test depends critically on several factors: the type of data (categorical, continuous, etc.), the number of groups being compared, the research question, and the assumptions of the test. It’s not a matter of simply choosing a test; the process involves a careful consideration of these factors to ensure the validity and reliability of the conclusions.
I typically follow these steps:
- Define the Research Question: What are we trying to determine? Are we comparing means, proportions, or associations?
- Determine the Data Type: Is the data categorical (nominal or ordinal) or continuous (interval or ratio)?
- Consider the Number of Groups: Are we comparing two groups, more than two groups, or is it a correlation analysis?
- Check Assumptions: Many statistical tests have assumptions (e.g., normality, independence of observations). I carefully assess if these assumptions are met before applying the test. If assumptions are violated, I might consider transformations or non-parametric alternatives.
- Select the Appropriate Test: Based on the above considerations, I select the most appropriate statistical test. For example, a t-test might be suitable for comparing the means of two groups, while ANOVA could be used for comparing the means of three or more groups. Chi-squared tests are commonly used for categorical data. For correlations, Pearson’s correlation (for linear relationships between continuous variables) or Spearman’s rank correlation (for non-linear relationships or ordinal data) might be appropriate.
For example, if I’m comparing the average salaries of men and women in a company, I would likely use an independent samples t-test. If I’m comparing the effectiveness of three different marketing campaigns on sales, I would consider using ANOVA.
Q 19. Explain your experience with data warehousing.
Data warehousing involves the design, construction, and maintenance of a central repository of integrated data from various sources. My experience includes designing dimensional models using star schemas and snowflake schemas, optimizing query performance, and ensuring data consistency and accuracy. I’ve worked with both cloud-based data warehouses (e.g., Snowflake, Google BigQuery, Amazon Redshift) and on-premise solutions.
In a past project, I designed and implemented a data warehouse for a large retail company. This involved integrating data from transactional systems, CRM systems, and marketing platforms to provide a holistic view of customer behavior and sales performance. The project required careful planning and coordination to ensure data consistency, accuracy, and timeliness.
I have extensive experience with SQL, particularly in writing optimized queries for data retrieval and analysis from large datasets within a data warehouse environment. Additionally, I’ve used ETL tools to extract, transform, and load data into the warehouse, and worked with data modeling tools to create and maintain the warehouse schema.
Q 20. Describe your experience with big data technologies (e.g., Hadoop, Spark).
I have significant experience with big data technologies, primarily Hadoop and Spark. Hadoop provides a distributed storage and processing framework, ideal for handling massive datasets that exceed the capacity of a single machine. Spark, a faster and more versatile framework built on top of Hadoop, offers powerful capabilities for large-scale data processing, machine learning, and stream processing.
I’ve used Hadoop’s HDFS (Hadoop Distributed File System) for storing and managing petabytes of data and MapReduce for parallel processing of large datasets. With Spark, I’ve leveraged its resilient distributed datasets (RDDs) and various APIs (e.g., PySpark, Spark SQL) to perform complex data transformations, aggregations, and machine learning algorithms on massive datasets. This includes experience with Spark Streaming for real-time data processing.
For instance, in a previous project, I used Spark to analyze a large dataset of web server logs to identify patterns in user behavior and improve website performance. This involved using Spark SQL to query the data, perform data cleaning and transformation, and apply machine learning algorithms to predict future user behavior.
Q 21. How do you ensure data quality and integrity?
Data quality and integrity are paramount in any data-driven initiative. My approach is proactive, encompassing multiple stages of the data lifecycle.
- Data Profiling: I start with thorough data profiling to understand the characteristics of the data, including data types, distributions, missing values, and inconsistencies.
- Data Cleansing: This involves handling missing values (imputation or removal), correcting inconsistencies, and standardizing data formats. Techniques include outlier detection and treatment (as discussed earlier).
- Data Validation: Implementing data validation rules to ensure data accuracy and consistency during data entry and ETL processes. This can include range checks, data type checks, and referential integrity checks.
- Data Governance: Establishing clear data governance policies and procedures to ensure data quality throughout its lifecycle. This involves defining roles and responsibilities, implementing data quality metrics, and regularly monitoring data quality.
- Data Monitoring: Continuously monitoring data quality metrics to identify potential issues and proactively address them before they impact analysis or decision-making.
A crucial aspect is documentation. A well-defined data dictionary, detailing data definitions, formats, and validation rules, is essential for maintaining data quality and enabling others to understand the data.
Q 22. Explain your approach to data cleaning and preprocessing.
Data cleaning and preprocessing is crucial for ensuring the accuracy and reliability of any analysis. My approach is systematic and iterative, encompassing several key steps.
- Data Inspection: I begin by thoroughly examining the data, identifying its structure, variable types, and potential issues like missing values, outliers, and inconsistencies. This often involves using descriptive statistics and data visualization techniques.
- Handling Missing Values: Missing data can significantly bias results. My strategy depends on the nature and extent of the missingness. For example, I might use imputation techniques (like mean, median, or mode imputation for numerical data, or k-Nearest Neighbors for more sophisticated imputation) or remove rows/columns with excessive missing data if appropriate. The choice depends on the context and the potential impact on the analysis.
- Outlier Detection and Treatment: Outliers, or extreme values, can skew results. I employ methods like box plots, scatter plots, and z-score calculations to identify them. Treatment can involve removing outliers, transforming the data (e.g., using logarithmic transformation), or using robust statistical methods less sensitive to outliers.
- Data Transformation: This step involves converting data into a suitable format for analysis. This might include standardizing or normalizing numerical variables, converting categorical variables into numerical representations (one-hot encoding, label encoding), or creating new variables from existing ones (feature engineering).
- Data Consistency and Validation: I carefully check for inconsistencies in data formats, units, and coding schemes. Data validation ensures that the cleaned data adheres to defined rules and constraints. This might involve creating validation rules in a database or using programmatic checks.
For example, in a project analyzing customer churn, I discovered inconsistencies in the date format of customer acquisition. After standardizing the date format, I could accurately calculate the customer tenure and build a more robust churn prediction model.
Q 23. How do you communicate complex statistical findings to a non-technical audience?
Communicating complex statistical findings to a non-technical audience requires translating technical jargon into plain language and using visuals effectively. I employ several strategies:
- Storytelling: Framing the analysis as a narrative helps engage the audience. I begin by clearly stating the problem, then present the key findings and their implications in a compelling way.
- Visualizations: Charts and graphs are powerful tools for conveying information concisely. I choose the most appropriate visual (e.g., bar charts for comparisons, line charts for trends, scatter plots for correlations) and ensure they are clear, simple, and easy to understand.
- Analogies and Metaphors: Using relatable analogies helps simplify complex concepts. For example, I might explain the concept of statistical significance by comparing it to flipping a coin multiple times.
- Focus on Key Findings: I avoid overwhelming the audience with technical details. Instead, I focus on the most important findings and their practical implications.
- Interactive Dashboards: For more complex analyses, I might create interactive dashboards that allow the audience to explore the data and findings at their own pace.
For instance, when presenting findings from a market research study to executives, I avoided using terms like ‘p-value’ and instead focused on clear statements like, ‘There’s strong evidence suggesting that this marketing campaign increased sales by 15%’ supported by a visually appealing bar chart.
Q 24. What are some common challenges in data management?
Data management presents several challenges, some of the most common include:
- Data Quality Issues: Inconsistent data formats, missing values, outliers, and errors can hinder analysis and lead to inaccurate conclusions. This requires careful cleaning and preprocessing.
- Data Silos: Data often resides in separate systems and databases, making it difficult to integrate and analyze. Data integration strategies are crucial to overcome this.
- Data Volume and Velocity: The sheer volume and speed of data generation can overwhelm traditional data management systems. This necessitates using scalable and efficient solutions like cloud-based databases and big data technologies (Hadoop, Spark).
- Data Security and Privacy: Protecting sensitive data from unauthorized access and breaches is paramount. This involves implementing robust security measures, complying with regulations (like GDPR), and employing encryption techniques.
- Data Governance: Establishing clear policies, processes, and responsibilities for data management is essential for ensuring data quality, consistency, and compliance.
- Data Integration Complexity: Combining data from various sources with different structures and formats can be challenging and require substantial effort in data transformation and mapping.
For example, a company might struggle with data silos if sales data is stored separately from marketing data, making it difficult to analyze the effectiveness of marketing campaigns.
Q 25. How do you stay updated with the latest trends in data science?
Staying updated in data science is crucial for maintaining professional relevance. My approach is multifaceted:
- Online Courses and MOOCs: Platforms like Coursera, edX, and Udacity offer excellent courses on various data science topics, allowing for continuous learning and skill development.
- Conferences and Workshops: Attending industry conferences (like NeurIPS, ICML) and workshops provides opportunities to learn about cutting-edge research and network with experts.
- Research Papers and Publications: Reading research papers and publications helps me stay abreast of the latest advancements in algorithms, techniques, and tools.
- Online Communities and Forums: Engaging in online communities (like Stack Overflow, Kaggle) allows me to learn from peers and experts, solve problems collaboratively, and discover new tools.
- Industry Blogs and Newsletters: Following blogs and newsletters from reputable data science organizations and companies helps me stay updated on industry trends and best practices.
- Following Key Researchers and Influencers: Connecting with leading researchers and influencers on platforms like Twitter and LinkedIn provides insights into emerging trends and innovative solutions.
For example, recently I completed a course on deep learning on Coursera and applied some of the learned techniques to improve a recommendation system I was working on.
Q 26. Describe a project where you had to deal with a large dataset.
In a previous project, I worked with a large dataset containing millions of customer transactions from an e-commerce company. The goal was to develop a predictive model for customer lifetime value (CLTV).
The dataset presented several challenges, including its sheer size, high dimensionality, and the presence of missing values and outliers. To address these, I employed a combination of techniques:
- Data Sampling: Initially, I used stratified random sampling to create a smaller, manageable subset of the data for initial model development and testing.
- Feature Engineering: I created new features based on the existing variables to improve model performance. For example, I calculated features like average transaction value, purchase frequency, and recency.
- Dimensionality Reduction: Techniques like Principal Component Analysis (PCA) were used to reduce the number of variables while retaining most of the variance in the data.
- Model Selection: I compared several regression models (linear regression, gradient boosting machines) and selected the one that best predicted CLTV based on performance metrics (RMSE, R-squared).
- Model Deployment and Monitoring: After selecting the best model, I deployed it into a production environment and established a monitoring system to track its performance over time and make necessary adjustments.
The project successfully resulted in a model that accurately predicted customer lifetime value, enabling the company to better target marketing efforts and improve customer retention strategies.
Q 27. How do you ensure data security and privacy?
Data security and privacy are of paramount importance. My approach involves a multi-layered strategy:
- Access Control: Implementing strict access control measures, such as role-based access control (RBAC), limits access to sensitive data only to authorized personnel.
- Data Encryption: Encrypting data both at rest and in transit protects it from unauthorized access even if a breach occurs. This includes using strong encryption algorithms and key management systems.
- Data Anonymization and Pseudonymization: Techniques like data masking and pseudonymization can protect the identity of individuals while still allowing data analysis.
- Regular Security Audits and Penetration Testing: Conducting regular security audits and penetration testing helps identify vulnerabilities and improve the overall security posture.
- Compliance with Regulations: Adhering to relevant data privacy regulations, such as GDPR, CCPA, and HIPAA, is essential for ensuring legal compliance.
- Data Loss Prevention (DLP) Tools: Implementing DLP tools helps monitor and prevent sensitive data from leaving the organization’s control.
- Secure Data Storage: Employing secure storage solutions, such as cloud-based storage with encryption and access controls, protects data from unauthorized access or loss.
For example, in a healthcare project, I ensured strict adherence to HIPAA regulations, using de-identification techniques to protect patient privacy while analyzing medical records.
Q 28. What is your experience with different types of database management systems (DBMS)?
I have extensive experience working with various database management systems (DBMS), including:
- Relational Databases: MySQL, PostgreSQL, Oracle, SQL Server. I’m proficient in SQL for data querying, manipulation, and management within these systems. I understand database design principles (normalization, indexing) and have experience optimizing database performance.
- NoSQL Databases: MongoDB, Cassandra, Redis. I have experience with NoSQL databases for handling large volumes of unstructured or semi-structured data. I understand the trade-offs between relational and NoSQL databases and choose the appropriate system based on the project requirements.
- Cloud-based Databases: AWS RDS, Google Cloud SQL, Azure SQL Database. I have experience working with cloud-based databases, leveraging their scalability, elasticity, and managed services capabilities.
My experience spans designing database schemas, writing efficient queries, optimizing database performance, and managing database security.
For instance, in one project, I migrated a relational database from an on-premise server to a cloud-based solution, significantly improving scalability and reducing infrastructure costs.
Key Topics to Learn for Expertise in Data Management and Statistical Analysis Interview
- Data Wrangling and Cleaning: Understanding techniques for handling missing data, outliers, and inconsistencies. Practical application: Preparing real-world datasets for analysis, ensuring data quality and reliability.
- Descriptive Statistics: Mastering measures of central tendency, dispersion, and distribution. Practical application: Summarizing and interpreting key features of a dataset to inform further analysis.
- Inferential Statistics: Grasping concepts of hypothesis testing, confidence intervals, and p-values. Practical application: Drawing conclusions about a population based on sample data, making informed decisions.
- Regression Analysis: Understanding linear and multiple regression models, interpreting coefficients and assessing model fit. Practical application: Predicting outcomes based on predictor variables, identifying significant relationships.
- Data Visualization: Creating effective visualizations (charts, graphs) to communicate data insights clearly. Practical application: Presenting complex findings in an accessible and compelling manner.
- Database Management Systems (DBMS): Familiarity with SQL and relational databases. Practical application: Efficiently querying and manipulating large datasets, ensuring data integrity.
- Data Mining and Machine Learning Techniques (Introductory): Basic understanding of common algorithms and their applications. Practical application: Identifying patterns and trends within data to extract valuable insights.
- Ethical Considerations in Data Analysis: Understanding biases, responsible data handling, and the implications of data analysis. Practical application: Ensuring fairness, accuracy, and transparency in data-driven decisions.
Next Steps
Mastering Expertise in Data Management and Statistical Analysis is crucial for career advancement in today’s data-driven world. It opens doors to high-demand roles and allows you to contribute meaningfully to data-informed decision-making. To significantly boost your job prospects, focus on creating an ATS-friendly resume that highlights your skills and experience effectively. ResumeGemini is a trusted resource to help you build a professional and impactful resume. We provide examples of resumes tailored to Expertise in Data Management and Statistical Analysis to guide you. Invest time in crafting a strong resume – it’s your first impression on potential employers.
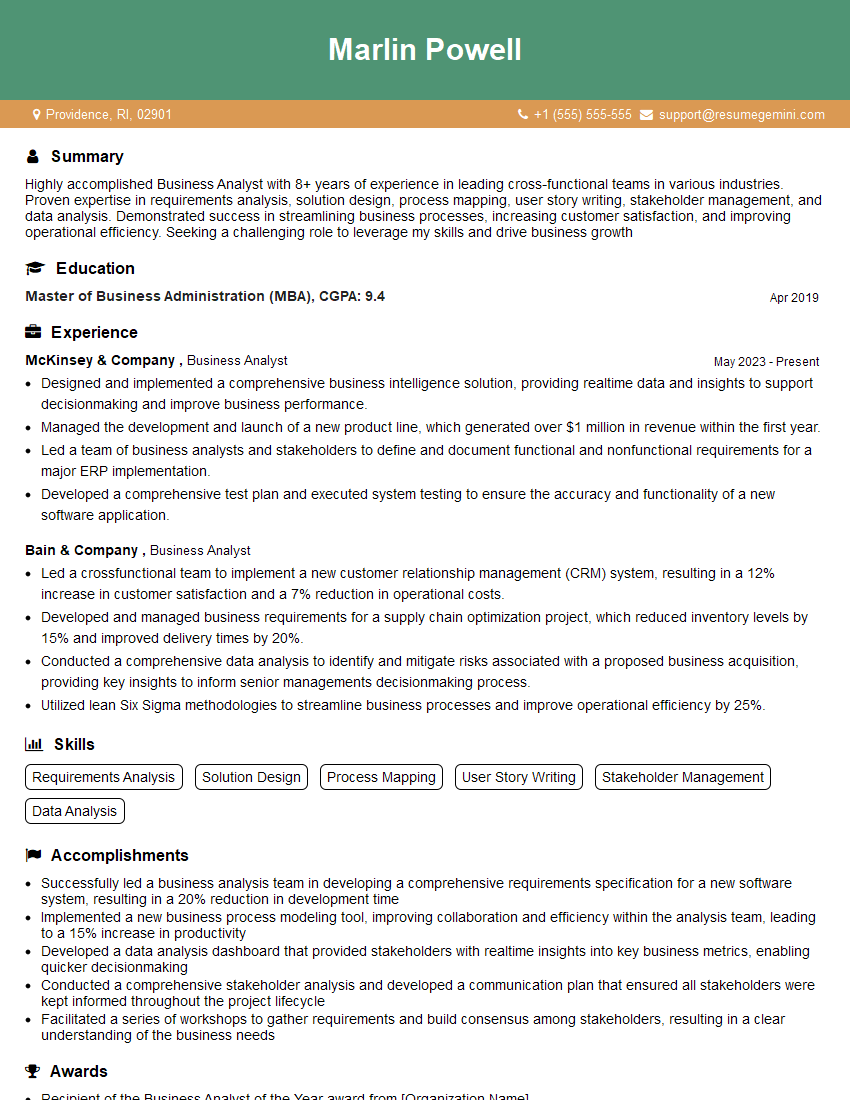
Business Analyst Resume Sample
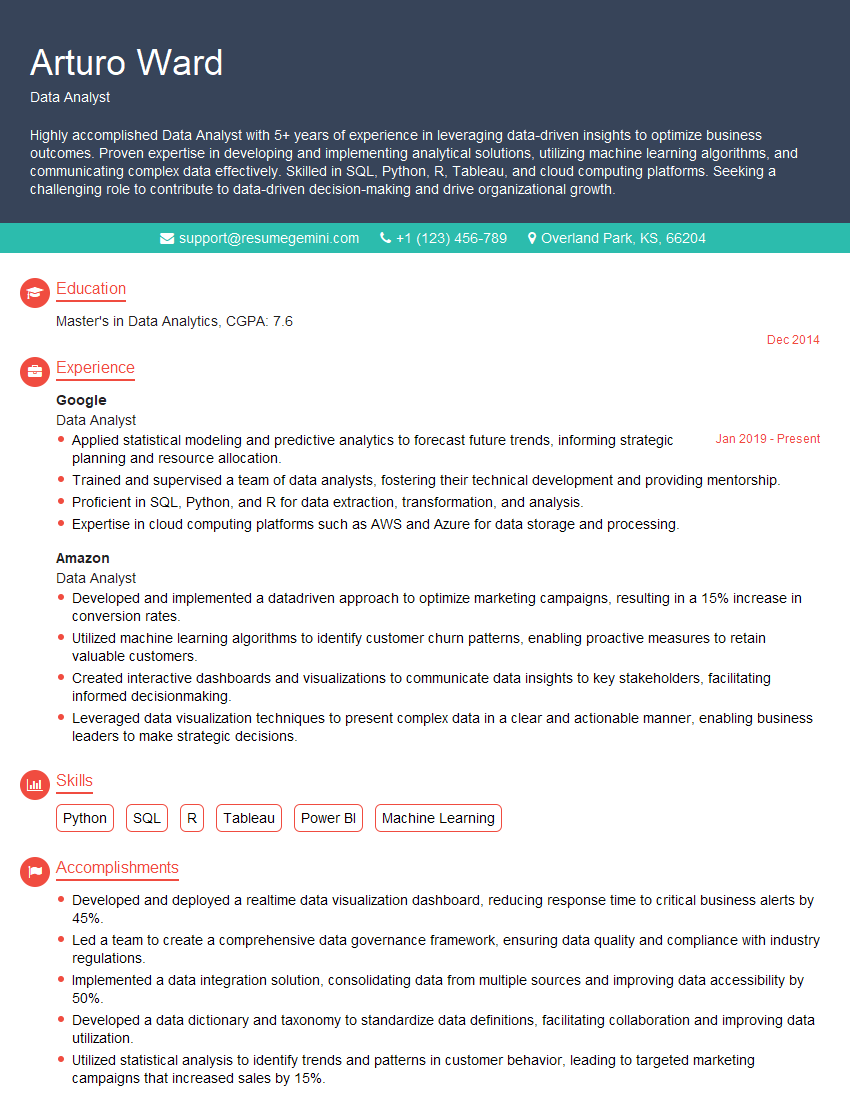
Data Analyst Resume Sample
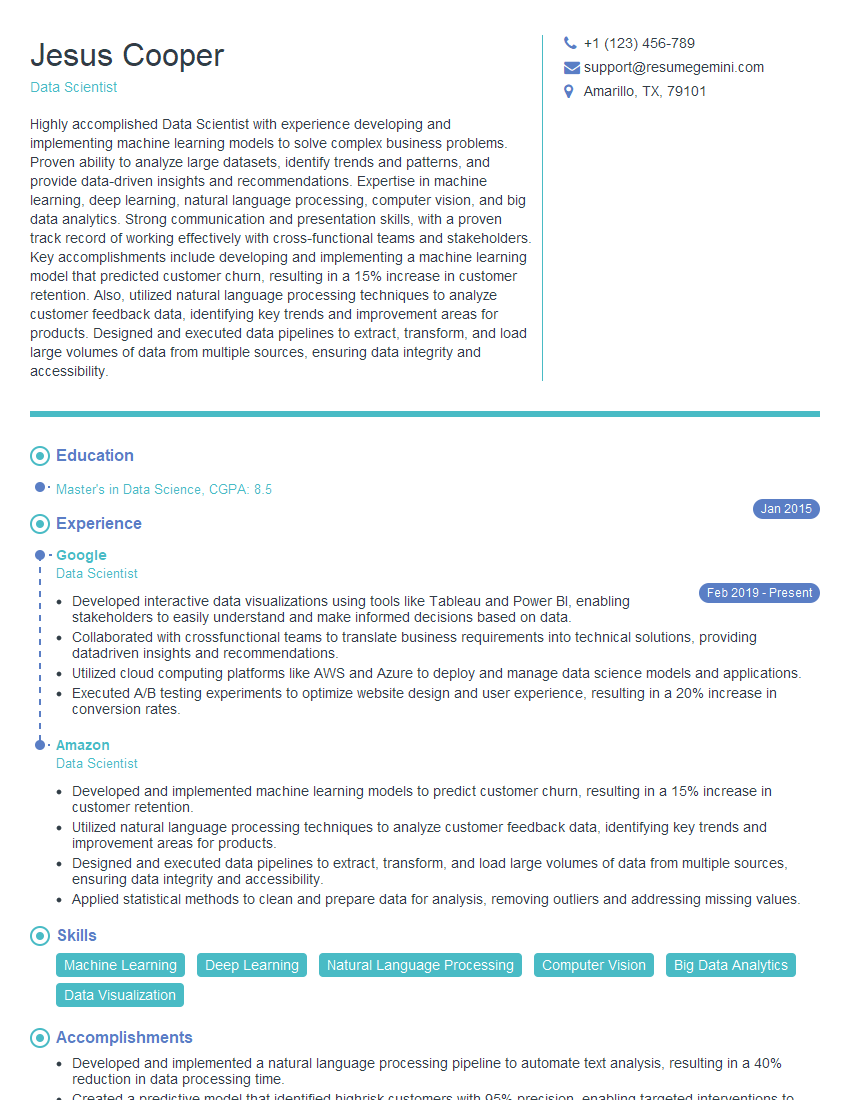
Data Scientist Resume Sample

Research Scientist Resume Sample
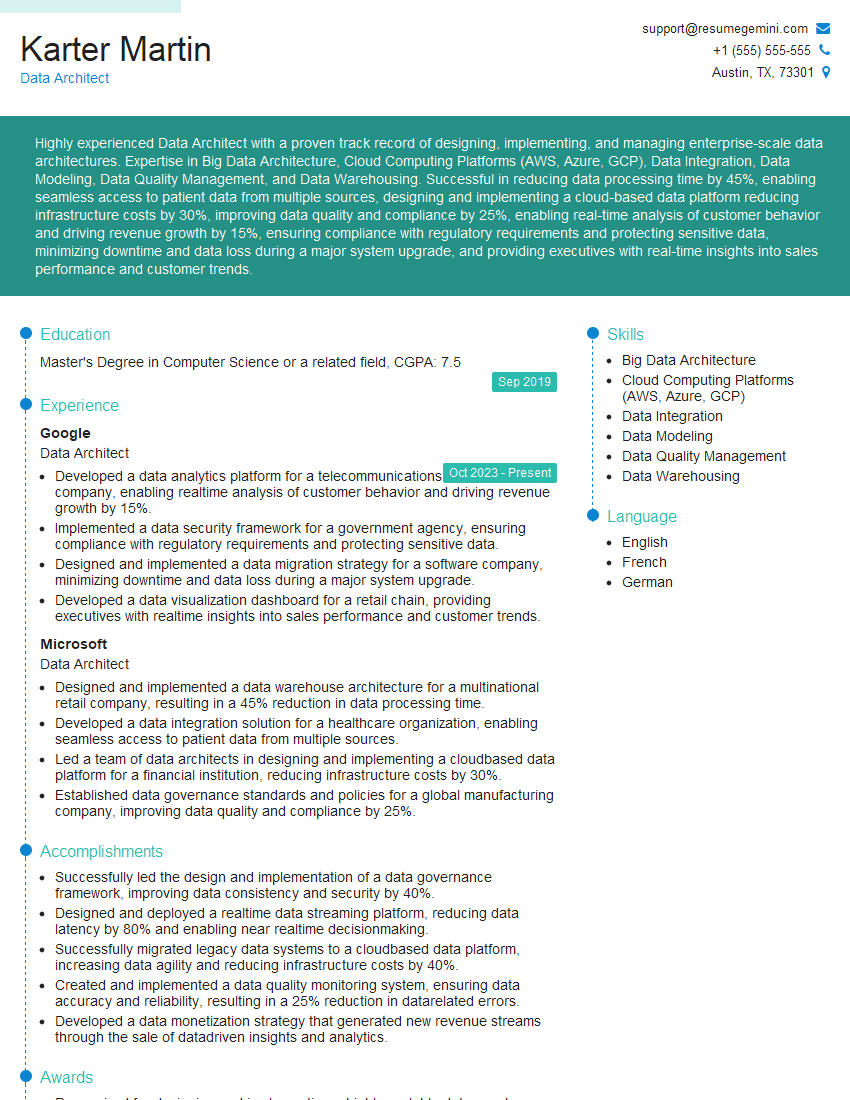
Data Architect Resume Sample
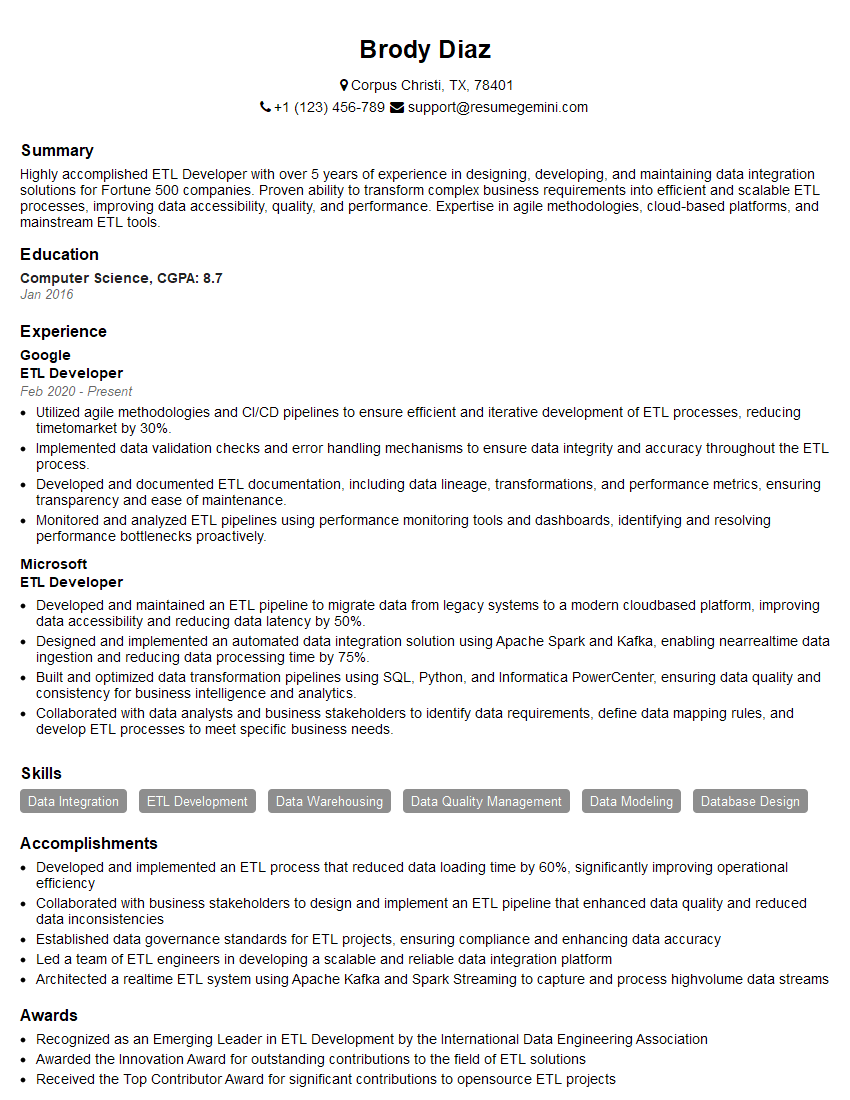
ETL Developer Resume Sample
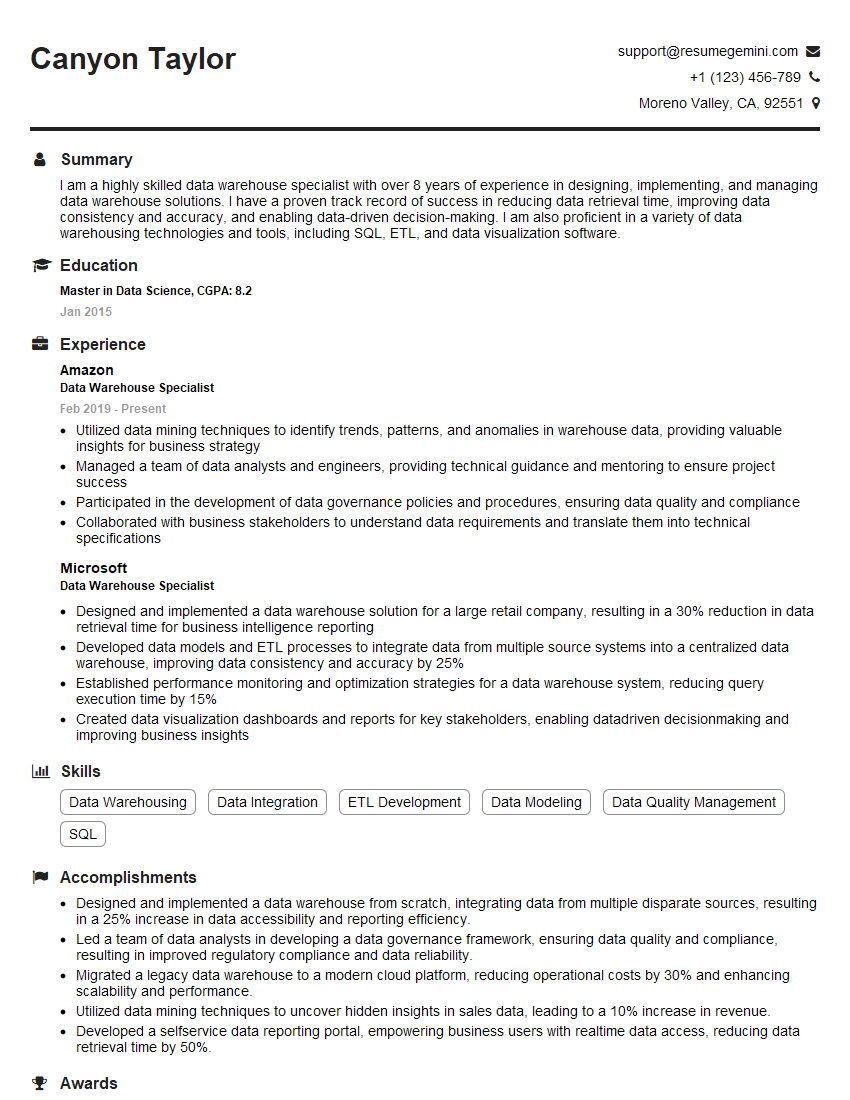
Data Warehouse Specialist Resume Sample
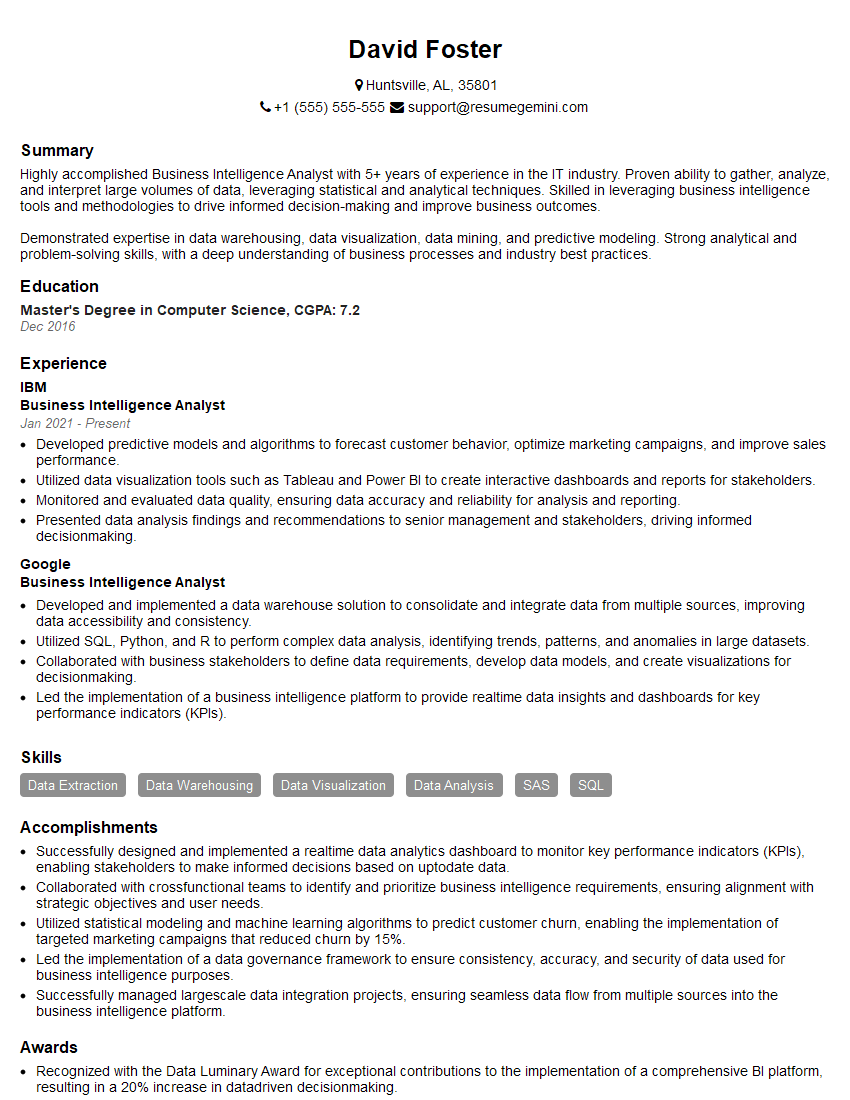
Business Intelligence Analyst Resume Sample
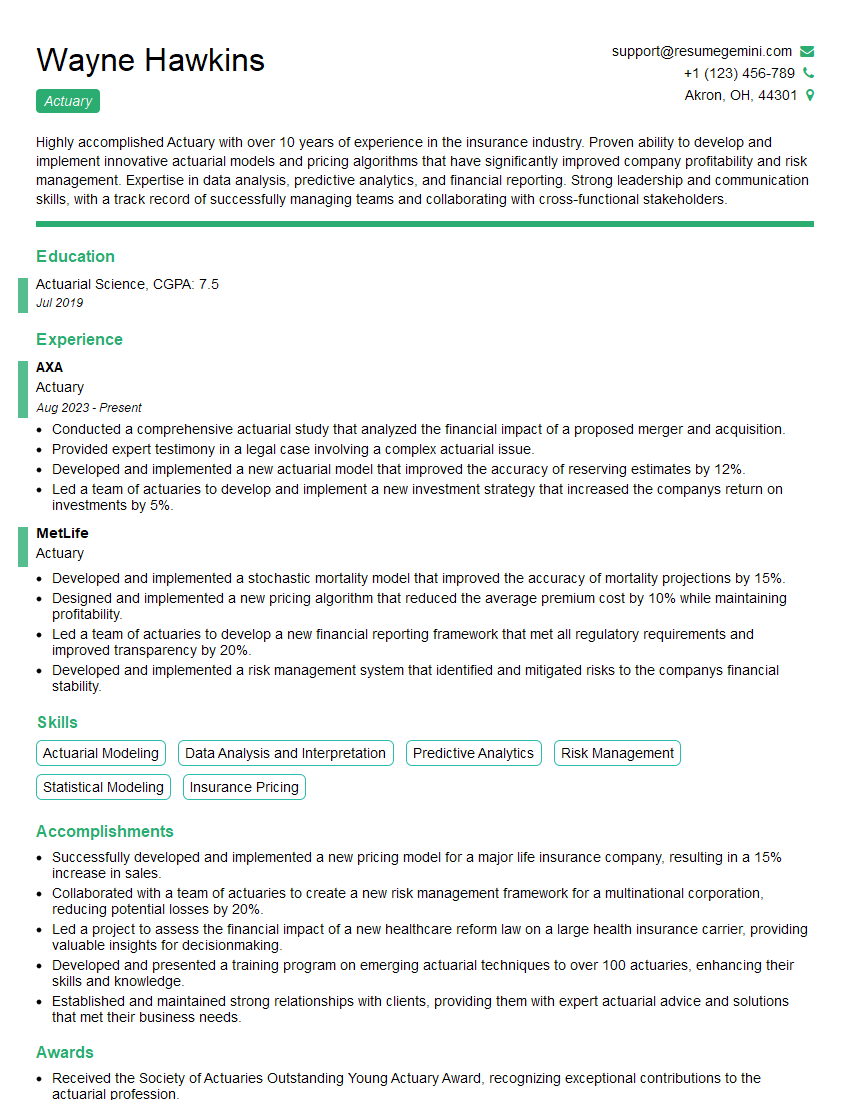
Actuary Resume Sample
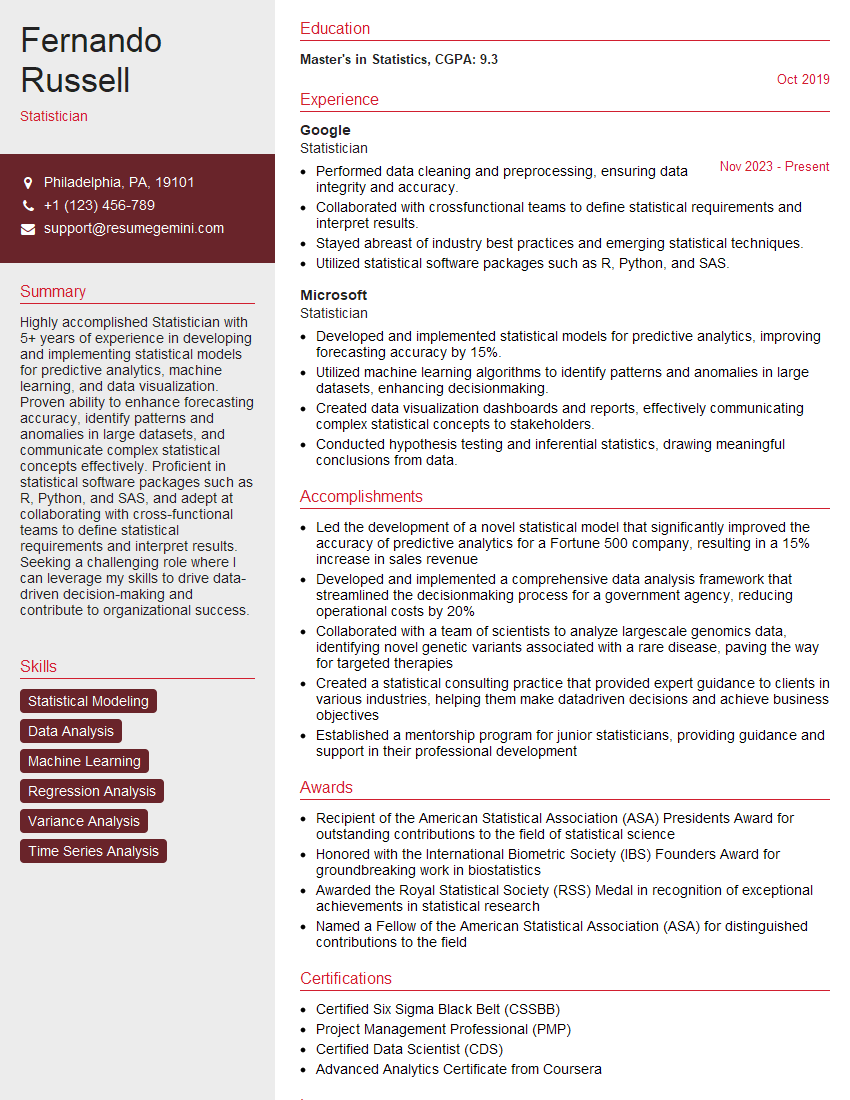
Statistician Resume Sample
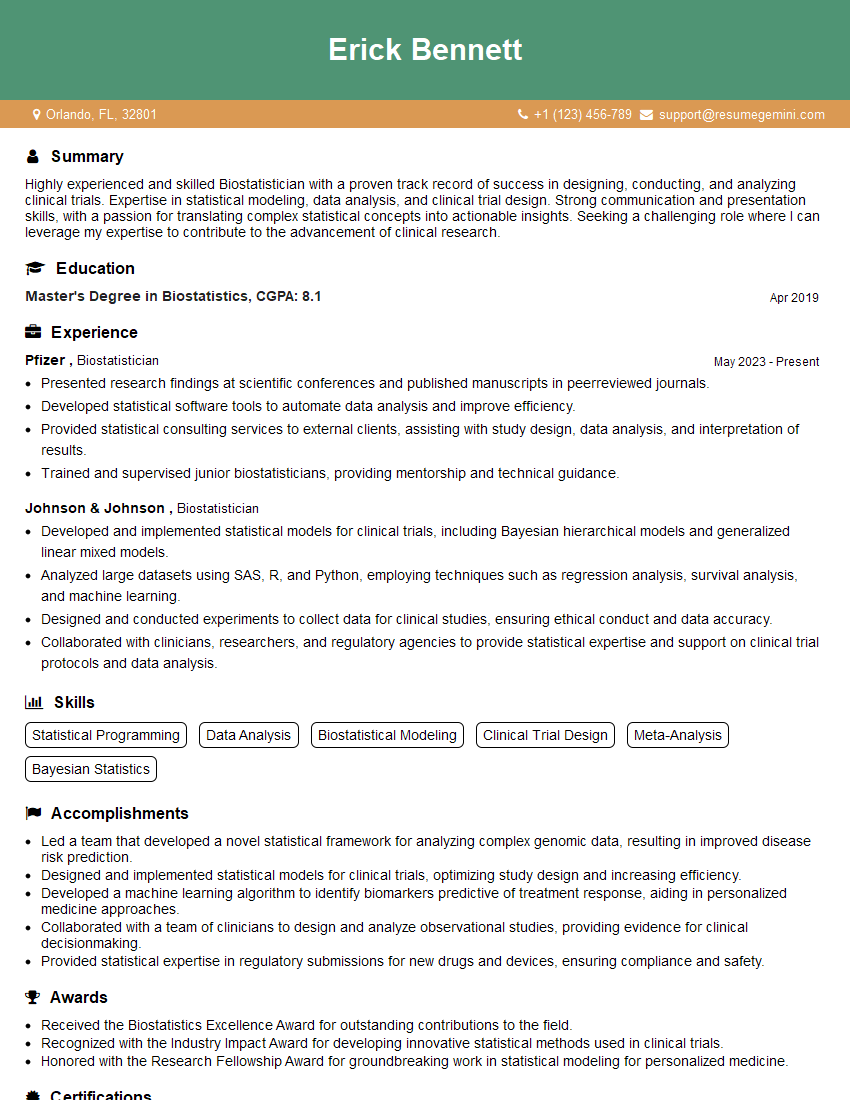
Biostatistician Resume Sample
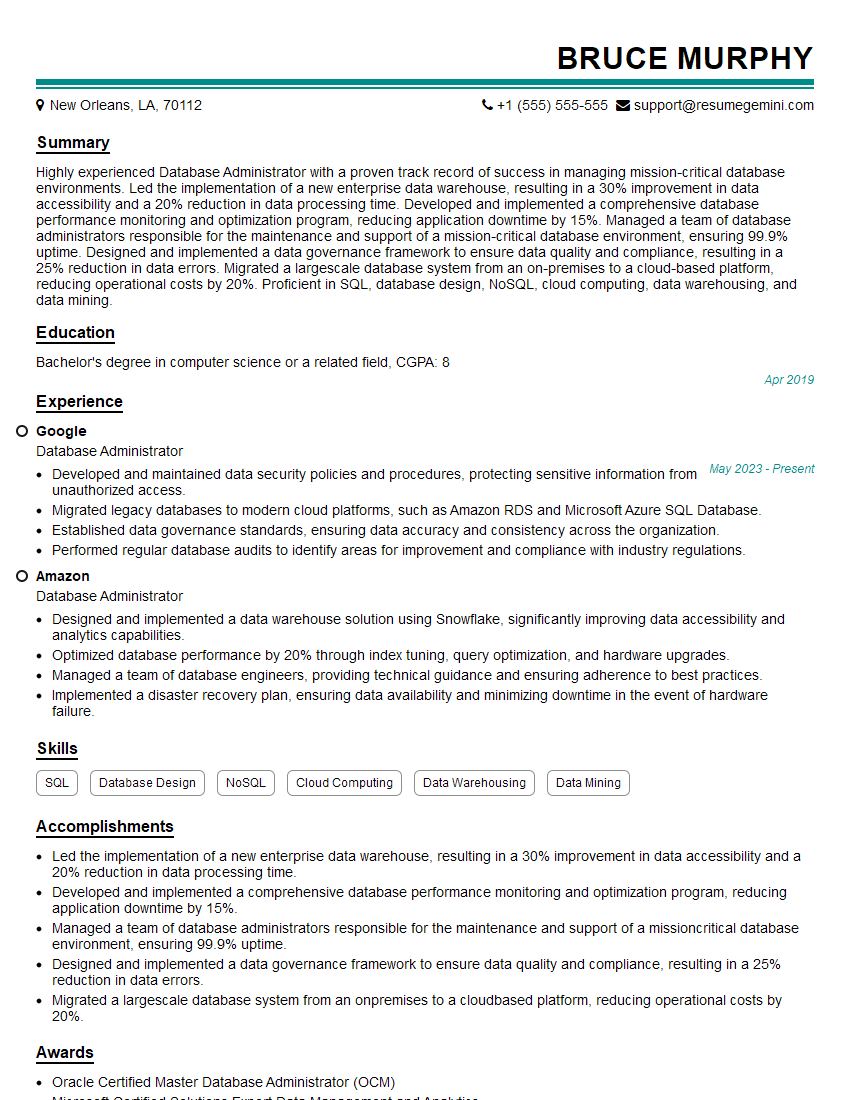
Database Administrator Resume Sample
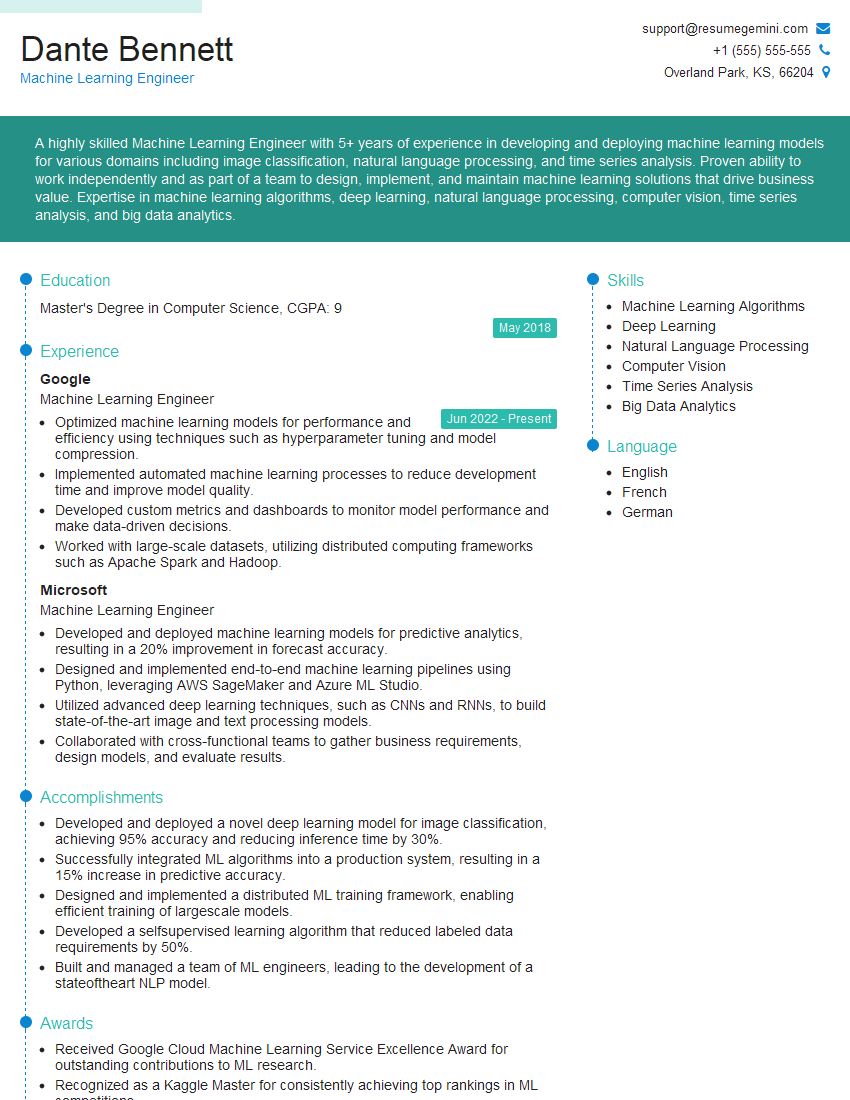
Machine Learning Engineer Resume Sample
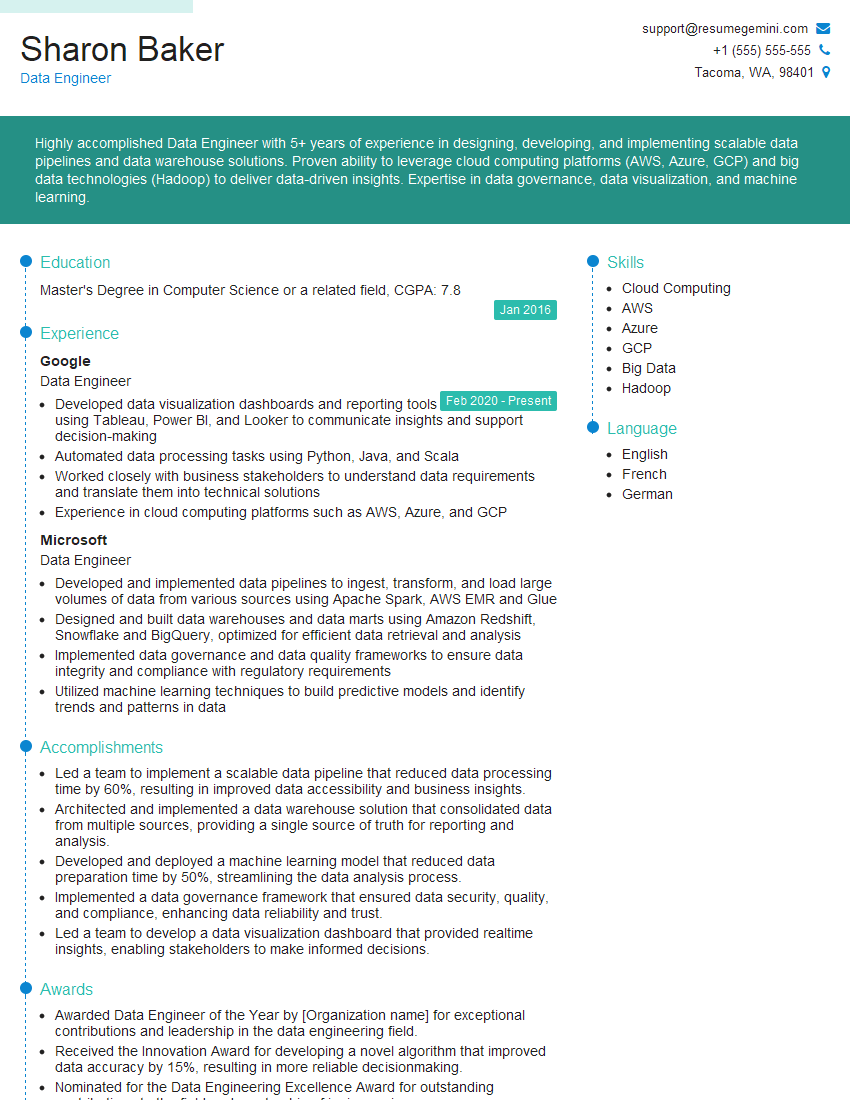
Data Engineer Resume Sample
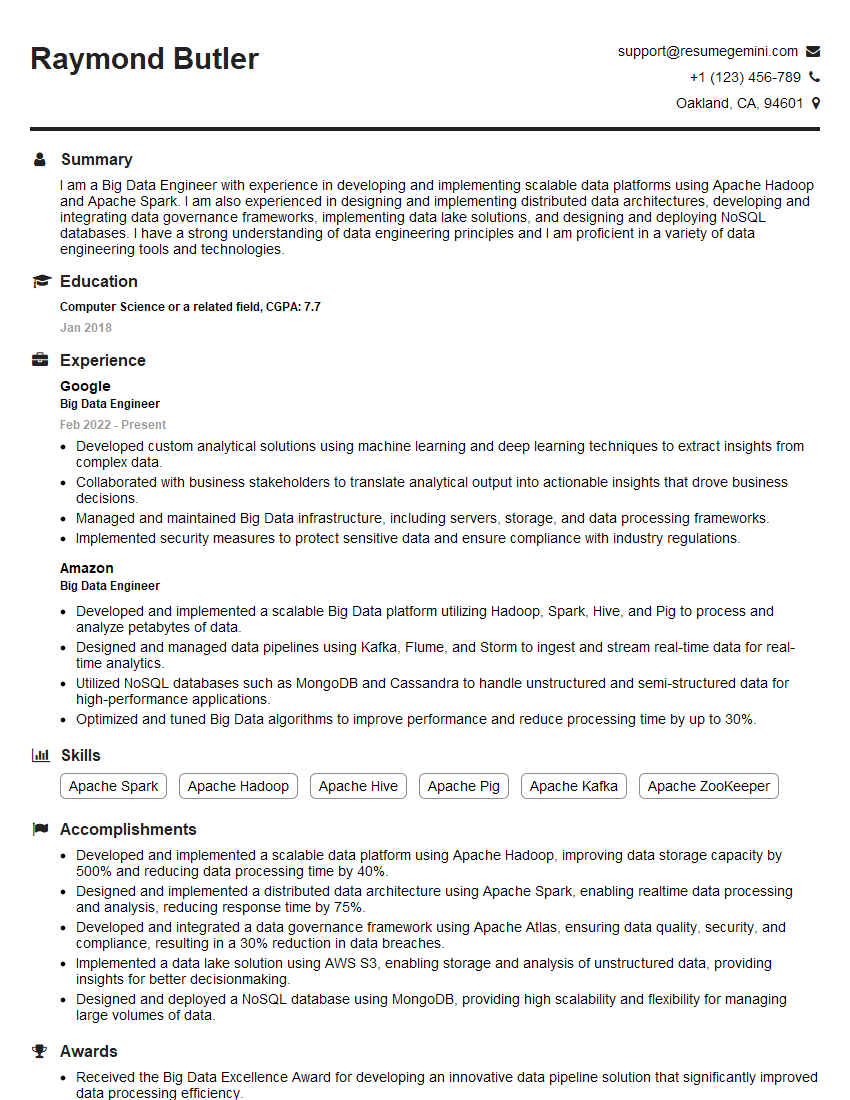
Big Data Engineer Resume Sample
Explore more articles
Users Rating of Our Blogs
Share Your Experience
We value your feedback! Please rate our content and share your thoughts (optional).
What Readers Say About Our Blog
To the interviewgemini.com Webmaster.
Very helpful and content specific questions to help prepare me for my interview!
Thank you
To the interviewgemini.com Webmaster.
This was kind of a unique content I found around the specialized skills. Very helpful questions and good detailed answers.
Very Helpful blog, thank you Interviewgemini team.