Feeling uncertain about what to expect in your upcoming interview? We’ve got you covered! This blog highlights the most important Mortality Analysis interview questions and provides actionable advice to help you stand out as the ideal candidate. Let’s pave the way for your success.
Questions Asked in Mortality Analysis Interview
Q 1. Explain the difference between period and cohort life tables.
Period and cohort life tables both describe mortality, but they do so from different perspectives. Think of it like taking snapshots versus following a group over time.
A period life table is a snapshot of mortality at a specific point in time. It uses the death rates observed during a particular year (or period) to project life expectancy and other mortality metrics for a hypothetical cohort. It shows what would happen to a group if the current death rates remained constant throughout their lives, which is often not realistic as mortality rates change over time. Imagine taking a picture of a group of people in 2024; the period life table describes their mortality based on 2024 rates.
A cohort life table follows a specific group of individuals (a cohort) from birth to death. It uses the actual death rates experienced by that cohort throughout their lifetimes. This provides a truer reflection of that cohort’s mortality experience, but it requires longitudinal data, meaning you need to track the same group of individuals for many years – often decades. Following the same group of people from birth to death would generate a cohort life table. This provides much more accurate mortality experience for the specific group.
The key difference lies in the time perspective: period tables show current mortality, while cohort tables trace mortality over an entire lifetime.
Q 2. Describe the Lee-Carter model and its applications in mortality forecasting.
The Lee-Carter model is a widely used stochastic model for forecasting mortality. It’s powerful because it captures the age-specific and time-specific changes in mortality rates in a relatively simple way. The model decomposes the logarithm of the mortality rate (often expressed as the central death rate, mx,t) into three components:
ax: An age-specific effect representing the baseline mortality at each agex.bx: An age-specific effect representing the sensitivity of mortality at agexto changes over time.kt: A time-specific effect representing the overall change in mortality from year to year. This is the ‘time index’ and is the key factor driving mortality changes.
The model can be expressed as: log(mx,t) = ax + bxkt + εx,t, where εx,t represents the error term.
Applications: The Lee-Carter model is extensively used in:
- Actuarial Science: Forecasting future mortality rates for life insurance pricing, pension valuation, and reserving.
- Public Health: Projecting future death rates and assessing the impact of public health interventions.
- Demographic Studies: Analyzing mortality trends and projecting population sizes.
Its simplicity and relative accuracy make it a valuable tool, although more complex models are emerging to address limitations, such as capturing period effects and allowing for greater flexibility in mortality patterns.
Q 3. What are some common causes of mortality data inaccuracies and how can they be addressed?
Mortality data inaccuracies stem from various sources, often leading to biased or unreliable analyses.
- Incomplete Data Reporting: Deaths might go unreported, especially in developing countries or for certain causes. This underestimates mortality.
- Coding Errors: Incorrect assignment of causes of death can lead to misclassifications, distorting trends and patterns. This happens frequently in the medical world.
- Data Gaps: Missing data for certain age groups or populations can bias the analysis. For example, it’s difficult to obtain data in active warzones.
- Measurement Error: Errors in age reporting, especially in settings with poor record-keeping, can lead to misrepresentation.
- Changes in Diagnostic Practices: Improvements in diagnosis can lead to a perceived increase in deaths from a particular disease, although this doesn’t represent an actual increase in mortality. It’s just better tracking.
Addressing these issues involves:
- Data Validation and Cleaning: Carefully reviewing the data for inconsistencies, errors, and missing values. Statistical methods can help identify outliers.
- Improved Data Collection Methods: Investing in better record-keeping systems and using advanced data collection techniques to ensure accuracy and completeness. Better healthcare records would solve a lot of this.
- Statistical Adjustment Techniques: Applying statistical methods to address missing data or correct for biases. Imputation methods can help, and regression modeling can be used.
- Cause-of-Death Validation: Cross-validation with death certificates, medical records, and other sources to ensure the accuracy of cause-of-death assignments.
Q 4. How do you assess the goodness-of-fit of a mortality model?
Assessing the goodness-of-fit of a mortality model is crucial to ensure its reliability. Several methods exist, each with its strengths and weaknesses.
- Visual Inspection: Plotting the observed and fitted mortality rates, to compare them visually. The model should fit the data well.
- Statistical Measures: Using metrics like the root mean squared error (RMSE), mean absolute error (MAE), or the chi-squared test to quantify the discrepancy between observed and fitted rates. Lower values indicate a better fit.
- Log-Likelihood: Used in maximum likelihood estimation. A higher log-likelihood suggests a better model fit. The higher, the better.
- Calibration Tests: Evaluating whether the model accurately predicts mortality rates across different ages and time periods. If it predicts across age-groups well, then the model is robust.
- Backtesting: Using the model to predict past mortality rates and comparing them to the actual data. The model’s predictions should be pretty close to reality.
A good fit doesn’t necessarily mean the model is good for forecasting. A model might fit historical data well but fail to predict future trends accurately. Thus, various measures need to be used together.
Q 5. Explain the concept of mortality improvement rates and their impact on life insurance pricing.
Mortality improvement rates reflect the year-on-year decrease in death rates. These rates are crucial in life insurance pricing because they directly impact life expectancy and, therefore, the cost of providing life insurance cover.
As mortality rates improve (decrease), life expectancy increases. This means that insurers are expected to pay out claims later than previously anticipated, or not at all. Conversely, if mortality rates worsen, life expectancy decreases and claims are expected earlier.
Impact on Life Insurance Pricing:
- Lower Premiums: Higher mortality improvement rates allow insurers to charge lower premiums because the risk of payout is reduced. More people live longer.
- Reserve Adjustments: Insurers need to adjust their reserves (funds set aside to cover future claims) based on anticipated mortality improvements. This is a delicate balancing act.
- Product Design: Mortality improvement rates influence the design of life insurance products, such as the length of coverage or the type of benefits offered. Longer term products are better.
Insurers use sophisticated models to project future mortality improvement rates and incorporate these projections into their pricing and reserving calculations. The accuracy of these projections is vital for their financial stability.
Q 6. Discuss different methods for smoothing mortality data.
Smoothing mortality data is essential to reduce the noise caused by random fluctuations and reveal underlying trends. Several methods exist:
- Moving Averages: Calculates the average mortality rate over a defined period (e.g., 5-year moving average). This smooths out short-term fluctuations.
- Generalized Additive Models (GAMs): Flexible models that allow for non-linear relationships between age and mortality. This is a powerful technique.
- Kernel Smoothing: A non-parametric method that assigns weights to nearby data points to create a smoothed estimate. This is very popular.
- Spline Smoothing: Uses piecewise polynomial functions to create a smooth curve that fits the data. Cubic splines are common. This is another very popular method.
- Local Regression (LOESS): A non-parametric method that fits a regression model to a localized subset of data to estimate the mortality rate at each age. This is quite robust.
The choice of smoothing method depends on the characteristics of the data and the desired level of smoothing. Excessive smoothing can obscure important details, while insufficient smoothing leaves noise. A balance needs to be found.
Q 7. What are some limitations of using deterministic mortality models?
Deterministic mortality models, unlike stochastic models, produce a single projection of future mortality rates. While simple and easy to use, they have limitations:
- Ignoring Uncertainty: They fail to capture the inherent uncertainty in future mortality. Death rates are not predictable, yet this is assumed.
- Sensitivity to Model Assumptions: The results are highly sensitive to the assumptions made about future mortality improvement rates, particularly for long-term projections. Assumptions drive outcomes.
- Limited Ability to Capture Shocks: Unexpected events such as pandemics or major shifts in lifestyle can significantly affect mortality, but deterministic models often cannot adequately represent these shocks. A pandemic would significantly change death rates, but a deterministic model wouldn’t reflect this well.
- Underestimation of Risk: By not accounting for uncertainty, these models can underestimate the potential risks associated with long-term liabilities, leading to under-reserving in fields like life insurance. This could cause a severe financial hit.
Stochastic models, which incorporate uncertainty, are generally preferred for long-term forecasting in many actuarial applications due to their increased robustness.
Q 8. Describe the impact of changing mortality rates on reserve calculations.
Mortality rates are fundamental to actuarial calculations, particularly in determining reserves for life insurance and pensions. Reserve calculations estimate the amount of money an insurer needs to set aside to cover future claims. If mortality rates increase unexpectedly (e.g., due to a pandemic or unforeseen health crisis), the insurer will need to pay out more claims than initially projected. This means the reserves calculated based on earlier, lower mortality rates will be insufficient, leading to potential financial strain. Conversely, if mortality rates decrease (e.g., due to advances in medical technology), the insurer will need less money in reserves. This is because fewer claims are anticipated than initially modeled. The impact is directly proportional to the change in mortality rates and the size of the insured population. A small change in mortality assumptions for a large book of business can result in significant changes in required reserves.
For example, imagine an insurance company uses a mortality table that underestimates mortality among the elderly. Their reserves will be too low, leaving them vulnerable to unexpected payouts when many policyholders reach an advanced age. Conversely, overestimating mortality could lead to unnecessarily high reserves, impacting profitability. Actuarial models continuously update mortality assumptions based on current data and projected trends to minimize these risks.
Q 9. How do you handle outliers in mortality data?
Outliers in mortality data represent unexpectedly high or low death rates within a specific group or period. These could be due to various factors: data entry errors, unusual events (natural disasters, epidemics), or simply random variation. Ignoring outliers can severely distort the analysis, leading to inaccurate mortality models and flawed reserve calculations. Handling outliers requires careful investigation rather than simply discarding them.
The first step is to identify potential outliers using statistical methods such as box plots or Z-score analysis. Once identified, we investigate the cause. Is it a genuine anomaly, or a data error? If a data error is found (e.g., a miscoded age or sex), the data is corrected. If the outlier is genuine, several approaches can be used, including:
- Winsorizing: Replacing extreme values with less extreme values – for example, replacing the highest value with the 95th percentile value.
- Trimming: Removing a small percentage of the most extreme values from both ends of the distribution.
- Robust methods: Utilizing statistical methods less sensitive to outliers, such as median-based calculations instead of mean-based ones.
- Modeling the outlier: If a cause for the outlier is identified (like a specific event), it may be possible to incorporate this into the model rather than removing the data.
The best approach depends on the context, the size and nature of the dataset, and the potential impact on the results. Documentation of the method employed to handle outliers is essential for transparency and reproducibility.
Q 10. Explain the concept of age-period-cohort effects in mortality analysis.
Age, period, and cohort effects represent different influences on mortality rates. Understanding these effects is crucial for accurate mortality forecasting. Let’s clarify each:
- Age effect: This reflects the natural aging process. Mortality rates generally increase with age. This is the most dominant and well-understood effect.
- Period effect: This captures changes in mortality rates across all ages at a specific point in time. These changes could be due to factors such as improvements in medical care, changes in lifestyle, or environmental influences. A period effect means that mortality rates change for every age group simultaneously in a specific time period.
- Cohort effect: This captures the effect of a specific generation’s shared experiences. A cohort is a group of individuals born around the same time. Differences in mortality between cohorts could be due to factors such as nutrition during childhood, exposure to specific diseases, or lifestyle patterns.
These three effects are intertwined and often difficult to separate. Statistical methods are employed to disentangle them, such as Lee-Carter models or age-period-cohort models. Failure to account for these effects leads to inaccurate mortality predictions and potentially flawed actuarial calculations. For instance, a model neglecting period effects (like a sudden improvement in healthcare) might underestimate future mortality.
Q 11. What are some key assumptions underlying mortality models?
Several key assumptions underlie mortality models. Failure to meet these assumptions can lead to inaccurate projections. Some of the most important assumptions include:
- Stationarity: The underlying pattern of mortality rates remains relatively stable over time. While this is rarely perfectly true, the assumption is often made for simplification.
- Independence: Mortality rates for different individuals are independent of each other (i.e., the death of one person doesn’t directly affect the mortality of another).
- Data accuracy: The mortality data used to build and calibrate the model is accurate and complete, free from significant bias or error.
- Model appropriateness: The chosen mortality model adequately captures the complexity and underlying trends in the data.
- Extrapolation limitations: Models are typically reliable for forecasting within a reasonable time horizon. Extrapolating far into the future can introduce significant uncertainty.
It is crucial to carefully consider these assumptions when selecting and applying a mortality model. Sensitivity analysis, which examines how changes in the assumptions affect the results, is a valuable tool for assessing the robustness of the model.
Q 12. Describe the difference between a parametric and non-parametric mortality model.
Parametric and non-parametric models differ in how they represent mortality rates:
- Parametric models: These models assume that mortality rates follow a specific mathematical function, such as the Gompertz, Makeham, or Weibull distribution. The model is characterized by a set of parameters which are estimated from the data. Advantages include simplicity and the ability to extrapolate beyond the observed data. However, this extrapolation is limited by the model’s assumptions, and if the underlying data does not fit the assumed distribution, the model will not be accurate.
- Non-parametric models: These models don’t assume any specific mathematical form for the mortality rates. Instead, they directly estimate mortality rates from the data using techniques such as life table calculations or smoothing methods. They are less prone to misspecification bias compared to parametric models, but they typically can’t extrapolate easily beyond the observed data range. The Lee-Carter model is a common example of a non-parametric approach.
The choice between parametric and non-parametric models depends on the characteristics of the data, the desired level of complexity, and the need for extrapolation. Sometimes, hybrid approaches combining aspects of both are used.
Q 13. How do you validate a mortality model?
Validating a mortality model is crucial to ensure its reliability and accuracy. This involves several steps:
- Goodness-of-fit tests: Assessing how well the model fits the historical data using statistical measures such as the chi-squared test or Kolmogorov-Smirnov test. These tests measure the difference between the observed and modeled mortality rates.
- Backtesting: Applying the model to a period not used for calibration (e.g., a previous time period) to see how accurately it predicts mortality. This tests the model’s out-of-sample predictive power.
- Sensitivity analysis: Examining how changes in the model’s parameters or underlying assumptions affect the projections. This helps to understand the uncertainty associated with the model’s outputs.
- Expert review: Having experienced actuaries review the model, its assumptions, and its results. Their experience is valuable in identifying potential biases or limitations.
- Comparison with other models: Comparing the results of the model with the results of other established mortality models. Significant discrepancies might warrant further investigation.
Validation is an iterative process. If a model fails to meet validation criteria, its assumptions may need to be revisited, or the model may need to be refined or replaced entirely. A well-validated mortality model provides confidence in the reliability of projections.
Q 14. What are some common software packages used for mortality analysis?
Several software packages are commonly used for mortality analysis. The choice often depends on the specific needs and preferences of the analyst, as well as the resources available. Some popular options include:
- R: A powerful statistical programming language with extensive packages for statistical modeling and data analysis, including dedicated packages for actuarial science and mortality analysis (e.g.,
actuar,MortalitySmooth). - Python: Another versatile programming language with libraries like
pandas,NumPy, andstatsmodels, offering functionalities for data manipulation, statistical analysis, and model fitting. - SAS: A comprehensive statistical software suite often used by large insurance companies. It has strong capabilities for data management, statistical modeling, and reporting.
- Actuarial software packages: Specialized actuarial software packages such as those offered by vendors like Moody’s Analytics, Milliman, or WTW are tailored to actuarial work, offering streamlined tools for mortality modeling, reserve calculations, and other actuarial tasks.
Choosing the right software involves considering factors such as the user’s programming skills, the complexity of the analysis, the size of the data, and the integration with other systems. Many actuaries use a combination of software packages to meet specific analytical needs.
Q 15. Explain the concept of force of mortality.
The force of mortality, also known as the hazard rate, represents the instantaneous risk of death at a specific age. Imagine you’re tracking a large group of individuals. The force of mortality at age 60, for example, describes the probability of someone from that group dying within the next infinitesimally small time interval, given they’ve already survived to age 60. It’s not a probability of dying *within a year*, but rather the *instantaneous risk* at that precise moment. Mathematically, it’s expressed as the derivative of the cumulative distribution function of death.
It’s crucial in actuarial science because it allows us to model the probability of survival over longer periods, unlike simple mortality rates which only look at deaths within a defined time frame. Think of it like this: if you know the speed of a car (analogous to force of mortality), you can calculate how far it will travel (survival probability) over a given time, even if you only know the speed at a specific instant.
Career Expert Tips:
- Ace those interviews! Prepare effectively by reviewing the Top 50 Most Common Interview Questions on ResumeGemini.
- Navigate your job search with confidence! Explore a wide range of Career Tips on ResumeGemini. Learn about common challenges and recommendations to overcome them.
- Craft the perfect resume! Master the Art of Resume Writing with ResumeGemini’s guide. Showcase your unique qualifications and achievements effectively.
- Don’t miss out on holiday savings! Build your dream resume with ResumeGemini’s ATS optimized templates.
Q 16. How do you incorporate mortality projections into financial modeling?
Mortality projections are fundamental to various financial models, particularly in areas like life insurance, pensions, and healthcare. We use them to estimate future liabilities and asset requirements. For instance, in life insurance, we need to project the number of future claims based on the expected lifespan of policyholders. This involves using mortality tables or models that predict death rates for different age groups and demographics.
The process generally involves:
- Selecting an appropriate mortality model: This could be a life table, a parametric model (like Gompertz-Makeham or Lee-Carter), or a more complex stochastic model.
- Calibrating the model: This involves fitting the chosen model to historical mortality data and adjusting parameters to reflect current trends.
- Projecting mortality rates: The calibrated model is used to project future mortality rates based on various scenarios (e.g., optimistic, pessimistic, most likely).
- Incorporating the projections into financial models: The projected mortality rates are then used to calculate future cash flows, reserves, and other financial metrics.
For example, in a pension plan, we’d use projected mortality rates to estimate the future payout amounts and to assess the plan’s funding status. The accuracy of these projections significantly impacts the financial soundness of the plan.
Q 17. What are some ethical considerations in using mortality data?
Ethical considerations in using mortality data are paramount. Privacy is a major concern; ensuring anonymity and responsible data handling are vital. We must be vigilant against potential biases in data collection or analysis that could lead to unfair or discriminatory outcomes. For example, using data that only represents certain demographics might lead to misrepresentation and inaccurate projections for other groups.
Another crucial aspect is transparency and proper interpretation. Mortality data shouldn’t be used to promote harmful stereotypes or justify discriminatory practices. The results of mortality analyses need to be presented accurately and without misleading interpretations. Using mortality data to justify denying healthcare or insurance to specific groups is unethical.
Finally, we must be mindful of the potential for misuse of the information. The data should be handled and interpreted responsibly to avoid creating unfair advantages or disadvantages for individuals or groups.
Q 18. Explain the impact of selection bias on mortality studies.
Selection bias significantly impacts the validity of mortality studies. This occurs when the sample used in the study isn’t representative of the population it aims to represent. For instance, if a study on the mortality of smokers relies solely on data from participants in a smoking cessation program, the results might show a lower mortality rate than the true rate for the entire smoker population, as participants in the program might be healthier or more motivated to quit than the general smoking population. This introduces a bias that makes the results misleading.
Several types of selection bias can occur:
- Healthy worker effect: Employed individuals tend to be healthier than the general population, leading to underestimation of mortality in occupational studies.
- Length-time bias: Slow-progressing diseases might be overrepresented in studies due to their longer duration, potentially skewing mortality estimates.
Addressing selection bias requires careful study design, including the use of appropriate sampling techniques and rigorous data quality checks. Statistical methods such as propensity score matching can also be employed to minimize the impact of observed selection bias.
Q 19. Discuss the challenges of forecasting mortality in the long term.
Long-term mortality forecasting is inherently challenging due to the many unpredictable factors that can influence mortality trends. These include unforeseen medical breakthroughs, emerging diseases, changes in lifestyle patterns, and climate change. Even seemingly small changes in underlying mortality trends can have significant effects over extended periods.
Challenges include:
- Unpredictable events: Pandemics, major wars, or unforeseen environmental catastrophes can drastically alter mortality patterns.
- Changes in healthcare: Advances in medical technology and treatments constantly shift mortality rates, making it difficult to accurately predict their long-term impact.
- Demographic shifts: Changing birth rates, migration patterns, and aging populations affect the overall mortality profile of a population.
- Model limitations: Existing mortality models might not adequately capture all the complex interactions and non-linear relationships influencing mortality.
To address these challenges, sophisticated statistical models that incorporate various influencing factors are crucial. Scenario planning and sensitivity analyses are also important to assess the impact of uncertainty on projections. Continuous monitoring and recalibration of the models based on new data are equally necessary for minimizing long-term forecasting errors.
Q 20. How do you handle missing data in mortality analysis?
Missing data is a common problem in mortality analysis. Ignoring missing data can lead to biased and inaccurate results. There are several strategies to handle it:
- Deletion: This involves removing individuals with incomplete data. This approach is only suitable when data is missing completely at random (MCAR) and the amount of missing data is small, otherwise it can lead to significant bias.
- Imputation: This involves replacing missing values with estimated values. Common methods include mean imputation, regression imputation, and multiple imputation. Multiple imputation is generally preferred as it accounts for the uncertainty associated with imputation.
- Model-based approaches: Some statistical models, such as those using survival analysis techniques, are robust to missing data. These models can be used directly even when data is incomplete.
The choice of method depends on the nature of the missing data, the amount of missing data, and the characteristics of the data set. Careful consideration of the potential impact of missing data on the results is essential, and it’s usually best to document the methods employed and discuss the limitations they might introduce.
Q 21. Describe the difference between absolute and relative mortality rates.
Absolute mortality rates represent the number of deaths within a specific population during a particular period. For example, 100 deaths per 100,000 people in a city during a year. It provides a raw count of deaths.
Relative mortality rates, on the other hand, express mortality as a ratio or proportion relative to a reference point. Common examples are mortality rates standardized to a particular population (standardized mortality ratio or SMR) or relative mortality rates comparing two groups (e.g., comparing mortality in smokers versus non-smokers). These rates often involve adjusting for confounding variables such as age or sex.
Consider a situation where we want to compare mortality in two cities. The absolute mortality rate might be higher in City A simply because it has a larger population than City B. Relative mortality rates, after adjusting for population size, would provide a more meaningful comparison of mortality risk in the two cities.
Q 22. Explain the concept of mortality risk and how it’s used in pricing.
Mortality risk represents the probability of death within a specific timeframe. In pricing, particularly in insurance and annuities, it’s crucial because it directly impacts the expected payouts. Actuaries use mortality tables and models to estimate this risk. For example, a life insurance company uses mortality risk to determine the premium for a life insurance policy. A higher mortality risk for a given age and health profile leads to a higher premium because the insurer expects to pay out more claims. The pricing process involves carefully considering factors such as age, sex, health status, occupation, and lifestyle to refine the mortality risk assessment. A simpler example would be comparing premiums for life insurance policies for a 30 year old and a 70 year old; the older person, with a higher mortality risk, will pay substantially more.
This risk is quantified using various statistical methods such as calculating the probability of death within a given period based on historical data, and applying appropriate mortality models to account for changing mortality rates. Then, this probability is incorporated into complex financial models to determine fair and profitable premiums.
Q 23. What are some recent trends in mortality improvement?
Recent trends in mortality improvement show a complex picture. While overall mortality rates continue to decline globally, the rate of improvement is slowing in many developed countries. We’re seeing a divergence between mortality trends across different socioeconomic groups and geographic locations. For instance, improvements are less pronounced among lower socioeconomic groups, often attributed to disparities in access to healthcare and lifestyle factors. Furthermore, the impact of the COVID-19 pandemic has led to both increased mortality in the short-term and potential longer-term consequences on life expectancy estimates, particularly among certain age groups.
Another significant trend is the increasing prevalence of chronic diseases, which are impacting mortality patterns. While improvements in treating acute illnesses are continuing, dealing with the long-term effects of chronic conditions, like diabetes and heart disease, presents significant challenges to further improvements in mortality rates. Finally, advancements in medical technology and treatments have undoubtedly contributed to mortality improvements, but their benefits aren’t uniformly distributed across the population.
Q 24. Describe how you would use mortality analysis to inform investment decisions.
Mortality analysis plays a significant role in investment decisions, especially in sectors highly sensitive to population demographics. For example, in the healthcare industry, analyzing future mortality trends helps predict the demand for healthcare services, informing decisions on hospital expansions, investment in specific medical technologies, or the development of new pharmaceuticals tailored to an aging population. Similarly, in the long-term care sector, understanding mortality trends can guide investments in retirement homes and assisted living facilities.
Another application is in the financial sector. Pension funds and annuity providers rely heavily on accurate mortality projections to manage their liabilities and investment strategies. Underestimating mortality improvement can lead to significant underfunding, while overestimating it can lead to unnecessarily conservative investment strategies, which is equally harmful. Therefore, sophisticated mortality models are used to project future mortality rates, and these projections inform asset allocation decisions.
Fundamentally, any investment strategy with a long-term horizon needs to factor in mortality trends. Ignoring demographic changes and associated mortality patterns represents a significant source of risk for those long-term investments. An investor should therefore build robust models incorporating various mortality scenarios to understand and manage risk.
Q 25. What are some limitations of using mortality data from specific populations?
Using mortality data from specific populations carries several limitations. The most significant limitation is the potential for selection bias. If the studied population doesn’t represent the broader population of interest, extrapolating findings can lead to inaccurate conclusions. For example, mortality data from a wealthy, healthy population may not accurately reflect the mortality experience of the general population.
Another limitation is generalizability. Results from one population may not apply to others due to variations in lifestyle, genetics, access to healthcare, and environmental factors. A study conducted on a specific ethnic group might not be generalizable to other ethnic groups, or to different countries with varying healthcare systems. Furthermore, data quality and completeness are crucial considerations. Inaccurate or incomplete data can lead to flawed conclusions, and it’s essential to thoroughly validate and understand the quality of mortality data used in any analysis. Finally, data must account for various confounding factors: for example, comparing death rates without adjusting for factors like smoking or level of physical activity could lead to erroneous conclusions.
Q 26. Discuss the role of mortality analysis in public health policy.
Mortality analysis is fundamental to public health policy. It helps policymakers understand the burden of disease and identify areas requiring intervention. Analyzing mortality data by cause of death allows for the prioritization of public health initiatives, such as funding research into specific diseases, implementing targeted health promotion campaigns, or improving access to healthcare services. For instance, a rise in mortality related to a particular disease can trigger the development of strategies to tackle that disease effectively.
It also informs resource allocation. By understanding mortality trends, governments can allocate resources effectively to prevention, treatment, and management of specific diseases. Mortality analysis also contributes to health impact assessments of policies, providing evidence to evaluate the effectiveness of various public health programs and interventions. Evaluating the impact of a public health campaign on mortality rates is crucial in determining whether such campaigns should be continued or revised.
Ultimately, the analysis enables the ongoing monitoring and evaluation of the health of a population, providing data that help inform crucial decisions which have direct impact on the health of a nation.
Q 27. Explain how you would communicate complex mortality data to a non-technical audience.
Communicating complex mortality data to a non-technical audience requires clear and simple language, avoiding jargon. Visualizations are crucial; graphs and charts like age-standardized mortality rates or life expectancy charts are far more accessible than tables of raw data. Focus on key findings and present them in a concise and engaging manner. For instance, instead of stating “Age-standardized mortality rate for cardiovascular disease increased by 2.5%,” one could communicate the message as: “More people are dying from heart disease.”
Use relatable analogies or real-world examples. For instance, relating mortality rates to familiar events like car accidents can help people understand scale and relative risk. It’s important to address potential misunderstandings or misconceptions upfront and frame the information in a way that aligns with the audience’s existing knowledge and concerns. Stories of individuals who have faced the effects of these mortality rates can help make this otherwise distant data relatable.
Finally, a clear summary of the key message is absolutely essential. This makes it simple for the audience to understand the importance and implications of the data presented. Repeat the key takeaway at the end to solidify understanding.
Q 28. How do you stay updated on the latest advancements in mortality analysis?
Staying updated in mortality analysis requires a multi-faceted approach. I regularly read peer-reviewed journals specializing in demography, epidemiology, and actuarial science. Publications from organizations like the Human Mortality Database and national statistical offices provide valuable data and analysis. Attending conferences and workshops in these fields is crucial for networking and learning about the latest research.
I also actively participate in professional organizations like the Society of Actuaries (SOA) or the International Association of Actuaries (IAA). These organizations offer continuing education opportunities, publications, and access to experts in the field. Monitoring online resources, such as pre-print servers and the websites of leading research institutions, allows me to track emerging trends and methodological advancements. Continuous learning is essential in this constantly evolving field, requiring an ongoing commitment to staying abreast of the latest developments.
Key Topics to Learn for Mortality Analysis Interview
- Life Table Construction and Analysis: Understanding the principles behind life tables, including their construction from mortality data and their application in calculating life expectancies and other actuarial measures.
- Mortality Models: Familiarize yourself with various mortality models (e.g., Gompertz, Makeham, Lee-Carter) and their application in forecasting future mortality rates. Understand their strengths, weaknesses, and appropriate usage scenarios.
- Data Analysis and Statistical Techniques: Develop proficiency in analyzing mortality data using statistical software (e.g., R, SAS, Python). Master techniques like regression analysis, time series analysis, and survival analysis to extract meaningful insights.
- Cause-Specific Mortality: Learn to analyze mortality data by cause of death, identifying trends and contributing factors. This often involves working with complex datasets and applying appropriate statistical methods.
- Mortality Improvement and Projections: Understand the factors influencing mortality improvement and the methods used to project future mortality rates. This includes understanding the implications for actuarial calculations and financial planning.
- Applications in Insurance and Finance: Explore how mortality analysis is applied in pricing insurance products (life insurance, annuities), reserving, and other financial applications. Understanding the practical implications of your analytical work is crucial.
- Cohort Effects and Period Effects: Understand the difference between these effects on mortality and how to account for them when analyzing data. This is a critical aspect of robust mortality modeling.
Next Steps
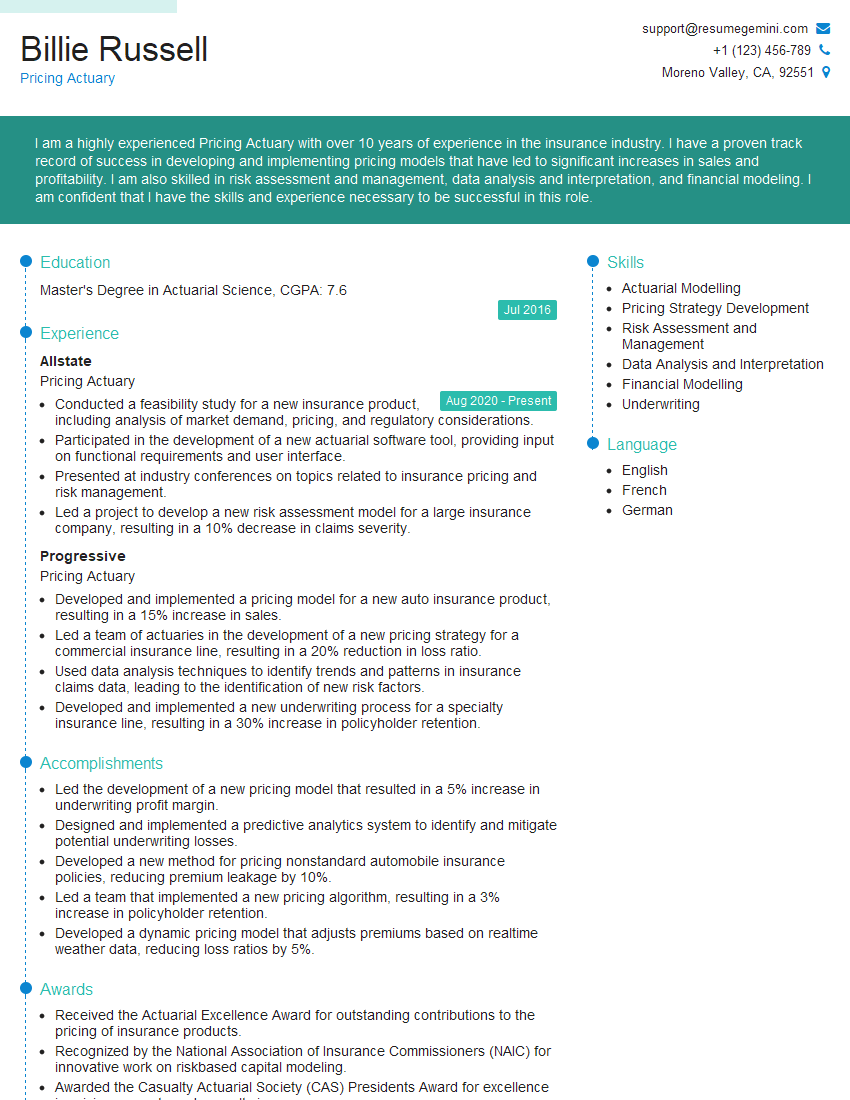
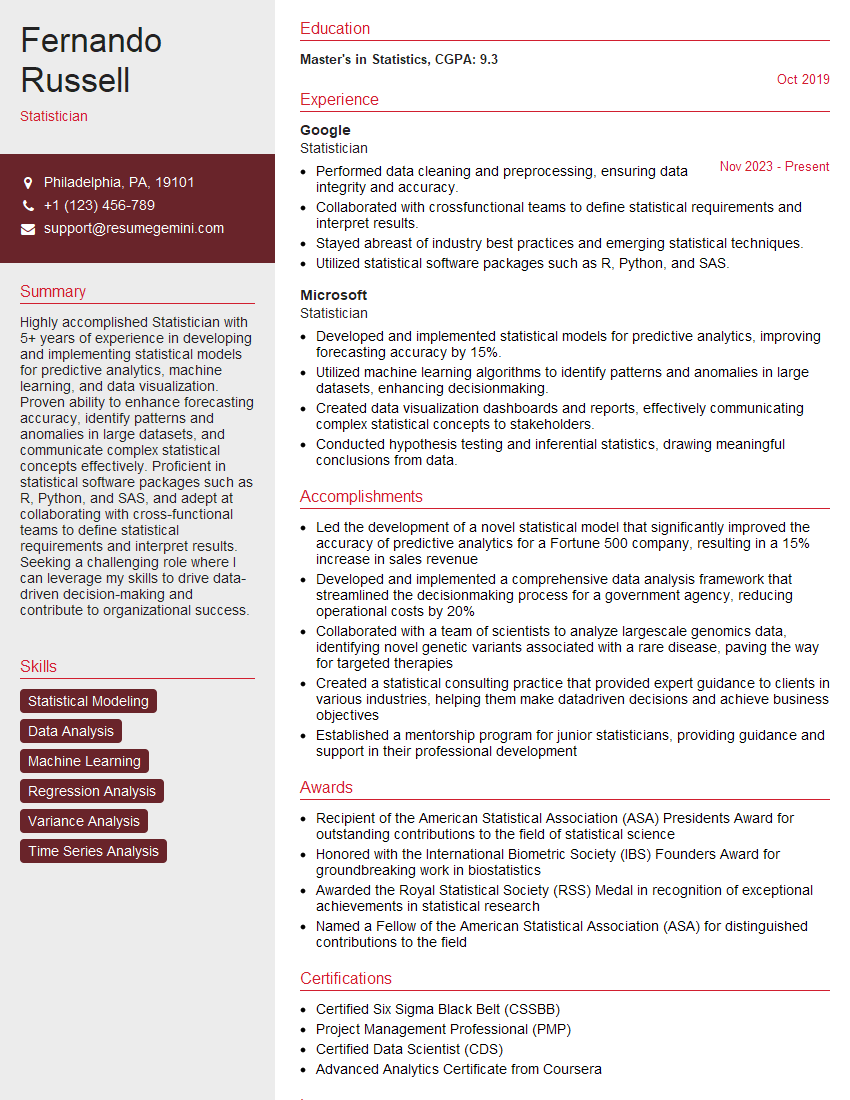
Mastering mortality analysis opens doors to exciting career opportunities in actuarial science, insurance, and related fields. A strong understanding of these concepts is highly valued by employers and significantly enhances your career prospects. To increase your chances of landing your dream role, it’s crucial to present your skills effectively. Creating an ATS-friendly resume is paramount in today’s competitive job market. We encourage you to leverage ResumeGemini, a trusted resource, to build a professional and impactful resume that highlights your expertise in mortality analysis. Examples of resumes tailored to this field are available to guide you.


Explore more articles
Users Rating of Our Blogs
Share Your Experience
We value your feedback! Please rate our content and share your thoughts (optional).
What Readers Say About Our Blog
To the interviewgemini.com Webmaster.
Very helpful and content specific questions to help prepare me for my interview!
Thank you
To the interviewgemini.com Webmaster.
This was kind of a unique content I found around the specialized skills. Very helpful questions and good detailed answers.
Very Helpful blog, thank you Interviewgemini team.