Are you ready to stand out in your next interview? Understanding and preparing for Transit Fare and Revenue Analysis interview questions is a game-changer. In this blog, we’ve compiled key questions and expert advice to help you showcase your skills with confidence and precision. Let’s get started on your journey to acing the interview.
Questions Asked in Transit Fare and Revenue Analysis Interview
Q 1. Explain the different fare collection methods used in public transportation.
Public transportation utilizes various fare collection methods, each with its own strengths and weaknesses. The choice often depends on factors like ridership volume, technology infrastructure, and budget constraints.
- Cash: A traditional method, still prevalent in some systems, but prone to errors in counting and theft. It requires significant staffing for handling and counting.
- Magnetic Strip Tickets/Cards: Older technology where information is stored on a magnetic strip. These are relatively inexpensive but easily damaged and susceptible to fraud.
- Smart Cards: These contactless cards store fare information electronically, offering flexibility in fare structures and easier integration with automated systems. Examples include Oyster cards (London) and CharlieCards (Boston). They are more durable and allow for stored value and capped fares.
- Mobile Ticketing: Passengers purchase and display tickets on their smartphones via dedicated apps. This offers convenience and reduces the need for physical tickets but relies on reliable mobile network coverage and smartphone penetration.
- Contactless Payment Systems: Using credit/debit cards and mobile payment systems (Apple Pay, Google Pay) for payment. This offers convenience and ease of use for both passengers and transit agencies. It requires investment in NFC readers.
- Automated Fare Collection (AFC) Systems: These encompass a network of machines (e.g., ticket vending machines, validators) integrated with fare payment methods. They automate fare collection, reducing manual labor and errors. They can include both contactless and smartcard systems.
Often, a hybrid approach incorporating multiple methods is used to cater to diverse passenger needs and technological capabilities.
Q 2. Describe the key performance indicators (KPIs) used to evaluate fare revenue performance.
Key Performance Indicators (KPIs) for evaluating fare revenue performance provide crucial insights into the financial health and operational efficiency of a transit system. These KPIs allow for targeted improvements and strategic decision-making.
- Total Fare Revenue: The overall amount of money collected from fares. This is the most basic KPI.
- Farebox Recovery Ratio (FRR): The percentage of operating costs covered by fare revenue (
FRR = Total Fare Revenue / Operating Costs). A higher FRR indicates better financial sustainability. - Average Fare Per Ride: Provides insight into passenger spending habits and the effectiveness of fare structures. Changes in this can reveal trends.
- Revenue per Passenger Mile/Kilometer: This considers both revenue and the distance traveled, giving a more comprehensive view of revenue performance.
- Fare Evasion Rate: The percentage of passengers who travel without paying. High rates signify revenue loss and potential operational issues.
- Transaction Costs per Ride: The expense associated with processing each fare transaction. Lower costs improve efficiency.
- Customer Satisfaction with Fare Payment Systems: Feedback surveys can measure user experience and identify areas for improvement in fare collection systems.
Analyzing these KPIs in combination helps provide a holistic picture of fare revenue performance.
Q 3. How would you analyze ridership data to identify trends and patterns affecting revenue?
Analyzing ridership data to identify trends and patterns affecting revenue requires a multifaceted approach. It’s not simply about looking at total ridership, but also examining its composition and changes over time.
- Time Series Analysis: Examine ridership data over time to identify seasonal variations (e.g., higher ridership during peak hours or specific days of the week), trends (e.g., increasing or decreasing ridership over months or years), and cyclical patterns. Tools like ARIMA models can be employed for forecasting.
- Segmentation: Analyze ridership by various demographics (age, income, location), trip purpose (commuting, leisure), and time of day. This reveals which segments contribute most to revenue and how their behavior affects it.
- Correlation Analysis: Investigate correlations between ridership and external factors like economic conditions, fuel prices, special events, and changes in service frequency or route offerings.
- Geographic Analysis: Map ridership density to identify high-performing and underperforming areas. This can reveal potential opportunities for service improvements or targeted marketing campaigns.
By combining these analytical techniques, we can identify factors that drive or hinder ridership and use this information to develop effective revenue management strategies.
Q 4. What are some common challenges in transit fare revenue management?
Transit fare revenue management faces numerous challenges in today’s complex environment.
- Fare Evasion: A significant source of revenue loss, requiring robust enforcement strategies and potentially technological solutions. It can vary based on the fare system and public awareness.
- Fluctuating Ridership: Changes in economic conditions, fuel prices, and transportation alternatives affect ridership and consequently revenue. Robust forecasting becomes critical here.
- Technological Dependence: Systems rely on complex technology, which can experience malfunctions, requiring backup plans and costly maintenance.
- Data Management and Analysis: Effectively managing and analyzing large datasets from various sources (fare machines, mobile ticketing, etc.) is essential but can be a significant hurdle.
- Balancing Affordability and Revenue: Setting appropriate fares is a delicate balance between making transit affordable for all users and generating sufficient revenue to operate and maintain the system.
- Competition from Other Modes: Ride-sharing services and other transportation alternatives compete for passengers, putting pressure on transit agencies to enhance service and pricing.
Addressing these challenges requires a combination of technological investments, strong operational management, and insightful data analysis.
Q 5. How do you forecast future fare revenue?
Forecasting future fare revenue requires a blend of statistical modeling and qualitative insights. It’s crucial to account for both predictable and unpredictable factors.
- Time Series Forecasting: Utilize historical ridership and revenue data to predict future trends using models like ARIMA or exponential smoothing. This provides a baseline forecast.
- Regression Analysis: Identify factors that influence fare revenue (e.g., economic growth, population changes, service improvements) and develop a regression model to forecast revenue based on anticipated changes in these factors.
- Scenario Planning: Develop multiple scenarios (optimistic, pessimistic, most likely) to account for uncertainties and potential disruptions (e.g., economic downturn, major service changes).
- Qualitative Insights: Integrate expert opinions, market research, and passenger feedback to incorporate non-quantifiable factors that may impact fare revenue.
- Simulation Modeling: For more complex scenarios, simulation models can be used to assess the impact of changes in fare structures, service levels, or marketing campaigns on overall revenue.
The accuracy of fare revenue forecasts depends on the quality and reliability of the data and the sophistication of the forecasting models employed.
Q 6. Explain the concept of fare elasticity and its impact on revenue.
Fare elasticity measures the responsiveness of demand to changes in fares. It’s expressed as the percentage change in ridership divided by the percentage change in fares. Understanding this is crucial for revenue management.
- Price Inelastic Demand: If the absolute value of fare elasticity is less than 1, demand is inelastic. This means that a fare increase will lead to a proportionally smaller decrease in ridership, resulting in increased revenue. For example, essential commuting trips often exhibit inelastic demand.
- Price Elastic Demand: If the absolute value of fare elasticity is greater than 1, demand is elastic. A fare increase will lead to a proportionally larger decrease in ridership, potentially resulting in decreased revenue. Non-essential trips might be more price-elastic.
- Unit Elastic Demand: If the absolute value of elasticity is equal to 1, a fare change results in a proportional change in ridership, leaving revenue unchanged.
By analyzing fare elasticity, transit agencies can make informed decisions about fare adjustments, balancing revenue goals with the need to maintain ridership. For instance, a high fare elasticity suggests caution when considering a fare increase.
Q 7. Describe your experience with fare evasion analysis and mitigation strategies.
Fare evasion analysis and mitigation are crucial for maximizing revenue and ensuring the financial sustainability of public transportation. My experience involves a multi-pronged approach.
- Data Analysis: Analyzing fare collection data to identify patterns and hotspots of fare evasion. This includes examining passenger flows, comparing revenue data with ridership estimates, and identifying areas with consistently low revenue relative to usage.
- Surveillance and Enforcement: Implementing strategies to deter fare evasion through increased patrols, random inspections, and the use of surveillance technologies (CCTV, fare gate sensors).
- Technology Upgrades: Investing in advanced fare collection systems (e.g., contactless payment systems, enhanced fare gates) to reduce evasion opportunities. This often involves improvements in technology and integration with different payment methods.
- Public Awareness Campaigns: Educating passengers about the importance of fare payment and the consequences of evasion through public awareness campaigns. This may also involve education about using the fare payment systems.
- Fare Structure Optimization: Reviewing fare structures to identify potential loopholes that could be exploited and creating a fairer system that incentivizes fare payment.
- Collaboration with Law Enforcement: Working with law enforcement agencies to address more serious cases of fare evasion.
A successful strategy combines preventative measures with enforcement to minimize evasion and maximize revenue recovery. The approach should be balanced and consider the need to maintain a positive relationship with passengers.
Q 8. How do you handle discrepancies between expected and actual fare revenue?
Discrepancies between expected and actual fare revenue are a common challenge in transit operations. Addressing them requires a systematic approach focusing on identifying the root cause. This involves a detailed investigation across multiple areas.
Data Validation: The first step is to meticulously verify the accuracy of both expected and actual revenue figures. This includes checking for data entry errors, system glitches, and ensuring proper reconciliation of various revenue streams (e.g., ticket sales, mobile payments, passes).
Operational Review: Next, we analyze operational factors. Are there delays or service disruptions that could have impacted ridership and therefore revenue? Are there issues with fare collection equipment (e.g., malfunctioning ticket vending machines)? A thorough review of operational logs and reports is crucial.
Revenue Leakage Analysis: A significant portion of discrepancies might stem from revenue leakage – fare evasion, ticketing errors, or fraud. This calls for analyzing ridership data against revenue collected to identify potential anomalies. Employing techniques like fare inspection data and comparing it to automated fare collection system (AFCS) data can reveal patterns of evasion.
External Factors: External factors such as changes in weather patterns, special events, or economic conditions can also affect ridership and, consequently, revenue. Accounting for these factors is essential during analysis.
Financial Reconciliation: Finally, a comprehensive financial reconciliation ensures accurate accounting of all revenue and expenses. This might involve cross-checking data with accounting software and identifying any inconsistencies.
For example, a significant drop in revenue might be attributed to a new competitor’s emergence, necessitating a re-evaluation of pricing strategies. Conversely, unexpected revenue increases could indicate successful marketing campaigns or changes in ridership habits that need further investigation.
Q 9. What software or tools have you used for transit fare data analysis?
Throughout my career, I’ve utilized a range of software and tools for transit fare data analysis. My experience includes working with both proprietary systems and open-source tools.
Proprietary Transit Management Systems (TMS): These comprehensive systems, such as those offered by companies specializing in transit solutions, often include built-in analytics dashboards and reporting modules. These allow for in-depth analysis of fare revenue, ridership, and operational performance. Examples include features for generating custom reports, visualizing data trends, and integrating with other data sources.
Business Intelligence (BI) Tools: Tools like Tableau and Power BI have been invaluable for visualizing complex fare data. They allow me to create interactive dashboards that effectively communicate key performance indicators (KPIs) to stakeholders and decision-makers. These tools support data manipulation, trend analysis, and predictive modeling, allowing us to visualize fare revenue and its correlation to various factors.
Statistical Software Packages: For more advanced statistical analysis, I’ve used packages like R and SPSS. These tools are essential for sophisticated modeling, regression analysis, and hypothesis testing to understand the correlation between fare changes and ridership, for instance. For example, conducting a regression analysis to determine the elasticity of demand regarding fare adjustments.
Spreadsheets (Excel, Google Sheets): Even basic spreadsheets remain important for data cleaning, preliminary analysis, and creating simple reports. Their ease of use makes them useful for quick analyses and presentations.
The choice of software depends heavily on the scale and complexity of the data, the required level of analysis, and budget constraints.
Q 10. How would you design a fare system for a new transit line?
Designing a fare system for a new transit line requires a multi-faceted approach. The goal is to create a system that is both financially viable and equitable, encouraging ridership while maximizing revenue.
Market Research: In-depth market research is crucial. This involves understanding the demographics of potential riders, their travel patterns, and their willingness to pay. Surveys, focus groups, and analysis of competing transit services are important aspects of this phase.
Cost Analysis: A thorough cost analysis is paramount. This includes estimating operating costs, capital expenses, and potential revenue streams. This informs the design of a fare structure that is both sustainable and affordable.
Fare Structure Design: The actual fare structure needs to be carefully designed. Common structures include flat fares, distance-based fares, zone-based fares, and time-based fares. Each option has its own advantages and disadvantages, and the choice depends on the specific characteristics of the transit line and its intended riders. Consideration of accessibility and affordability should be at the forefront.
Technology Integration: Modern fare systems frequently integrate with smart cards, mobile ticketing apps, and other technologies to improve efficiency, reduce fraud, and enhance the rider experience. This also involves deciding on the mode of payment acceptance.
Testing and Iteration: Before full-scale implementation, pilot programs or simulations are essential. This allows for adjustments and improvements to the fare system based on real-world feedback.
For example, a new light rail line serving a suburban area might benefit from a zone-based system, offering different fares depending on the distance traveled. Conversely, a bus rapid transit line operating within a dense urban core might opt for a simpler flat fare.
Q 11. Explain your understanding of fare integration with other transit services.
Fare integration with other transit services is critical for creating a seamless and convenient travel experience. This is often referred to as fare harmonization or interoperability. The goal is to allow riders to use a single payment method or ticket across multiple transit systems.
Common Payment Systems: One key aspect is establishing common payment systems, such as smart cards or mobile apps, accepted across all participating transit agencies. This eliminates the need for multiple tickets or passes and simplifies the fare payment process for riders.
Data Sharing and Interchange: For successful integration, efficient data sharing among different transit agencies is vital. This enables real-time tracking of fares, generating consolidated revenue reports, and facilitating effective fare management.
Fare Transfer Policies: Clear and well-defined fare transfer policies are needed. These policies outline how riders can transfer between different transit modes within a specified timeframe without incurring additional charges. This incentivizes multi-modal travel.
Pricing Strategies: Fare integration also impacts pricing strategies. Agencies need to coordinate pricing to avoid inconsistencies and ensure equitable fares for riders using different transit modes. For example, a coordinated price structure which offers discounts for multi-modal travel.
Technological Challenges: One of the main challenges relates to the technological integration of different fare collection systems. Ensuring compatibility between various technologies and establishing secure data exchange protocols requires careful planning and significant investment.
A successful example is the integration of bus, subway, and light rail systems in many major cities which allow riders to seamlessly transfer between modes using a single smart card.
Q 12. How do you incorporate cost-effectiveness into fare setting decisions?
Cost-effectiveness is paramount in fare setting. The goal is to find a balance between generating sufficient revenue to cover operating costs and remaining competitive to attract and retain riders. Several factors need careful consideration.
Operating Costs: A thorough understanding of operating costs is essential, including labor, maintenance, fuel, and administrative expenses. This provides a baseline for determining the minimum revenue required to maintain the transit system’s financial sustainability.
Demand Elasticity: Analyzing demand elasticity helps assess the impact of fare changes on ridership. If demand is inelastic (meaning ridership doesn’t change significantly with fare changes), a fare increase could generate more revenue. However, if demand is elastic (meaning ridership is highly sensitive to fare changes), a fare increase could lead to a revenue drop.
Cross-Subsidization: Certain routes or modes might be less profitable than others. This might require cross-subsidization – using revenue from profitable routes to support less profitable ones – to ensure equitable service across the entire transit network.
Equity Considerations: Fare setting should consider equity. This means ensuring fares are affordable for low-income riders, often through discounted passes or fare reduction programs. This also often involves examining demographic data to determine what constitutes an affordable fare for specific groups.
Competitive Landscape: It is important to consider the prices of competing transportation services, such as ride-sharing services and personal vehicles. This can influence pricing decisions to remain competitive and attract riders.
For instance, a city might implement a reduced fare for low-income seniors to ensure accessibility while still maintaining sufficient overall revenue through fares from other segments of its ridership.
Q 13. Describe your experience with budget forecasting and variance analysis related to transit fares.
Budget forecasting and variance analysis are crucial for effective transit fare management. Accurate forecasting helps ensure sufficient revenue to cover expenses, while variance analysis highlights discrepancies between planned and actual performance.
Budget Forecasting: This involves projecting future fare revenue based on historical data, projected ridership, anticipated fare changes, and other relevant factors. Time series analysis and forecasting techniques are frequently used to predict future revenue.
Variance Analysis: This process compares actual fare revenue to the forecasted budget. Significant variances (positive or negative) require investigation to identify their root causes. These variances may indicate successes or failures of marketing campaigns or operational inefficiencies that could have impacted revenue.
Scenario Planning: Creating multiple budget scenarios (e.g., optimistic, pessimistic, and most likely) allows for flexibility and adaptability in responding to unforeseen circumstances or changes in the external environment. This involves taking into account unpredictable variables such as changes in fuel costs or economic downturns.
Data Visualization: Presenting the forecast and variance analysis results visually through graphs and charts enhances understanding and facilitates communication to stakeholders. This allows easier identification of trends and areas requiring attention.
Continuous Monitoring: Regular monitoring of fare revenue and budget performance is essential for proactive management. This ensures that any issues are identified and addressed promptly, minimizing negative financial impacts.
For example, a significant negative variance might be investigated to see if changes to routes or schedules impacted ridership, requiring a revised budget and perhaps service adjustments.
Q 14. How would you analyze the impact of fare changes on ridership and revenue?
Analyzing the impact of fare changes on ridership and revenue is a critical task. This involves utilizing both quantitative and qualitative data to fully understand the consequences of these changes.
Ridership Data Analysis: Before and after the fare change, we would collect ridership data through automated fare collection systems (AFCS), surveys, and passenger counts. This data is used to determine the change in overall ridership and the specific impact on different passenger segments.
Revenue Analysis: A comparison of total revenue before and after the fare change will show the direct monetary impact. Analyzing the revenue per passenger and the overall revenue generated will indicate the success of the fare adjustment.
Elasticity of Demand: Calculating the price elasticity of demand helps measure the responsiveness of ridership to fare changes. This informs future pricing decisions and helps predict the outcome of potential fare adjustments.
Regression Analysis: Regression analysis can be employed to model the relationship between fares and ridership, controlling for other factors such as changes in service quality or economic conditions. This provides a more sophisticated understanding of the impact of the fare change.
Qualitative Feedback: Gathering qualitative feedback from riders through surveys or focus groups helps understand the reasons behind any changes in ridership. This provides valuable insights into rider perceptions and preferences, informing future pricing strategies and service improvements.
For instance, a fare increase might lead to a decrease in ridership, but if the increase in fares outweighs the reduction in riders, it could still result in a net increase in revenue. However, the decrease in ridership may necessitate further analysis and perhaps adjustments to service or marketing to address the loss of passengers.
Q 15. Explain your experience with data visualization tools for presenting fare revenue data.
Data visualization is crucial for effectively communicating fare revenue trends and insights. My experience encompasses a wide range of tools, from industry-standard business intelligence platforms like Tableau and Power BI to more specialized geographic information systems (GIS) software such as ArcGIS. I’m proficient in creating various chart types, including line charts to show revenue over time, bar charts to compare revenue across different routes or payment methods, and maps to visualize fare collection patterns geographically. For example, I once used Tableau to create an interactive dashboard showing daily fare revenue by station, allowing stakeholders to easily drill down into specific time periods and locations to identify anomalies or opportunities. This visualization dramatically improved decision-making regarding service adjustments and marketing campaigns. I also leverage Python libraries like Matplotlib and Seaborn for creating custom visualizations tailored to specific analytical needs.
Career Expert Tips:
- Ace those interviews! Prepare effectively by reviewing the Top 50 Most Common Interview Questions on ResumeGemini.
- Navigate your job search with confidence! Explore a wide range of Career Tips on ResumeGemini. Learn about common challenges and recommendations to overcome them.
- Craft the perfect resume! Master the Art of Resume Writing with ResumeGemini’s guide. Showcase your unique qualifications and achievements effectively.
- Don’t miss out on holiday savings! Build your dream resume with ResumeGemini’s ATS optimized templates.
Q 16. Describe a situation where you had to analyze complex data to solve a revenue-related problem.
In a previous role, we experienced a significant drop in monthly fare revenue. Initial analysis suggested a simple decrease in ridership. However, a deeper dive using SQL queries to analyze transactional data revealed a more complex issue. We discovered a previously undetected pattern of fraudulent transactions originating from a specific group of automated vending machines. By cross-referencing transaction times, locations, and payment methods with security camera footage, we identified a systematic skimming operation where fraudulent credit card readers were attached to the machines. This detailed analysis, which included statistical modeling to identify outlier transactions, allowed us to pinpoint the source of the problem, implement corrective measures (replacing the compromised machines and enhancing security protocols), and ultimately recover lost revenue.
Q 17. How do you ensure data accuracy and integrity in transit fare revenue analysis?
Data accuracy and integrity are paramount in fare revenue analysis. My approach involves a multi-layered strategy. First, I implement rigorous data validation checks at the source, verifying data consistency and completeness against expected values and ranges. This often involves working directly with fare collection system administrators to ensure proper data capture and transmission. Second, I employ data cleansing techniques to handle missing values, outliers, and inconsistencies. This might involve imputation for missing data or outlier removal, always documenting the methods used. Third, I regularly reconcile data from different sources – for example, comparing data from fare validators with financial records – to identify and resolve discrepancies. Finally, I utilize data governance practices, ensuring data access control and version management to maintain data integrity throughout the analytical process. Think of it like building a sturdy house: a strong foundation (data validation), clean construction (data cleansing), consistent measurements (reconciliation), and secure locks (data governance) are all essential for a reliable outcome.
Q 18. What are some common fraud schemes related to transit fares, and how can they be prevented?
Common transit fare fraud schemes include fare evasion (e.g., not paying fares, using expired or counterfeit tickets), fraudulent use of passes or discounts (e.g., sharing passes, using stolen or forged identification), and skimming (as described in a previous example). Prevention strategies involve a combination of technological solutions and operational improvements. This includes advanced fare collection systems with improved fraud detection capabilities, enhanced security cameras and surveillance technologies, regular audits of fare collection systems, employee training on fraud detection, and public awareness campaigns emphasizing fare payment honesty. For example, using contactless payment systems reduces the opportunity for counterfeit tickets, while incorporating advanced data analytics can identify unusual patterns suggestive of fraudulent activity.
Q 19. How would you use data to identify opportunities for increasing fare revenue?
Data analysis plays a critical role in identifying opportunities to increase fare revenue. By analyzing ridership patterns, we can identify underutilized routes or times of day where fare prices could be optimized. For instance, we might introduce dynamic pricing, adjusting fares based on demand, similar to surge pricing used by ride-sharing apps. Furthermore, analyzing customer demographics and travel behavior can inform targeted marketing campaigns to promote specific fare products or encourage off-peak travel. Data segmentation can also highlight customer segments with high potential for increased spending, enabling personalized offers and loyalty programs. Finally, identifying and addressing leakages in the fare collection system, as discussed previously, is crucial for maximizing revenue capture.
Q 20. How familiar are you with different fare payment technologies (e.g., contactless cards, mobile ticketing)?
I possess extensive familiarity with diverse fare payment technologies. This includes contactless cards (e.g., credit/debit cards, transit cards), mobile ticketing (using smartphones for fare purchase and validation), and open-loop payment systems (allowing payment with various cards). I understand the technical specifications, security protocols, and operational implications of each technology. My understanding extends to the data management aspects of each, knowing how to efficiently integrate data from various sources to construct a holistic view of fare revenue. I’m also aware of the challenges and opportunities each technology presents, such as scalability, cost-effectiveness, and user experience. For example, I’ve worked with projects integrating mobile ticketing platforms, requiring expertise in API integration and data synchronization between the mobile app and back-end fare collection systems.
Q 21. How do you balance the need to generate revenue with the need to maintain affordability and accessibility?
Balancing revenue generation with affordability and accessibility is a key challenge in transit fare management. It’s not simply about maximizing revenue but rather about ensuring a financially sustainable and equitable transit system. Strategies include implementing tiered fare structures with discounted fares for low-income riders or students, offering subsidized passes, and providing free or reduced-fare options for specific groups like seniors or people with disabilities. This requires carefully considering the social and economic impact of fare increases, conducting cost-benefit analyses, and potentially incorporating public input through surveys and community engagement. Data analytics can inform this process by identifying the impact of fare changes on ridership, equity, and overall system revenue, ensuring a data-driven approach to achieving a sustainable and socially responsible pricing model.
Q 22. Describe your experience with reporting and communicating financial findings to stakeholders.
Communicating financial findings effectively to stakeholders is crucial in transit fare revenue analysis. My approach involves translating complex data into clear, concise narratives tailored to the audience’s understanding. This includes creating visually appealing dashboards and presentations that highlight key performance indicators (KPIs) such as ridership trends, fare revenue growth, and cost-efficiency metrics. For executive summaries, I focus on high-level trends and recommendations, while more detailed reports provide granular insights for operational staff. For example, I’ve presented a report to our executive board demonstrating a 15% increase in fare revenue due to the implementation of a new contactless payment system, highlighting both the financial impact and the improved customer experience. In other cases, I’ve worked with operations teams to identify specific routes with underperforming fare collection, offering data-driven suggestions for improvement.
- Use of clear and concise language avoiding jargon.
- Visualizations such as charts and graphs to illustrate key findings.
- Tailoring the communication to the specific audience’s needs and technical expertise.
- Focus on actionable insights and recommendations.
Q 23. How would you interpret and explain complex financial reports related to transit fares?
Interpreting complex financial reports on transit fares requires a systematic approach. I start by understanding the report’s structure, identifying key data points, and cross-referencing information across different sections. For example, I’d look at revenue figures alongside ridership data to calculate farebox recovery ratios (the percentage of operating costs covered by fares). I’d also analyze trends over time, looking for seasonality, growth patterns, or anomalies. Any significant deviations from expected trends warrant further investigation. I might compare performance against benchmarks or industry averages to assess our competitiveness. Finally, I explain these findings using clear, non-technical language. Think of it like telling a story with the data – where did we start, what happened, and what does it mean for the future?
For instance, if a report shows a sudden dip in revenue, I’d look into potential causes like changes in ridership patterns, fare evasion, or issues with ticketing systems. I then formulate explanations incorporating these factors and suggest potential solutions. This might involve a deeper dive into operational data or even customer surveys to further understand the underlying causes.
Q 24. Describe your understanding of cost allocation and its impact on fare revenue analysis.
Cost allocation is crucial for accurate fare revenue analysis. It involves assigning operating costs to different aspects of the transit system – for example, assigning costs associated with bus maintenance to specific bus routes. This is essential because it allows us to assess the profitability of individual routes, services, or fare structures. If we don’t allocate costs correctly, we might misinterpret the financial performance of a given service. For instance, a route might appear unprofitable based on direct revenue, but when we allocate overhead costs fairly, it might become clear it’s contributing positively to the system’s overall financial health. Accurate cost allocation helps in making informed decisions about route optimization, fare adjustments, and service expansion.
I often utilize activity-based costing methods to allocate costs, which focus on the actual activities and resources used in providing transit services. This is more accurate than simply allocating costs based on a fixed percentage, as it reflects the actual resource consumption for each aspect of the service. For example, if a route requires more frequent maintenance, activity-based costing correctly reflects those increased costs, offering a more precise picture of its true profitability.
Q 25. How would you assess the effectiveness of different fare policies?
Assessing fare policy effectiveness requires a multi-faceted approach. First, I analyze ridership data to see how changes in fares impact passenger volume. A fare increase might lead to a decrease in ridership, but it could also increase revenue if the price elasticity of demand isn’t too high. I then compare revenue generated under different fare policies. Moreover, I examine the impact on different demographic groups – are certain groups disproportionately affected by fare changes? This analysis often involves econometric modeling to account for other factors influencing ridership (e.g., economic conditions, fuel prices, service quality). Equally important is evaluating customer satisfaction and equity. A more complex fare structure might increase revenue but could also negatively affect customer experience and accessibility. The overall effectiveness is judged by balancing revenue generation, ridership levels, customer satisfaction, and equity considerations. A successful fare policy optimizes these factors simultaneously.
Q 26. What are the ethical considerations involved in transit fare revenue management?
Ethical considerations in transit fare revenue management are paramount. Transparency is key: fares and their rationale should be clearly communicated to the public. Equity is another crucial aspect; fare policies shouldn’t disproportionately burden low-income individuals or certain communities. Fairness in enforcement is also vital. Aggressive fare evasion enforcement practices could exacerbate existing inequalities. Finally, data privacy must be protected; passenger data used for revenue analysis should be anonymized and handled responsibly, adhering to all relevant regulations. An ethical approach requires careful consideration of the potential social and economic impacts of fare policies, ensuring that they are both financially sound and socially equitable. For example, I’ve been involved in discussions on implementing reduced fares for low-income riders, carefully balancing the financial impact with the social benefits.
Q 27. How would you utilize predictive modeling to enhance revenue management strategies?
Predictive modeling is a powerful tool for enhancing revenue management. By analyzing historical data on ridership, fare revenue, and external factors like weather patterns and economic indicators, we can build models to forecast future demand. This allows for proactive adjustments to fare strategies, resource allocation, and service schedules. For example, using time-series analysis and machine learning techniques, we can predict ridership fluctuations during peak hours and special events, enabling optimized staffing and fare adjustments to maximize revenue during high-demand periods. Similarly, predictive models can assist in anticipating the impact of new fare policies, allowing for informed decision-making and mitigating potential negative consequences.
The models could incorporate variables like day of the week, time of day, weather, special events, and even social media sentiment to generate precise predictions. The outputs inform decisions about dynamic pricing, targeted marketing campaigns, and workforce scheduling. The key is to validate model predictions regularly and adapt them as new data becomes available. Continuous monitoring and refinement of the model are crucial for its long-term effectiveness.
Q 28. Describe your experience in working with large datasets related to transit operations.
My experience with large transit datasets is extensive. I’m proficient in using various data management and analysis tools, including SQL, Python (with libraries like Pandas and Scikit-learn), and data visualization platforms like Tableau. I have worked with datasets encompassing millions of fare transactions, ridership counts, and operational information from various sources (e.g., Automatic Vehicle Location systems, ticketing systems, and fare payment platforms). My workflow typically involves data cleaning, transformation, and integration to create a unified view. I then apply statistical analysis techniques and machine learning algorithms to extract insights and support decision-making. For example, I’ve used data mining techniques to identify patterns in fare evasion, leading to improved strategies for reducing losses. The ability to manage and analyze such large, complex datasets is crucial for extracting valuable insights and developing effective revenue management strategies in the transit industry. Data quality and integrity are paramount throughout the process.
Key Topics to Learn for Transit Fare and Revenue Analysis Interview
- Fare Structure Optimization: Understanding different fare structures (e.g., flat fare, distance-based, zonal), their impact on ridership and revenue, and methods for optimizing fare policies to maximize revenue while maintaining affordability and accessibility.
- Revenue Forecasting and Budgeting: Developing accurate revenue projections based on historical data, ridership trends, and fare adjustments. Practical application includes building financial models and managing budgets effectively.
- Ridership Analysis and Modeling: Analyzing ridership data to understand travel patterns, identify peak hours, and predict future demand. This involves using statistical methods and forecasting techniques to inform strategic decisions.
- Cost Analysis and Efficiency: Evaluating operational costs associated with transit systems and identifying opportunities for cost reduction and efficiency improvements. This includes understanding the relationship between fare revenue and operational expenditures.
- Data Visualization and Reporting: Effectively communicating complex data through clear and concise visualizations (charts, graphs, dashboards) to present findings to stakeholders and support decision-making.
- Financial Modeling and Sensitivity Analysis: Building financial models to assess the impact of different scenarios (e.g., fare increases, service changes) on revenue and ridership. This involves using sensitivity analysis to understand the uncertainties and risks involved.
- Performance Measurement and KPI’s: Defining and tracking key performance indicators (KPIs) to measure the effectiveness of fare policies and overall transit system performance. Examples include revenue per passenger, cost per passenger mile, and on-time performance.
Next Steps
Mastering Transit Fare and Revenue Analysis is crucial for career advancement in the transportation industry, opening doors to leadership roles and specialized expertise. A strong, ATS-friendly resume is your key to unlocking these opportunities. Crafting a compelling narrative that highlights your skills and experience is essential for getting noticed by recruiters. To enhance your resume-building process and significantly improve your job prospects, we strongly recommend using ResumeGemini. ResumeGemini provides a user-friendly platform and offers examples of resumes tailored to Transit Fare and Revenue Analysis, ensuring your application stands out from the competition.
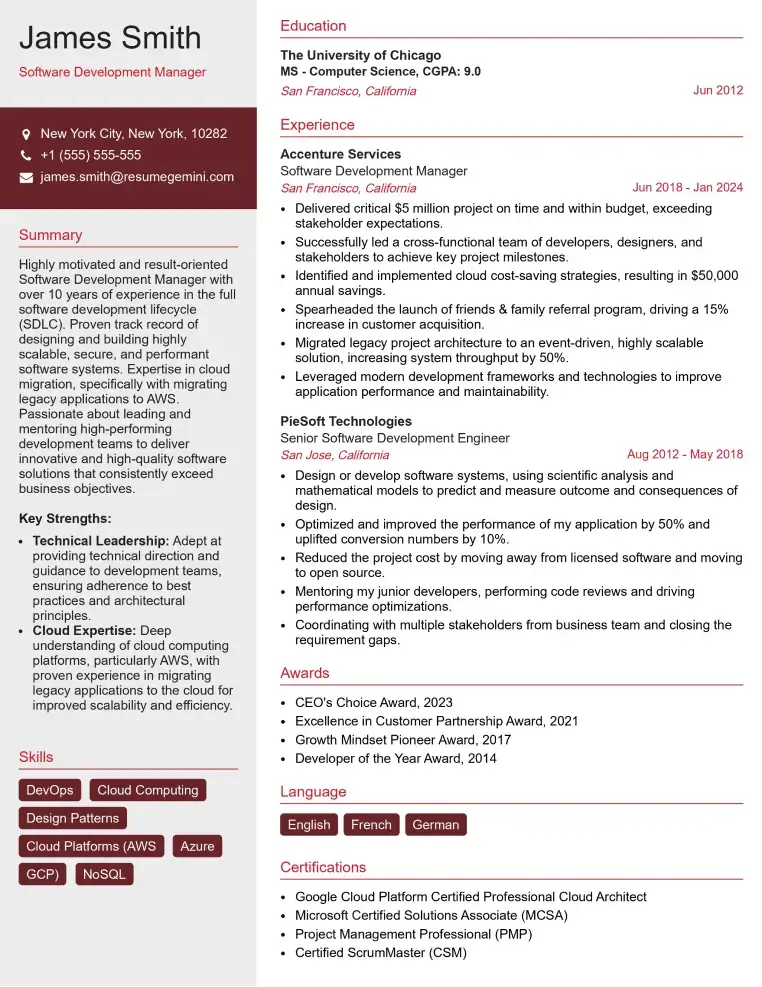
Check Out Resume Samples at ResumeGemini

Check Out Resume Samples at ResumeGemini
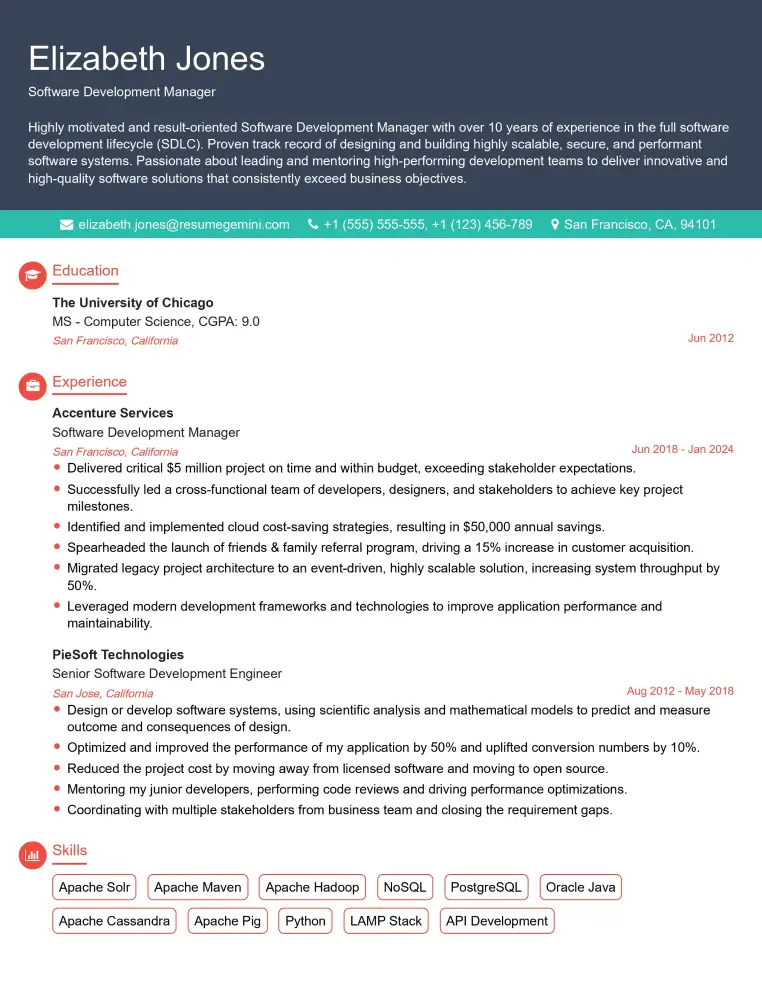
Check Out Resume Samples at ResumeGemini

Check Out Resume Samples at ResumeGemini

Check Out Resume Samples at ResumeGemini
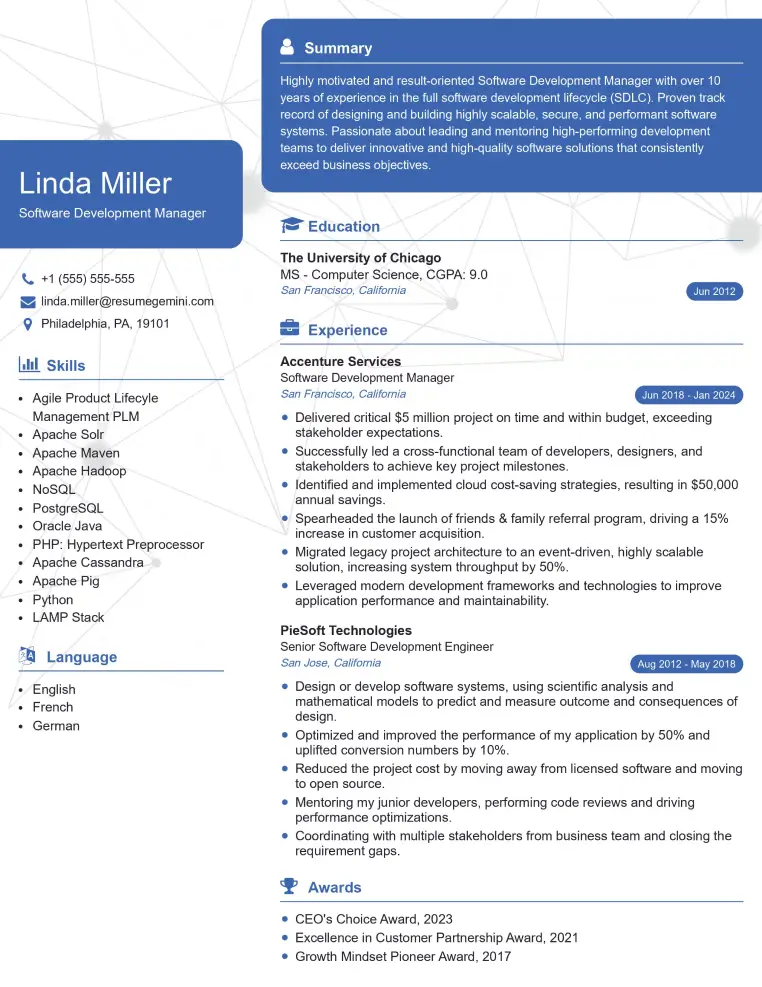
Check Out Resume Samples at ResumeGemini

Check Out Resume Samples at ResumeGemini
Explore more articles
Users Rating of Our Blogs
Share Your Experience
We value your feedback! Please rate our content and share your thoughts (optional).
What Readers Say About Our Blog
To the interviewgemini.com Webmaster.
Very helpful and content specific questions to help prepare me for my interview!
Thank you
To the interviewgemini.com Webmaster.
This was kind of a unique content I found around the specialized skills. Very helpful questions and good detailed answers.
Very Helpful blog, thank you Interviewgemini team.