Interviews are opportunities to demonstrate your expertise, and this guide is here to help you shine. Explore the essential Transit System Analysis interview questions that employers frequently ask, paired with strategies for crafting responses that set you apart from the competition.
Questions Asked in Transit System Analysis Interview
Q 1. Explain the difference between transit assignment and trip distribution models.
Trip distribution and transit assignment are two crucial steps in the four-step travel demand modeling process, which predicts how people will travel within a transportation network. They differ fundamentally in their focus:
Trip Distribution determines the number of trips originating in each zone and terminating in every other zone within the study area. Think of it as answering ‘how many trips go from point A to point B?’ It uses models like gravity models or intervening opportunities models based on factors such as distance, impedance (travel time, cost), and land use characteristics. For example, a gravity model would predict more trips between zones with larger populations and shorter travel times.
Transit Assignment takes the trip distribution results (the total number of trips between zones) and allocates these trips to specific transit routes and vehicles. It determines the ‘path’ each trip will take using network optimization algorithms. It considers factors like route availability, service frequency, transfer penalties, and travel time. In essence, it’s about answering ‘which specific transit routes will those trips use?’.
To illustrate, imagine you know 1000 people travel between Zone X and Zone Y. Trip distribution gives you that total. Transit assignment then determines how many of those 1000 use Bus Route A, Bus Route B, or maybe even a combination of routes involving transfers.
Q 2. Describe your experience with different transit simulation software (e.g., TRANSIMS, VISSIM).
I have extensive experience with various transit simulation software packages, including TRANSIMS and VISSIM. My projects have leveraged these tools to tackle diverse challenges.
TRANSIMS: I’ve used TRANSIMS for large-scale regional transit modeling, particularly for assessing the impact of major infrastructure investments or policy changes. Its strength lies in its ability to handle complex networks and large datasets, allowing for a comprehensive representation of the transit system and its interactions with other modes. I’ve used its microsimulation capabilities to simulate individual traveler behavior, providing insights into crowding, wait times, and overall system performance under different scenarios.
VISSIM: While primarily a traffic simulation software, VISSIM’s capabilities extend to modeling transit operations, particularly the interaction between buses and cars at intersections. I’ve utilized VISSIM to analyze the impact of bus priority measures at signalized intersections, optimizing signal timings to reduce bus delays and improve overall traffic flow. This is particularly useful in designing Bus Rapid Transit (BRT) systems.
Beyond these, I am also proficient with other simulation packages and tailor the choice of software to the specific project needs and available data.
Q 3. How do you handle missing data in transit datasets?
Missing data is a common challenge in transit analysis. My approach is multi-pronged and depends on the nature and extent of the missing data. Strategies I employ include:
Imputation techniques: For missing values in continuous variables (e.g., travel times), I use methods like mean imputation, regression imputation, or k-nearest neighbor imputation. The choice depends on the data distribution and potential biases. For example, mean imputation is simple but can distort the variance if missing data is not random.
Data augmentation: If data is sparse for certain routes or times, I may augment the data using similar routes or time periods where data is available, applying appropriate scaling factors. This should be done carefully to avoid introducing systematic errors.
Model-based imputation: In some cases, I use the model itself to predict missing values. For example, if I’m working with an origin-destination matrix, I might use a gravity model to estimate missing trip counts, leveraging existing data to inform the estimation.
Before choosing an imputation method, I always carefully analyze the pattern of missing data to understand the underlying mechanisms. Simply ignoring missing data can lead to biased or inaccurate results.
Q 4. What are the key performance indicators (KPIs) you would use to evaluate transit system performance?
Key Performance Indicators (KPIs) for evaluating transit system performance depend on the specific goals and objectives of the analysis, but some consistently important ones include:
On-time performance: The percentage of trips arriving on schedule. This reflects the reliability and efficiency of the system.
Headway regularity: The consistency of the time intervals between vehicles. Regular headways improve passenger experience and predictability.
Passenger load factor: The average occupancy rate of vehicles. High load factors indicate efficient capacity utilization, while excessively high load factors point to crowding issues.
Speed and travel time: The average speed and total travel time along routes. These metrics reflect the efficiency of the transit system and its attractiveness compared to other modes.
Dwell time: The amount of time a vehicle spends at stops. Minimizing dwell time is crucial for improving speed and frequency.
Accessibility: The extent to which the transit system serves different population groups and areas, considering factors like distance to stops, transfer requirements, and the availability of accessible vehicles.
Beyond these operational metrics, I also consider broader KPIs such as ridership, customer satisfaction, safety, and cost-effectiveness. The combination of KPIs used will depend on the context of the evaluation.
Q 5. Explain the concept of transit-oriented development (TOD).
Transit-Oriented Development (TOD) is an urban planning and design approach that maximizes the accessibility and desirability of transit options. It involves creating dense, mixed-use communities centered around high-quality public transportation hubs. The goal is to reduce reliance on private vehicles, promote walkability and bikeability, and create vibrant, sustainable neighborhoods.
Key features of TOD include:
High-density development: Concentrating housing, workplaces, and amenities within walking distance of transit stations.
Mixed-use zoning: Allowing a variety of uses (residential, commercial, retail) within the same area to create vibrant, 24/7 environments.
Pedestrian- and bicycle-friendly infrastructure: Providing safe and convenient walking and cycling paths connecting to transit stations.
Attractive public spaces: Creating parks, plazas, and other public spaces that enhance the quality of life and encourage social interaction.
Successful TOD projects create thriving communities, reduce traffic congestion, and improve air quality, showcasing a synergy between transportation and urban planning.
Q 6. How do you assess the effectiveness of different transit strategies (e.g., bus rapid transit, light rail)?
Assessing the effectiveness of different transit strategies requires a comprehensive approach that goes beyond simple ridership figures. I typically consider the following aspects:
Ridership and market share: How many people use the system, and how does this compare to other modes?
Speed and reliability: How quickly and reliably does the system transport passengers?
Accessibility: Does the system adequately serve all population segments?
Cost-effectiveness: What is the cost per passenger-mile, considering capital and operating expenses?
Environmental impact: What is the system’s contribution to greenhouse gas emissions and air pollution?
Impact on surrounding development: Does the system stimulate economic activity and development in the areas it serves?
For example, comparing Bus Rapid Transit (BRT) and light rail, I would analyze their relative performance based on these criteria. BRT systems generally have lower capital costs but might be less efficient in very high-density corridors where light rail offers higher capacity. The best choice depends on the specific context, considering factors such as ridership potential, available right-of-way, and the overall urban environment.
Q 7. Describe your experience with geographic information systems (GIS) in transit analysis.
Geographic Information Systems (GIS) are indispensable tools in my transit analysis workflow. I use GIS to:
Visualize transit networks: Creating maps of transit routes, stops, and service areas helps to understand the spatial distribution of the system.
Analyze spatial relationships: Assessing the proximity of transit stops to residential areas, workplaces, and other amenities. This is crucial for evaluating accessibility and understanding ridership patterns.
Integrate multiple datasets: Combining transit data with other spatial data like demographics, land use, and traffic patterns provides a richer understanding of the context in which the transit system operates.
Conduct spatial analysis: Using GIS tools to perform spatial queries, overlay analysis, and network analysis to solve problems such as finding optimal locations for new transit stops, evaluating service coverage, and measuring travel times.
Create maps and visualizations for reporting: Presenting findings and insights in a clear and compelling manner using maps and charts generated within the GIS environment.
For example, I’ve used GIS to identify underserved areas based on the distance to transit stops, population density, and socio-economic factors, informing decisions on service expansion and route optimization.
Q 8. How do you incorporate equity considerations into transit planning?
Incorporating equity into transit planning means ensuring that the system serves all members of the community fairly, regardless of income, race, ethnicity, disability, or age. It’s not just about providing transportation; it’s about providing equitable access to opportunities. This requires a multifaceted approach.
- Accessibility Analysis: We must analyze transit accessibility for different demographics, identifying areas with limited service or long travel times, particularly for vulnerable populations. For example, we’d analyze how far residents of low-income neighborhoods need to walk to a bus stop compared to wealthier areas.
- Targeted Investments: Prioritize investments in underserved communities, potentially by extending service into transit deserts, increasing frequency on routes serving low-income areas, or implementing affordable fare structures. Imagine prioritizing bus rapid transit (BRT) lines that connect affordable housing with job centers.
- Community Engagement: Engaging communities through surveys, public forums, and focus groups is essential to understanding their unique transportation needs and concerns. This ensures the plan reflects the community’s voice and avoids unintended negative consequences.
- Data-Driven Decision Making: Use disaggregated data to analyze ridership patterns by demographic groups to identify disparities and tailor solutions accordingly. This might reveal that certain ethnic groups have significantly lower transit usage due to service gaps or lack of information in their native language.
- Affordability: Exploring affordable fare options, such as reduced fares for low-income riders, is crucial for ensuring equitable access. Examples include subsidized passes or free transit for seniors and low-income individuals.
Ultimately, equity in transit planning is about creating a system that genuinely promotes social justice and improves the quality of life for all.
Q 9. Explain the role of accessibility analysis in transit system design.
Accessibility analysis is critical in transit system design, ensuring the system is usable by everyone, regardless of physical limitations or other needs. It’s about creating a truly inclusive system.
- Identifying Barriers: This involves identifying physical barriers (e.g., lack of ramps, narrow doorways on buses), operational barriers (e.g., infrequent service, lack of real-time information), and attitudinal barriers (e.g., lack of staff training on assisting people with disabilities).
- Assessing Accessibility: We use various methods such as site inspections, GIS analysis, and surveys to assess the level of accessibility throughout the system. GIS allows us to overlay demographic data with accessibility measures to identify areas needing improvement.
- Meeting Standards: Designs must meet accessibility standards, like the Americans with Disabilities Act (ADA) in the US or equivalent regulations in other countries. This includes ensuring level boarding on buses and trains, accessible signage, and audio announcements.
- Universal Design Principles: Incorporating universal design principles during the planning phase helps create a system that’s inherently accessible to all, avoiding the need for retrofitting later. This might involve designing wider sidewalks, clearly marked crosswalks, and intuitive wayfinding systems.
Effective accessibility analysis prevents the creation of systems that exclude specific populations and creates a positive impact on ridership and community well-being.
Q 10. What are the common challenges in transit network optimization?
Optimizing transit networks is a complex undertaking, facing numerous challenges:
- Conflicting Objectives: Balancing competing objectives like minimizing travel time, maximizing ridership, minimizing operating costs, and environmental impact is a significant challenge. What is best for one metric might negatively affect another.
- Data Availability and Quality: Accurate and up-to-date data on travel demand, population distribution, and road networks is crucial but can be lacking or inconsistent. Inconsistent data leads to inaccurate models and inefficient solutions.
- Computational Complexity: Optimizing large-scale transit networks requires sophisticated algorithms and substantial computing power. Solving these problems efficiently and effectively can be resource-intensive.
- Dynamic Demand: Transit demand fluctuates throughout the day and across seasons, making it difficult to design a schedule that optimally serves all peak and off-peak periods. A perfectly designed schedule for rush hour might be severely underutilized during off-peak hours.
- Unpredictable Events: Unexpected events such as traffic congestion, accidents, or weather can disrupt schedules and affect optimal route choices. Robust solutions must consider contingencies and ways to deal with unpredictable events.
- Stakeholder Coordination: Effective network optimization requires collaboration with various stakeholders, including transit agencies, local governments, and the public. Balancing competing interests and needs can be challenging.
Addressing these challenges often involves using advanced optimization techniques, such as mathematical programming and simulation, combined with robust data analysis and stakeholder engagement strategies.
Q 11. Describe different transit fare collection methods and their implications.
Transit fare collection methods significantly impact ridership, operational efficiency, and the rider experience. Here are some common methods and their implications:
- Cash: Simple but inefficient, prone to theft and requires manual counting and reconciliation. It also lacks the ability to track ridership data effectively.
- Magnetic Strip Cards: These cards store fare information magnetically, offering a more efficient system than cash but are susceptible to fraud and damage.
- Smart Cards (Contactless): These cards use contactless technology (e.g., RFID) to store fare information and offer greater security, flexibility (e.g., storing multiple passes), and data collection capabilities. Examples include Oyster cards (London) or CharlieCards (Boston).
- Mobile Ticketing: Allows users to purchase and present tickets via smartphones, offering convenience and integration with other transit apps. However, it requires reliable mobile connectivity and can pose challenges for users with limited digital literacy or access to smartphones.
- Account-Based Ticketing: This system links fares to user accounts, allowing for flexible payment options, automatic fare calculation (based on distance traveled or time), and real-time data collection. This system often integrates with multiple payment methods such as credit cards or mobile payment apps.
The choice of fare collection method involves a trade-off between cost, efficiency, security, convenience, and data-collection capabilities. The selection depends on the size and characteristics of the transit system and the needs of its riders.
Q 12. How do you forecast future transit demand?
Forecasting future transit demand is crucial for effective planning and resource allocation. It involves a combination of quantitative and qualitative methods.
- Historical Data Analysis: Analyzing past ridership trends (using time series analysis) identifies patterns and seasonality. This allows for projecting future demand based on historical growth rates.
- Land Use and Development Forecasts: Analyzing projected population growth, employment changes, and new development projects provides an understanding of future travel patterns. Growth near transit stations will often drive demand growth.
- Econometric Modeling: Using econometric models that incorporate various factors influencing transit demand (e.g., income levels, fuel prices, parking costs) yields more robust forecasts. These models establish statistical relationships between independent variables and transit demand.
- Survey Data and Public Opinion: Surveys and focus groups can gauge public preferences and intentions regarding transit use, identifying potential shifts in demand due to changes in lifestyle or attitudes towards transit.
- Scenario Planning: Developing different scenarios (e.g., optimistic, pessimistic, baseline) based on various assumptions allows for a comprehensive understanding of potential future demand under different circumstances.
The accuracy of the forecast improves by combining multiple methods and regularly updating the models with new data. A successful forecast requires a deep understanding of local dynamics, external factors, and potential disruptive technologies.
Q 13. Explain your understanding of transit scheduling and routing algorithms.
Transit scheduling and routing algorithms are the heart of efficient transit operations. They aim to optimize service delivery while minimizing costs and maximizing efficiency.
- Scheduling Algorithms: These algorithms create optimal schedules that assign vehicles to trips, considering factors like vehicle availability, crew constraints, and maintenance requirements. Common approaches include constraint programming and integer programming.
Example: A simple algorithm could prioritize assigning longer trips to larger vehicles and shorter trips to smaller ones. - Routing Algorithms: These algorithms determine the best routes for vehicles, considering factors like travel time, distance, passenger demand, and road conditions. Algorithms like Dijkstra’s algorithm or A* search are often employed for finding shortest paths, while more advanced techniques like dynamic programming are needed for complex scenarios.
- Integration with Real-Time Data: Modern systems integrate real-time data (e.g., GPS tracking, traffic conditions) to dynamically adjust schedules and routes, allowing for better response to unforeseen events like accidents or delays. This creates more responsive and resilient transit systems.
- Simulation and Optimization: Simulation models help assess the performance of various scheduling and routing strategies before implementation. Optimization techniques ensure that the chosen algorithms provide optimal results based on defined objectives (e.g., minimizing delays, maximizing passenger flow).
The complexity of these algorithms varies greatly depending on the scale and complexity of the transit network. Advancements in computer science and data analytics continue to drive improvements in scheduling and routing efficiency, leading to better service quality and reduced costs.
Q 14. What are some common methods for evaluating the environmental impact of transit systems?
Evaluating the environmental impact of transit systems is crucial for sustainable urban planning. Common methods include:
- Life Cycle Assessment (LCA): LCA evaluates the environmental impact of a transit system throughout its entire life cycle, from material extraction to disposal. This includes assessing energy consumption, greenhouse gas emissions, water usage, and waste generation at each stage.
- Greenhouse Gas Emissions Analysis: Quantifying greenhouse gas (GHG) emissions (CO2, methane, etc.) associated with vehicle operation, energy production, and infrastructure construction is critical. This helps to identify areas for reduction and evaluate the system’s contribution to climate change.
- Air Quality Modeling: Assessing the impacts of transit operations on local air quality, particularly the levels of pollutants like particulate matter and nitrogen oxides, is important, especially in densely populated areas.
- Energy Consumption Analysis: Analyzing the energy consumption associated with transit operations (electricity, fuel) and comparing it to alternative modes of transportation (e.g., private vehicles) helps to quantify the energy efficiency of the system.
- Noise Pollution Assessment: Measuring noise levels generated by transit vehicles and infrastructure helps identify noise-sensitive areas and develop mitigation strategies, such as noise barriers or quieter vehicles.
These assessments often use specialized software and models, and the results are typically expressed in terms of environmental indicators like GHG emissions per passenger-kilometer or air pollutant concentrations.
Q 15. How do you address congestion in transit networks?
Addressing congestion in transit networks requires a multi-pronged approach focusing on increasing capacity, improving efficiency, and managing demand. Think of it like unclogging a drain – you need to address both the flow of water (passengers) and the size of the pipe (infrastructure).
Increasing Capacity: This involves adding more vehicles, expanding existing lines, building new lines or stations, and implementing high-capacity transit systems like Bus Rapid Transit (BRT) or light rail. For example, adding express bus routes during peak hours can significantly alleviate congestion on major roadways.
Improving Efficiency: Optimizing signal timing for buses and trains, implementing smart traffic management systems, and utilizing real-time data to adjust service schedules in response to changing demand are key. Imagine a traffic light system that prioritizes transit vehicles – that’s a major efficiency improvement.
Managing Demand: This includes promoting alternative modes of transport (cycling, walking), implementing congestion pricing (charging drivers to enter congested areas), and encouraging off-peak travel through flexible work arrangements or incentives. Think of offering discounts on transit fares during off-peak hours to spread out demand.
A successful strategy often involves a combination of these approaches, tailored to the specific characteristics of the transit network and the community it serves. For instance, a city might invest in a new light rail line to handle increasing ridership while simultaneously implementing a congestion pricing program to reduce car traffic.
Career Expert Tips:
- Ace those interviews! Prepare effectively by reviewing the Top 50 Most Common Interview Questions on ResumeGemini.
- Navigate your job search with confidence! Explore a wide range of Career Tips on ResumeGemini. Learn about common challenges and recommendations to overcome them.
- Craft the perfect resume! Master the Art of Resume Writing with ResumeGemini’s guide. Showcase your unique qualifications and achievements effectively.
- Don’t miss out on holiday savings! Build your dream resume with ResumeGemini’s ATS optimized templates.
Q 16. Describe your experience with transit data visualization and reporting.
My experience with transit data visualization and reporting involves leveraging various tools and techniques to communicate complex information clearly and effectively. I’ve worked extensively with GIS software (like ArcGIS) to map transit routes, visualize ridership patterns, and identify areas needing improvement. I also use data visualization tools such as Tableau and Power BI to create interactive dashboards displaying key performance indicators (KPIs) like on-time performance, passenger load factors, and service reliability.
For example, in a recent project, I created a dashboard showing real-time bus locations, delays, and predicted arrival times. This allowed transit operators to proactively address delays and inform passengers of potential disruptions. I also developed reports comparing ridership trends across different lines and time periods, aiding in strategic decision-making regarding service adjustments and resource allocation. The key is to transform raw data into actionable insights that improve service and inform planning decisions.
Q 17. How do you measure customer satisfaction with transit services?
Measuring customer satisfaction with transit services requires a multi-faceted approach employing both quantitative and qualitative methods. It’s not just about asking one question; it’s about understanding the whole picture.
Surveys: Regular customer surveys (online, phone, or in-person) can gauge satisfaction with various aspects of the service, such as frequency, cleanliness, safety, and overall travel experience. These are quantitative, but the open-ended comments can also yield qualitative insights.
Focus Groups: Conducting focus groups provides in-depth feedback and allows for discussions about specific pain points. This helps understand ‘why’ behind satisfaction ratings.
Social Media Monitoring: Monitoring social media channels can capture real-time feedback and identify emerging issues. Sentiment analysis tools can help quantify the overall tone of public discourse.
Ridership Data: Changes in ridership patterns can indirectly reflect customer satisfaction. A drop in ridership on a particular route might indicate a problem requiring investigation.
By combining these methods, we build a comprehensive understanding of customer satisfaction, informing improvements and ensuring the transit system effectively meets the needs of its users. For instance, if we see a consistent drop in satisfaction related to bus cleanliness, we can focus efforts there.
Q 18. Explain the concept of modal split and its relevance to transit planning.
Modal split refers to the proportion of passengers using different modes of transportation (car, bus, train, bike, walk) to travel within a specific area. It’s crucial for transit planning because it shows the existing travel patterns and helps predict future demand for different modes. Imagine a pie chart representing the percentage of people using each mode – that’s a visual representation of modal split.
Understanding modal split is vital for making informed decisions about infrastructure investments. If a high percentage of commuters rely on cars, investing in bus rapid transit might not be as effective as expanding road capacity or implementing congestion pricing. Conversely, a high modal split on public transit indicates opportunities to optimize and expand service, improving efficiency and attracting even more riders.
Analyzing modal split allows planners to anticipate future demand and strategically allocate resources for sustainable transportation development. It’s a key tool in long-term planning, helping cities to design transportation systems that meet the needs of their citizens and contribute to a sustainable future.
Q 19. What are some strategies for improving transit ridership?
Improving transit ridership requires a multi-faceted strategy focusing on service quality, accessibility, and marketing. It’s about making transit the most convenient and attractive option.
Improve Service Quality: Increased frequency, reliability, and cleanliness are crucial. Consider implementing real-time tracking, modern vehicles, and comfortable waiting areas.
Enhance Accessibility: Ensuring the system is accessible to all, including people with disabilities, is vital. This includes implementing features like ramps, elevators, and audio announcements.
Improve Connectivity: Good connections between different modes of transit are essential. Consider implementing integrated ticketing systems and improving last-mile connections (e.g., bike sharing).
Marketing and Communication: Effective marketing campaigns, highlighting the benefits of transit (cost savings, environmental benefits, convenience), can significantly increase ridership.
Fare Strategies: Implementing affordable fare structures, such as day passes or discounted fares for students and seniors, can incentivize ridership. Consider introducing fare capping or monthly passes.
For example, a city might launch a public awareness campaign showcasing the environmental benefits of using public transit, while also investing in new bus shelters and improving bus route frequency.
Q 20. How do you evaluate the cost-effectiveness of different transit projects?
Evaluating the cost-effectiveness of different transit projects requires a thorough cost-benefit analysis (CBA). This involves comparing the total costs of a project with its expected benefits over its lifespan. It’s not simply about the initial investment but the long-term financial viability and societal impact.
A comprehensive CBA should consider various factors, including:
Construction Costs: Includes materials, labor, and land acquisition.
Operational Costs: Includes maintenance, staffing, and energy consumption.
Benefits: Includes reduced congestion, improved air quality, increased economic activity, and reduced travel time for passengers.
Disbenefits: Includes displacement of residents or businesses, noise pollution, and potential negative impacts on the environment.
The CBA typically uses techniques like discounted cash flow analysis to compare costs and benefits over time. The result provides a clear picture of the project’s overall economic viability and helps decision-makers prioritize projects that offer the greatest return on investment for the community.
For instance, comparing the cost of building a new light rail line versus expanding bus service requires careful consideration of construction costs, operational expenses, ridership projections, and the overall impact on traffic congestion and air quality. The project with the highest net present value (NPV) is often considered the most cost-effective.
Q 21. Explain your understanding of transit security and safety measures.
Transit security and safety measures are paramount for ensuring a comfortable and reliable service for passengers and staff. A layered approach combining physical security, technology, and community engagement is essential.
Physical Security: This includes well-lit stations and vehicles, security cameras, emergency call buttons, and increased police presence in high-risk areas. Think of it as creating a visible and secure environment.
Technology: This encompasses technologies like GPS tracking for vehicles, smart surveillance systems, and fare payment systems that minimize cash handling. This brings in an element of proactive monitoring and prevention.
Community Engagement: Working with local communities to address safety concerns and build trust is crucial. This might include public forums, partnerships with community groups, and public awareness campaigns promoting safe transit practices.
Emergency Response Planning: Having clear emergency procedures and well-trained staff is essential for effective response in case of incidents.
A holistic approach focusing on prevention, detection, and response is vital. For example, implementing a comprehensive CCTV system alongside regular security patrols and a public awareness campaign about personal safety on transit can create a safer and more secure environment.
Q 22. Describe your experience with transit system planning at different scales (e.g., regional, local).
My experience in transit system planning spans various scales, from regional master plans to hyperlocal route optimizations. At the regional level, I’ve been involved in developing long-term transportation strategies, considering factors like population growth projections, land use patterns, and economic development. This often involves using sophisticated modeling software to simulate different scenarios and evaluate their impact on accessibility, travel times, and environmental sustainability. For instance, I worked on a regional plan in the Denver metro area, integrating light rail expansion with bus rapid transit (BRT) lines to enhance connectivity across the region. At the local level, my work has focused on micro-optimizations, such as adjusting bus routes to better serve community needs based on ridership data and real-time feedback. This could involve adjusting schedules to reflect peak demand or strategically placing stops to better serve specific areas, like hospitals or schools. A recent project involved redesigning a local bus route in a rapidly growing suburban area, incorporating input from residents and businesses to maximize efficiency and convenience.
Q 23. How do you incorporate feedback from stakeholders into transit planning processes?
Incorporating stakeholder feedback is crucial for successful transit planning. We utilize a multi-pronged approach. This includes public forums, online surveys, focus groups, and individual interviews with key stakeholders—from residents and business owners to disability advocates and environmental groups. We use qualitative data from these interactions to inform quantitative analysis. For example, feedback from a public forum might reveal concerns about safety on a particular route. This information could then be incorporated into a safety analysis, potentially leading to the addition of more security measures or adjustments to lighting and landscaping. Data analysis and visualization tools are used to make this feedback easily understandable and accessible for all stakeholders.
Furthermore, building strong relationships and creating transparency throughout the planning process are essential. Regular communication updates, accessible online resources, and opportunities for ongoing dialogue foster trust and ensure stakeholder concerns are not only heard but also actively addressed.
Q 24. What are some challenges in integrating different transit modes into a seamless system?
Integrating different transit modes into a seamless system presents significant challenges. These include differing technologies, fare structures, scheduling complexities, and data incompatibility. For instance, integrating a light rail system with a bus network requires careful coordination of schedules to ensure efficient transfers. Passengers need to easily understand the connection points, timings, and potential waiting times. A unified fare system is crucial to make transfers smooth and affordable; a system where a single ticket allows travel across multiple modes is desirable, but often complicated to implement due to different governing bodies and operational structures.
Addressing these challenges requires a systematic approach: developing intermodal transfer facilities with clear signage and real-time information displays; implementing a unified fare collection system with seamless integration across all modes; using common data standards and technology platforms across the different transit agencies; and fostering collaboration and communication among agencies. Successful integration significantly improves the rider experience and increases overall ridership by offering greater flexibility and convenience.
Q 25. Describe your experience with transit revenue management.
My experience with transit revenue management includes developing and implementing fare strategies, analyzing ridership data to optimize revenue generation, and managing budgets. It involves understanding the interplay between fare prices, ridership levels, and overall operational costs. This requires a delicate balance—fares need to be affordable and equitable while also generating enough revenue to cover operational expenses and maintain the quality of service.
Strategies include fare adjustments based on time of day, distance traveled, or frequency of use. We also explore different payment methods, such as mobile ticketing and contactless payment systems to enhance convenience and reduce operational costs associated with cash handling. Regular financial modeling and forecasting are critical to anticipate future revenue needs and make informed decisions about investments in new infrastructure or services.
Q 26. How do you use data analytics to improve transit operations?
Data analytics plays a crucial role in improving transit operations. We use various data sources, including Automatic Vehicle Location (AVL) data, smart card transaction records, and passenger surveys to gain insights into system performance. For example, AVL data helps monitor vehicle location, speed, and dwell times at stops, allowing us to identify delays and potential bottlenecks. This information can be used to optimize schedules, improve traffic flow, and enhance overall punctuality. Ridership data allows us to understand demand patterns, helping us to adjust service levels to meet fluctuating needs, minimizing both overcrowded and underutilized routes. By analyzing passenger surveys, we can gauge customer satisfaction and identify areas for service improvements.
Techniques like predictive modeling and machine learning can be applied to forecast future demand, optimize resource allocation, and improve the efficiency of the transit network. For instance, predictive models can forecast ridership during special events or based on weather conditions, enabling more efficient scheduling and deployment of resources.
Q 27. Explain your understanding of the role of technology in improving transit efficiency.
Technology is transforming transit systems, boosting efficiency and improving the rider experience. Examples include: AVL systems for real-time tracking and improved scheduling; intelligent transportation systems (ITS) to manage traffic flow and reduce congestion; mobile ticketing apps for convenient fare payment; and smart card systems for fare management and data collection. The use of big data analytics and machine learning enables better prediction of demand, leading to optimized routing and resource allocation. These technologies also improve safety through features such as advanced driver-assistance systems and improved communication between control centers and vehicles.
However, challenges remain including the cost of implementation, data security, integration of different systems, and the need for robust cybersecurity measures. The successful integration of technology requires careful planning, collaboration among stakeholders, and a commitment to ongoing maintenance and updates. It’s important to always prioritize user-friendly interfaces and accessible technologies to ensure equity and inclusivity for all riders.
Q 28. Describe your experience with transit project management.
My experience in transit project management encompasses all phases of a project lifecycle, from initiation and planning to execution, monitoring, and closure. This includes developing project plans, managing budgets and schedules, coordinating with various stakeholders, and ensuring projects are delivered on time and within budget. I’ve utilized project management methodologies such as Agile and Waterfall, adapting the approach based on the specific project requirements.
For instance, in overseeing the implementation of a new BRT system, I managed a multi-disciplinary team of engineers, planners, and construction professionals. This involved developing a detailed project schedule, securing necessary permits and approvals, managing risks and potential delays, and ensuring adherence to quality standards. Effective communication and collaboration were key to keeping the project on track, while utilizing project management software helped track progress, manage resources, and mitigate risks effectively. Post-project evaluations are also critical to identifying lessons learned and improving future projects.
Key Topics to Learn for Transit System Analysis Interview
- Network Design and Optimization: Understanding principles of network design, including route planning, frequency optimization, and service area analysis. Practical application: Evaluating the efficiency of existing bus routes and proposing improvements.
- Demand Forecasting and Modeling: Mastering techniques for predicting future transit demand, including statistical modeling and forecasting methodologies. Practical application: Projecting ridership for a new light rail line based on population growth and land use patterns.
- Performance Measurement and Evaluation: Familiarize yourself with key performance indicators (KPIs) used to assess transit system effectiveness, such as on-time performance, speed, and ridership. Practical application: Analyzing data to identify bottlenecks and inefficiencies in a transit system.
- Simulation and Modeling Software: Gain proficiency in using transit simulation software (e.g., TransModeler, Aimsun) to model and analyze different scenarios. Practical application: Simulating the impact of a new bus rapid transit (BRT) system on traffic congestion.
- Data Analysis and Visualization: Develop strong skills in data analysis and visualization to effectively communicate findings and support decision-making. Practical application: Creating insightful dashboards to monitor key performance indicators and identify areas for improvement.
- Transit Planning and Policy: Understand the broader context of transit planning within urban and regional development strategies. Practical application: Evaluating the environmental and social impacts of different transit options.
Next Steps
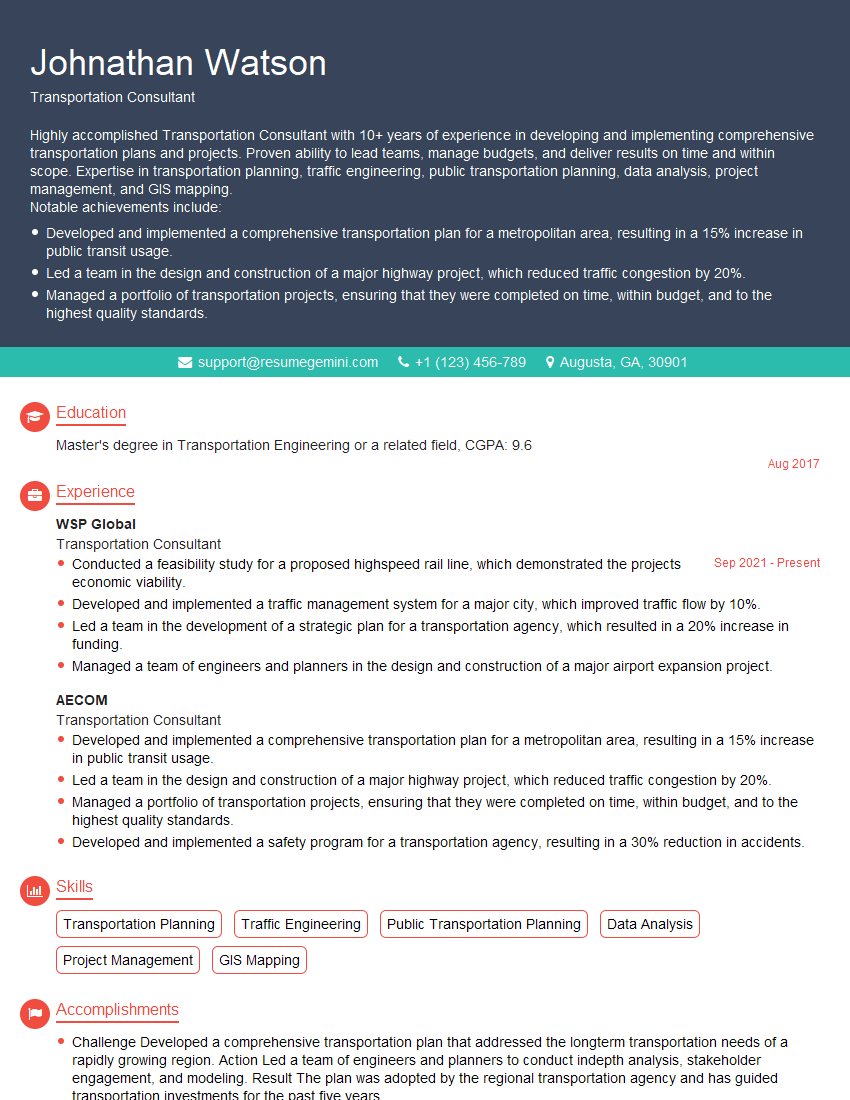
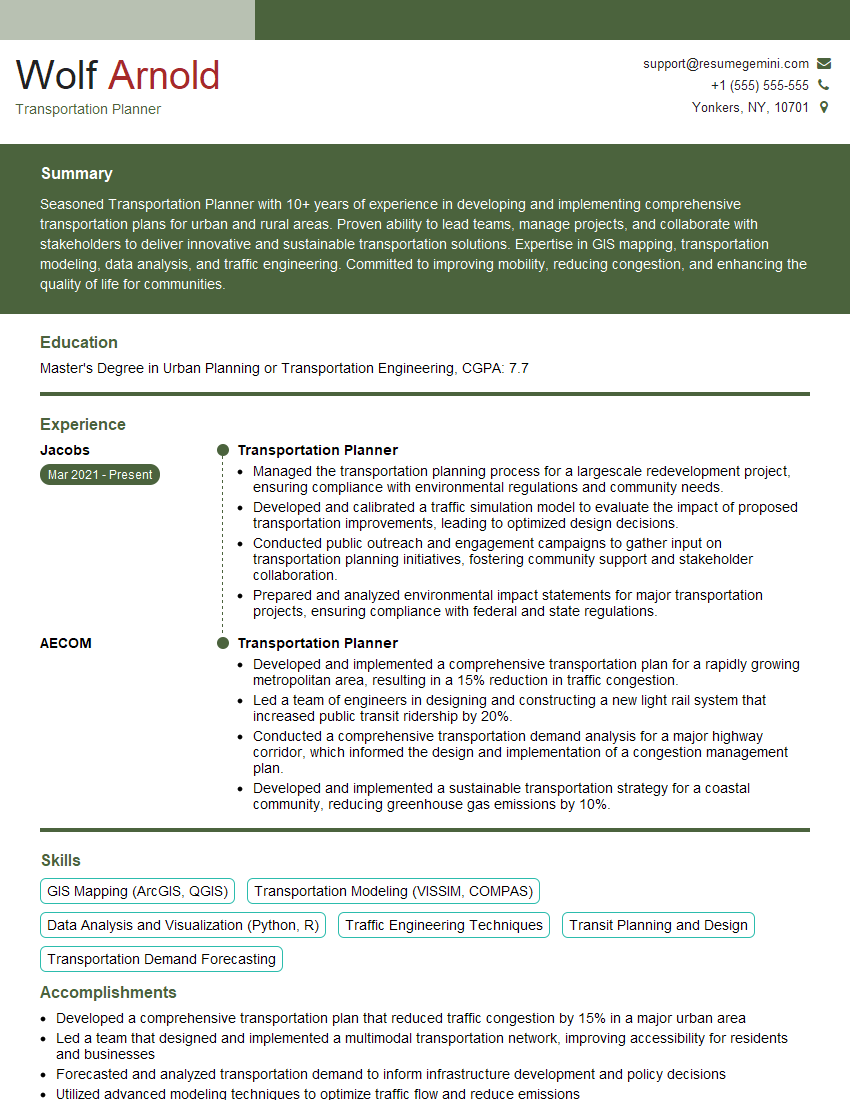
Mastering Transit System Analysis is crucial for advancing your career in transportation planning and engineering. A strong understanding of these concepts opens doors to exciting opportunities and positions you as a valuable asset to any transit agency or consulting firm. To significantly enhance your job prospects, creating a compelling and ATS-friendly resume is essential. ResumeGemini is a trusted resource that can help you build a professional resume that showcases your skills and experience effectively. Examples of resumes tailored to Transit System Analysis are available to help you get started.

Explore more articles
Users Rating of Our Blogs
Share Your Experience
We value your feedback! Please rate our content and share your thoughts (optional).
What Readers Say About Our Blog
To the interviewgemini.com Webmaster.
Very helpful and content specific questions to help prepare me for my interview!
Thank you
To the interviewgemini.com Webmaster.
This was kind of a unique content I found around the specialized skills. Very helpful questions and good detailed answers.
Very Helpful blog, thank you Interviewgemini team.