Preparation is the key to success in any interview. In this post, we’ll explore crucial Knowledge of Demographic Theories interview questions and equip you with strategies to craft impactful answers. Whether you’re a beginner or a pro, these tips will elevate your preparation.
Questions Asked in Knowledge of Demographic Theories Interview
Q 1. Explain the difference between crude birth rate and age-specific fertility rate.
Both crude birth rate and age-specific fertility rate are measures of births, but they differ significantly in what they tell us about a population. The crude birth rate (CBR) is a simple calculation: the number of live births per 1,000 people in a population in a given year. It provides a general overview of fertility but doesn’t account for the age structure of the population. For instance, a country with a high proportion of young women of childbearing age will likely have a higher CBR than a country with an aging population, even if the fertility rates within the childbearing age groups are similar.
The age-specific fertility rate (ASFR), on the other hand, offers a much more nuanced perspective. It calculates the number of live births per 1,000 women of a specific age group (e.g., 15-19, 20-24, etc.) during a given year. This allows demographers to understand fertility patterns across different age groups, providing a more accurate picture of reproductive behavior. For example, ASFRs can reveal if fertility is concentrated in younger or older age groups, which is vital for understanding potential population growth.
In essence, CBR gives a broad snapshot, while ASFR provides a detailed breakdown of fertility by age group, leading to a more accurate understanding of population dynamics.
Q 2. Describe the demographic transition model and its limitations.
The demographic transition model is a helpful framework for understanding the changes in birth and death rates as a society develops. It posits that countries typically progress through four stages (some add a fifth):
- Stage 1 (Pre-industrial): High birth rates and high death rates result in slow or no population growth. Think of pre-industrial societies with limited healthcare and high infant mortality.
- Stage 2 (Early industrial): Death rates decline significantly due to improvements in sanitation, healthcare, and food supply. Birth rates remain high, leading to rapid population growth. This stage is often associated with the beginnings of industrialization.
- Stage 3 (Late industrial): Birth rates start to decline as societies become more urbanized, access to education increases, and the cost of raising children rises. Population growth slows down.
- Stage 4 (Post-industrial): Both birth and death rates are low, resulting in slow or zero population growth, or even population decline. This is characteristic of highly developed countries.
- Stage 5 (Hypothetical): Some argue for a fifth stage where the death rate begins to exceed the birth rate resulting in a population decline.
Limitations of the model:
- Oversimplification: It doesn’t account for variations in cultural, social, and political factors that influence fertility and mortality.
- Eurocentric Bias: The model is based on the historical experience of Western European countries and may not accurately reflect the demographic transitions of other regions.
- Ignoring Migration: It doesn’t consider the significant impact of migration on population size and growth.
- Lack of Predictability: It doesn’t predict precisely when or how quickly a country will transition between stages.
For example, some countries have experienced rapid declines in fertility rates without experiencing the full industrial development characteristic of Stage 3, highlighting the limitations of applying this model universally.
Q 3. What are the key factors influencing population growth?
Population growth is a complex phenomenon influenced by a combination of factors, primarily:
- Fertility Rates: The average number of children born to a woman during her reproductive years. This is significantly impacted by access to contraception, education levels, cultural norms around family size, and government policies.
- Mortality Rates: The number of deaths per 1,000 people in a given population. Improvements in healthcare, sanitation, and nutrition lead to lower mortality rates, while factors like disease outbreaks, famine, and conflict can increase them.
- Migration: The movement of people into (immigration) or out of (emigration) a country or region. Net migration (immigration minus emigration) significantly impacts population size and distribution.
These factors often interact in complex ways. For instance, improved healthcare (lower mortality) can lead to a larger population, which in turn might put pressure on resources, impacting fertility rates. Government policies, such as family planning initiatives or immigration laws, play a crucial role in shaping these factors and influencing population growth.
Q 4. How do mortality rates differ across different age groups and socioeconomic statuses?
Mortality rates vary substantially across different age groups and socioeconomic statuses. Age-specific mortality rates show a clear pattern: mortality is highest among infants and the elderly. Infants are vulnerable to diseases and birth complications, while older individuals are more susceptible to age-related illnesses. Mortality rates generally decline during childhood and young adulthood before rising again in later life.
Socioeconomic status (SES) plays a critical role in determining mortality. Individuals with lower SES often experience higher mortality rates due to factors like limited access to quality healthcare, poorer nutrition, hazardous working conditions, and higher exposure to environmental risks. This disparity can be seen across various health outcomes, including infant mortality, cardiovascular disease, and cancer. For example, studies consistently show that individuals from lower socioeconomic backgrounds have higher rates of premature death compared to their wealthier counterparts. Addressing these socioeconomic disparities is key to improving overall population health and reducing mortality rates.
Q 5. Explain the concept of population momentum.
Population momentum refers to the tendency for population growth to continue even after fertility rates have declined. This is because a large proportion of the population is still in the younger age groups, entering their reproductive years. Imagine a population pyramid with a wide base (many young people) and a narrower top (fewer older people). Even if these young people have fewer children, there are so many of them that the population will still grow for several decades.
This momentum is driven by the existing age structure. A decline in fertility rates doesn’t immediately halt population growth; it takes time for the age structure to shift. Understanding population momentum is crucial for long-term population projections and planning for the future. For example, countries with historically high fertility rates might continue to experience population growth for decades even after adopting family planning policies.
Q 6. Discuss the implications of an aging population.
An aging population, characterized by a rising proportion of older individuals (typically defined as those aged 65 and older), has profound implications across numerous sectors:
- Increased healthcare costs: The elderly generally require more healthcare services, placing a strain on healthcare systems.
- Strain on pension systems: A larger elderly population necessitates higher pension payouts, potentially leading to financial strain on government budgets.
- Labor shortages: A shrinking workforce can lead to labor shortages and reduced economic productivity.
- Increased demand for age-friendly infrastructure: The need for senior-friendly housing, transportation, and other services grows significantly.
- Shifting societal structures: Changes in family structures and caregiving responsibilities emerge as the number of elderly individuals increases.
Addressing these challenges requires proactive planning, including reforms to pension systems, investment in long-term care, and the promotion of policies encouraging continued workforce participation among older individuals. Many developed nations are already grappling with the implications of an aging population, and effective strategies are critical for maintaining economic stability and social well-being.
Q 7. What are the different methods used to measure population density?
Population density measures the concentration of people within a specific area. Several methods are used:
- Arithmetic Density: This is the simplest measure, calculated by dividing the total population by the total land area. It provides a general overview but doesn’t account for variations in land use or population distribution within that area. For example, a country with a large amount of uninhabitable land will have a lower arithmetic density than a country of the same size with mostly habitable land.
- Physiological Density: This more refined measure considers only arable land (land suitable for farming). It’s calculated by dividing the total population by the area of arable land. This helps understand the pressure on resources and the carrying capacity of the land. Countries with high physiological density may face challenges related to food production and resource availability.
- Agricultural Density: This focuses on the relationship between agricultural workers and the area of arable land. It’s calculated by dividing the number of farmers by the area of arable land. High agricultural density might suggest less efficient farming techniques or a larger proportion of the population employed in agriculture.
Choosing the appropriate method depends on the specific research question and the type of insights sought. Each method offers a different perspective on how densely populated a region is, considering various factors impacting land use and human activity.
Q 8. Describe the relationship between population distribution and resource allocation.
Population distribution and resource allocation are intrinsically linked. Where people live directly impacts the demand and distribution of resources like water, food, healthcare, education, and infrastructure. A highly concentrated population in an urban area will require significantly more resources than a sparsely populated rural area. Effective resource allocation requires understanding population density, age structure, and geographic distribution to ensure equitable access and avoid shortages or oversupply.
Example: Consider a developing nation experiencing rapid urbanization. A sudden influx of people into cities can strain existing water and sanitation systems, leading to shortages and potential health crises. Informed resource allocation, based on accurate demographic data, would involve investing in expanding infrastructure to meet the increased demand.
Conversely, a region with an aging population might require greater investment in healthcare facilities and elderly care services, whereas a region with a high proportion of young people may need more schools and recreational facilities. Understanding these demographic nuances is key to making efficient and equitable resource allocation decisions.
Q 9. How can demographic data be used to inform public policy?
Demographic data is crucial for evidence-based public policy. It provides insights into population trends, allowing governments to anticipate future needs and challenges and create targeted interventions. For example:
- Healthcare planning: Understanding the age structure of a population helps determine the number of doctors, nurses, and hospital beds needed. An aging population requires greater investment in geriatric care.
- Education policy: Knowing the number of school-aged children allows for appropriate resource allocation to schools, teacher recruitment, and curriculum development.
- Urban planning: Population density data informs urban planning decisions regarding infrastructure development, transportation systems, and housing needs.
- Economic policy: Understanding workforce demographics (age, skill levels, etc.) informs policies related to labor markets, job creation, and social security systems.
- Environmental policy: Population distribution data helps in managing environmental resources and mitigating the effects of pollution and climate change.
In essence, demographic data helps governments make informed choices about how to allocate resources, create effective policies, and ultimately improve the well-being of their citizens.
Q 10. Explain the concept of dependency ratio.
The dependency ratio is a demographic indicator that expresses the ratio of dependents (people typically considered too young or too old to work – usually ages 0-14 and 65+) to the working-age population (usually ages 15-64). It’s calculated as:
(Population aged 0-14 + Population aged 65+) / Population aged 15-64
A high dependency ratio indicates that a relatively smaller proportion of the population is supporting a larger number of dependents, which can place a strain on social security systems, healthcare resources, and the overall economy. Conversely, a low dependency ratio suggests a more favorable situation where the working-age population can more easily support the dependent population.
Example: A country with a rapidly aging population will experience a rising dependency ratio, placing increasing pressure on pension systems and healthcare infrastructure. Conversely, a country with a high birth rate might also have a high dependency ratio due to a large youth population.
Q 11. What are some common biases in demographic data collection?
Several biases can affect the accuracy and reliability of demographic data collection. Some common ones include:
- Undercounting: Certain population subgroups (e.g., homeless individuals, undocumented immigrants) may be underrepresented in censuses or surveys.
- Sampling bias: If the sample used in a survey is not representative of the entire population, the results may be skewed.
- Measurement error: Inaccurate or inconsistent data collection methods can lead to errors in reported demographic information.
- Social desirability bias: Respondents may provide answers that they believe are socially acceptable, rather than accurate responses.
- Recall bias: Respondents may have difficulty accurately recalling past events, leading to inaccuracies in retrospective data.
Addressing these biases requires careful survey design, rigorous data collection techniques, and appropriate statistical adjustments to ensure the accuracy and reliability of the data.
Q 12. How can you analyze and interpret demographic trends?
Analyzing and interpreting demographic trends involves several steps:
- Data collection and cleaning: Gather data from reliable sources (e.g., censuses, vital registration systems, surveys) and clean the data to ensure accuracy and consistency.
- Data visualization: Create graphs, charts, and maps to visualize demographic trends (e.g., population pyramids, migration maps, fertility rate graphs).
- Statistical analysis: Use statistical methods (e.g., regression analysis, time series analysis) to identify patterns and relationships between demographic variables.
- Trend identification: Identify key demographic trends, such as population growth, aging, urbanization, migration patterns, and changes in fertility and mortality rates.
- Interpretation and forecasting: Interpret the trends in the context of social, economic, and environmental factors and use forecasting models to project future demographic scenarios.
- Scenario planning: Develop alternative scenarios based on different assumptions about future demographic trends and their potential impacts.
This multi-step process allows for a comprehensive understanding of demographic changes and their implications for policy and planning.
Q 13. Describe different forecasting models used in demography.
Several forecasting models are used in demography to project future population size, age structure, and other characteristics. These include:
- Component method: This is a widely used method that projects future population size by considering births, deaths, and migration. It involves projecting each component separately and then combining them to obtain the total population projection.
- Cohort-component method: This method projects the population of each age group separately, tracking their movement through the age structure over time, incorporating fertility, mortality, and migration rates.
- Stochastic models: These models incorporate randomness and uncertainty into population projections, acknowledging that demographic events are not perfectly predictable. They often use Monte Carlo simulations to generate a range of possible future scenarios.
- Mathematical models: These more complex models utilize mathematical equations to describe population dynamics, often considering factors like age-specific fertility and mortality rates, and migration patterns. They may incorporate feedback loops and other dynamic features.
The choice of model depends on the available data, the level of detail required, and the specific research question. Often, a combination of methods is employed to obtain more robust and reliable projections.
Q 14. What are the ethical considerations associated with demographic research?
Ethical considerations in demographic research are crucial. Researchers must ensure:
- Informed consent: Participants in surveys or studies should be fully informed about the purpose of the research, how their data will be used, and their right to withdraw at any time.
- Confidentiality and anonymity: Individual data should be protected and kept confidential. Anonymization techniques should be employed to prevent identification of participants.
- Data security: Robust security measures should be in place to protect demographic data from unauthorized access or misuse.
- Avoiding discrimination: Demographic research should not perpetuate or reinforce stereotypes or discrimination against particular groups.
- Responsible data use: Demographic data should be used responsibly and ethically, avoiding any potential for misuse or harm.
- Transparency and accountability: Research methods and findings should be transparently reported, and researchers should be accountable for the ethical conduct of their work.
Failing to adhere to these ethical principles can lead to significant harm, including the stigmatization of certain groups and the creation of biased policies. Ethical considerations are paramount to ensure that demographic research is conducted responsibly and benefits society as a whole.
Q 15. Explain the concept of migration and its impact on population structures.
Migration, the movement of people from one place to another, significantly impacts population structures. It alters the age and sex composition of both sending and receiving areas. For instance, large-scale emigration of young adults from a rural area can lead to an aging population left behind, while immigration of young working-age individuals to a city can boost its workforce and create a younger demographic profile. This movement also influences population density, impacting resource allocation and urban planning. Consider the impact of the ‘brain drain’ – the emigration of highly skilled individuals – on a nation’s economic development. This demonstrates how migration patterns aren’t just about numbers, but also about the skills and characteristics of the people moving.
The effect on population structures is multifaceted: Changes in birth rates and death rates in both origin and destination areas, altered dependency ratios (the ratio of dependents to working-age individuals), and shifts in ethnic and cultural diversity are all influenced by migration. Understanding these changes is crucial for effective policy-making, such as planning for infrastructure, healthcare, and education systems.
Career Expert Tips:
- Ace those interviews! Prepare effectively by reviewing the Top 50 Most Common Interview Questions on ResumeGemini.
- Navigate your job search with confidence! Explore a wide range of Career Tips on ResumeGemini. Learn about common challenges and recommendations to overcome them.
- Craft the perfect resume! Master the Art of Resume Writing with ResumeGemini’s guide. Showcase your unique qualifications and achievements effectively.
- Don’t miss out on holiday savings! Build your dream resume with ResumeGemini’s ATS optimized templates.
Q 16. How do demographic factors influence economic growth?
Demographic factors, including population size, age structure, and growth rate, significantly influence economic growth. A young and expanding workforce, for example, provides a larger pool of potential workers and consumers, fueling economic expansion. Countries with a large proportion of their population in the working-age group (typically 15-64 years) often experience higher economic growth rates than those with a rapidly aging population or a large youth dependency ratio. This is because a larger working-age population contributes more to the national output and pays more taxes.
Conversely, rapidly aging populations face challenges such as shrinking workforces, increased healthcare costs, and lower savings rates, potentially slowing economic growth. A high dependency ratio, where the proportion of dependents (children and elderly) is large relative to the working-age population, places a strain on the economy as a smaller workforce has to support a larger dependent population. The skill level of the workforce is also crucial: a highly skilled and educated population is more likely to drive innovation and productivity growth.
Q 17. Discuss the impact of urbanization on population health.
Urbanization, the increasing concentration of populations in urban areas, has a complex and often paradoxical impact on population health. While cities offer access to better healthcare facilities, employment opportunities, and education, they also present challenges. Overcrowding can lead to the spread of infectious diseases, while pollution from industrial activities and traffic congestion negatively affects respiratory health. Access to clean water and sanitation can be limited in rapidly growing urban areas, further impacting public health.
Furthermore, urbanization can lead to unhealthy lifestyles, with reduced physical activity due to car dependency and increased consumption of processed foods. Stress levels tend to be higher in urban environments, contributing to mental health issues. However, well-planned urban environments can mitigate some of these negative impacts by prioritizing green spaces, promoting active transportation, and ensuring equitable access to healthcare and essential services. For example, cities with robust public transportation systems and extensive parks tend to have healthier populations compared to those lacking such amenities.
Q 18. Explain the use of cohort analysis in demographic studies.
Cohort analysis is a powerful tool in demographic studies that involves tracking and analyzing a specific group of individuals (a cohort) over time. This group is typically defined by a shared characteristic, such as year of birth or a specific life event (e.g., individuals who graduated from college in 2000). By following a cohort’s experiences over their lifespan, demographers can gain insights into trends related to fertility, mortality, migration, marriage, education, and other life events.
For example, by comparing the fertility rates of different birth cohorts, we can observe changes in family size preferences over time and identify factors influencing these changes. Similarly, studying the mortality rates of a cohort can help understand the impact of diseases, lifestyle choices, and healthcare advancements on longevity. The data collected through cohort analysis are valuable for forecasting future population trends and designing targeted interventions in areas such as public health and social welfare planning.
Q 19. What are some of the challenges in collecting and analyzing demographic data in developing countries?
Collecting and analyzing demographic data in developing countries presents numerous challenges. These include:
- Lack of robust infrastructure: Inadequate registration systems for births, deaths, and marriages make it difficult to obtain accurate and complete data.
- Limited resources: Financial constraints and a shortage of trained personnel can hinder data collection efforts.
- Data quality issues: Inconsistent data collection methods, incomplete records, and potential biases in data reporting can compromise data accuracy.
- Security concerns: Data privacy and security can be challenging to ensure in areas with weak governance and limited technological infrastructure.
- Accessibility issues: Reaching remote and marginalized populations can be difficult, resulting in underrepresentation of these groups in the data.
Addressing these challenges requires significant investments in infrastructure, capacity building, and improved data collection methodologies. Innovative approaches such as using mobile technology for data collection and employing participatory methods can enhance data quality and coverage.
Q 20. How can demographic information be used for effective marketing strategies?
Demographic information is invaluable for developing effective marketing strategies. Understanding the age, gender, income, education, and location of a target market allows businesses to tailor their products, messages, and distribution channels to resonate better with specific consumer segments.
For example, a company launching a new skincare product might target young adults (18-35) through social media platforms, while a retirement community might advertise its services to older adults (65+) through print media or targeted online advertising. Understanding population density and growth patterns helps businesses determine where to locate stores or distribute products effectively. Analyzing demographic trends can also help businesses anticipate changes in consumer demand and adapt their strategies accordingly. Market research firms frequently utilize demographic data to segment markets and identify high-potential customer groups.
Q 21. What are the key assumptions underlying demographic projections?
Demographic projections rely on several key assumptions, the accuracy of which directly influences the reliability of the projections. These assumptions include:
- Assumptions about fertility rates: Projections depend on assumptions about future fertility rates. Changes in societal norms, access to contraception, and educational attainment can significantly influence fertility patterns.
- Assumptions about mortality rates: Advances in medical technology and improvements in public health can lead to increased life expectancy, impacting mortality rates and thus population projections.
- Assumptions about migration: Future migration patterns, both internal and international, are difficult to predict accurately. Economic conditions, political stability, and environmental factors can all influence migration flows.
- Assumptions about age-sex specific mortality and fertility: Projections need to account for variations in mortality and fertility across different age and sex groups.
It’s crucial to acknowledge the inherent uncertainties associated with demographic projections. Sensitivity analyses, which explore how projections change under different assumptions, are essential for understanding the range of possible future scenarios and the associated risks.
Q 22. Explain the difference between a population pyramid and a life table.
Population pyramids and life tables are both crucial tools in demography, but they visualize and analyze population data in different ways. A population pyramid is a visual representation of the age and sex structure of a population at a specific point in time. It’s a bar chart, with age groups on the vertical axis and population size on the horizontal axis, separated by sex. The shape of the pyramid reveals much about a population’s growth pattern – a wide base suggests rapid growth, while a narrow base indicates slow or declining growth.
A life table, on the other hand, is a statistical table that shows the probability of death at each age for a given population. It provides a detailed breakdown of mortality rates, life expectancy, and other key demographic indicators. Unlike the visual nature of a population pyramid, a life table presents data in a tabular format. It’s like a detailed account of what happens to a hypothetical cohort (group of individuals born at the same time) throughout their lives.
Think of it this way: the pyramid gives you a snapshot of the current population’s age and sex structure, while the life table gives you a detailed story of how long individuals in that population are likely to live and at what ages they are most at risk of death. Both are complementary tools, providing different, yet equally valuable, insights into population dynamics.
Q 23. Discuss the concept of population replacement level.
The population replacement level is the average number of children a woman needs to have in her lifetime to ensure that the population remains stable, neither growing nor shrinking. This level is generally considered to be around 2.1 children per woman. This isn’t exactly 2 because it accounts for child mortality; some children may not survive to reproductive age.
Factors like access to education, healthcare, and economic opportunities significantly influence fertility rates. For example, countries with high levels of female education and access to contraception often have fertility rates below the replacement level. Conversely, countries with limited access to these resources might have rates well above the replacement level. This concept is vital for understanding long-term population trends and planning for social security systems, healthcare provisions, and workforce needs.
Q 24. How can you use spatial analysis techniques in demographic research?
Spatial analysis techniques are indispensable in demographic research as they allow us to understand the geographical distribution of populations and the factors influencing that distribution. We can use Geographic Information Systems (GIS) to map population density, analyze spatial patterns of migration, and identify clusters of specific demographic characteristics.
For instance, we can use spatial autocorrelation analysis to determine if there is a relationship between the density of a population and the availability of resources (like hospitals, schools, or employment opportunities). Or, we can use spatial regression models to examine how factors such as proximity to urban areas or environmental conditions influence fertility rates. These techniques are particularly useful for identifying disparities across different geographical regions and formulating targeted interventions to address demographic challenges. Imagine analyzing the spatial distribution of elderly populations to plan for effective healthcare provision and social services in specific areas. This is a prime example of how spatial analysis can have a real-world impact.
Q 25. What are some current debates in the field of demography?
Current debates in demography are multifaceted and exciting. Some key areas include:
- The future of global population growth: While global fertility rates are declining, uncertainties remain about the pace of decline and the ultimate size of the global population. Different models and projections offer varying scenarios, leading to ongoing discussions.
- The impact of migration on population dynamics: Understanding the drivers of migration, its impact on both sending and receiving countries, and the integration of migrants into host societies are critical research areas. This includes debates about immigration policies and their effects on national populations.
- The implications of an aging population: Many countries face an increasingly aging population, leading to concerns about the economic sustainability of social security systems and healthcare provisions. Finding innovative solutions for supporting older adults is a significant area of debate.
- The interplay between environmental change and population dynamics: Climate change and resource scarcity can significantly influence population distribution, migration patterns, and even fertility rates. The complex interactions between these factors are actively being researched.
These debates highlight the dynamic and ever-evolving nature of demography and its crucial role in shaping policy and decision-making.
Q 26. Explain the impact of technological advancements on demographic trends.
Technological advancements have profoundly impacted demographic trends. For example:
- Improved healthcare: Advancements in medicine and healthcare have led to increased life expectancy and reduced infant and child mortality rates, significantly influencing population size and age structure.
- Contraception and reproductive technologies: The development and wider access to contraception have given individuals more control over their reproductive lives, leading to declining fertility rates in many parts of the world. Conversely, assisted reproductive technologies have enabled individuals to have children later in life or overcome infertility.
- Information and communication technologies (ICTs): ICTs have facilitated communication and migration, influencing population distribution and cultural exchange. Social media platforms, for instance, have played a role in shaping social norms and attitudes that influence reproductive behavior.
- Automation and technology in the workplace: Changes in the nature of work brought about by automation may have cascading effects on family formation, migration patterns, and the overall composition of a population.
Therefore, understanding the interplay between technology and demographic trends is crucial for policy-makers and researchers alike.
Q 27. How do environmental factors influence population dynamics?
Environmental factors play a crucial role in shaping population dynamics. Availability of resources like water and arable land directly influences population density and distribution. Areas with limited resources often have lower population densities, while fertile regions with abundant resources might support larger populations.
Moreover, environmental hazards like droughts, floods, and famines can lead to mortality, migration, and changes in fertility rates. Climate change presents a growing challenge, influencing patterns of migration and resource availability, impacting the livelihood security of vulnerable communities, and potentially leading to population displacement. Extreme weather events can also impact health and mortality rates.
For instance, desertification can lead to population displacement as agricultural lands become unproductive. Similarly, rising sea levels threaten coastal populations, forcing them to migrate inland. Understanding these environmental influences is essential for developing effective strategies for population management and resource allocation.
Q 28. Describe the application of demographic theories in urban planning.
Demographic theories are fundamental to effective urban planning. Understanding population size, age structure, growth rates, and migration patterns is crucial for making informed decisions about infrastructure development, resource allocation, and service provision.
For instance, knowledge of future population growth is essential for planning transportation systems, housing developments, and the provision of public services like schools and hospitals. Understanding the age structure of a population helps planners tailor services to the specific needs of different age groups. For example, an aging population might require more healthcare facilities and accessible transportation, while a young population may necessitate more schools and recreational facilities. Analyzing migration patterns aids in anticipating the spatial distribution of future populations, guiding the development of infrastructure in both urban and suburban areas.
Ultimately, effective urban planning necessitates incorporating a deep understanding of demographic projections and the factors driving population change. Ignoring these vital insights can lead to inefficient resource allocation, inadequate infrastructure, and ultimately, a decline in the quality of life for urban residents.
Key Topics to Learn for Knowledge of Demographic Theories Interview
- Demographic Transition Model: Understand its stages, limitations, and applications in predicting population change and resource allocation.
- Malthusian Theory: Analyze its core principles, critiques, and relevance to contemporary issues like resource scarcity and environmental sustainability. Consider its practical applications in policy analysis.
- Population Pyramids: Interpret and analyze their shape and implications for economic growth, healthcare planning, and social welfare programs. Practice interpreting data presented in this format.
- Fertility Rates and Mortality Rates: Explore the factors influencing these rates and their impact on population growth. Understand how these rates are calculated and interpreted.
- Migration Patterns and Theories: Analyze push and pull factors influencing migration, examining different theoretical frameworks for understanding migration flows and their societal impacts. Consider examples of both internal and international migration.
- Demographic Forecasting Methods: Familiarize yourself with various techniques used to project future population trends and their uncertainties. Discuss the limitations of each approach.
- Impact of Demographic Change on Social Systems: Analyze how demographic shifts affect areas such as healthcare, education, social security, and the labor market. Explore policy implications related to aging populations or rapid population growth.
- Data Analysis and Interpretation: Develop your skills in interpreting demographic data from various sources and using statistical methods to analyze trends and patterns.
Next Steps
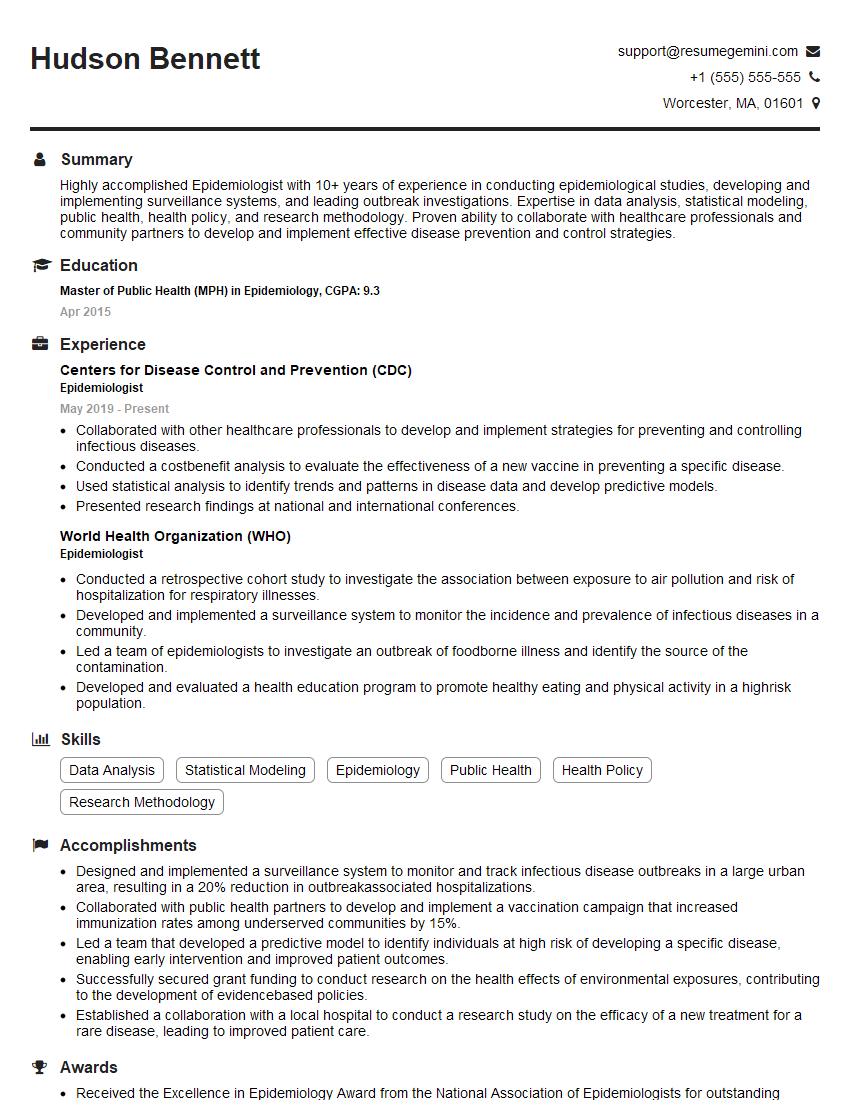
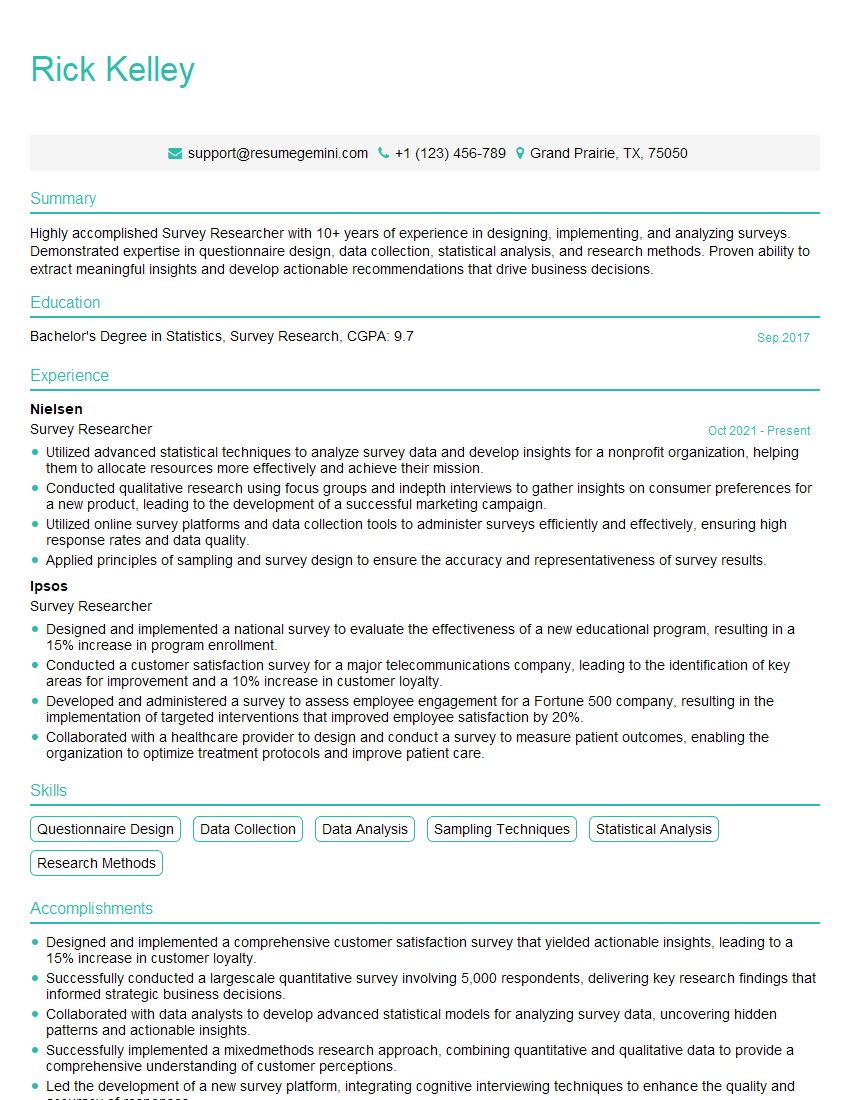
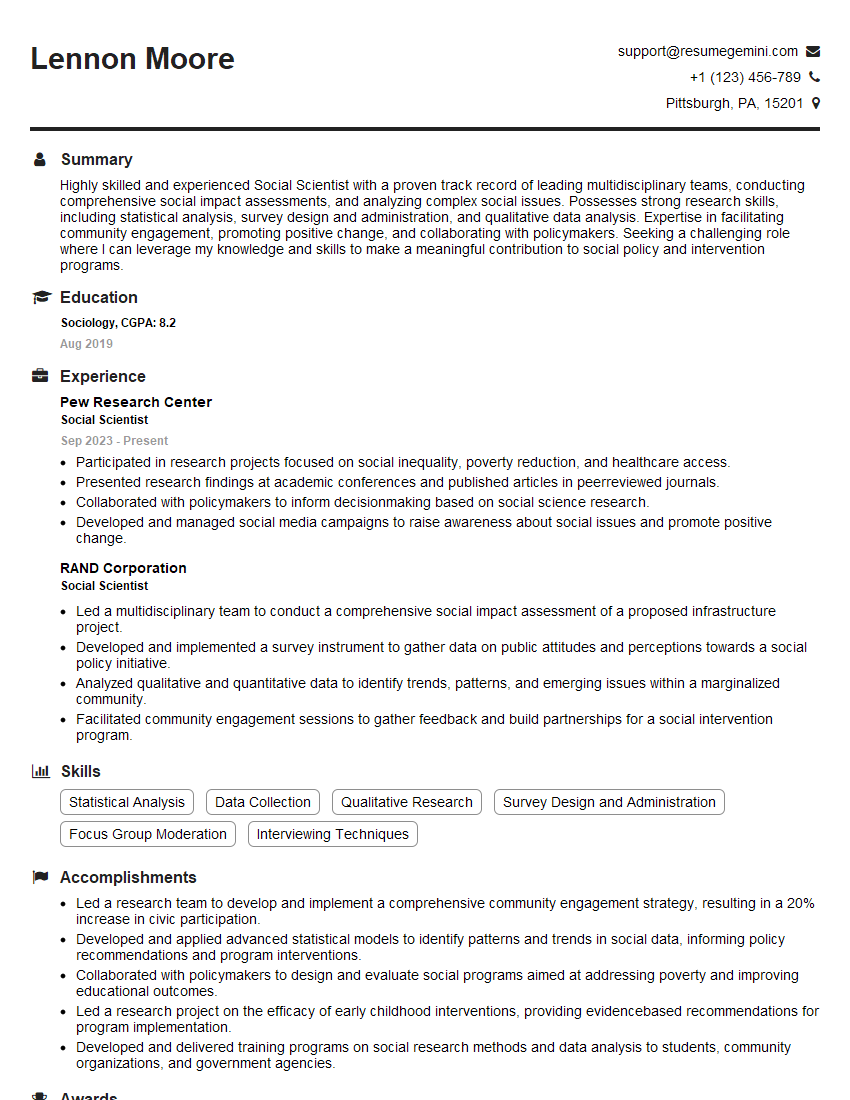
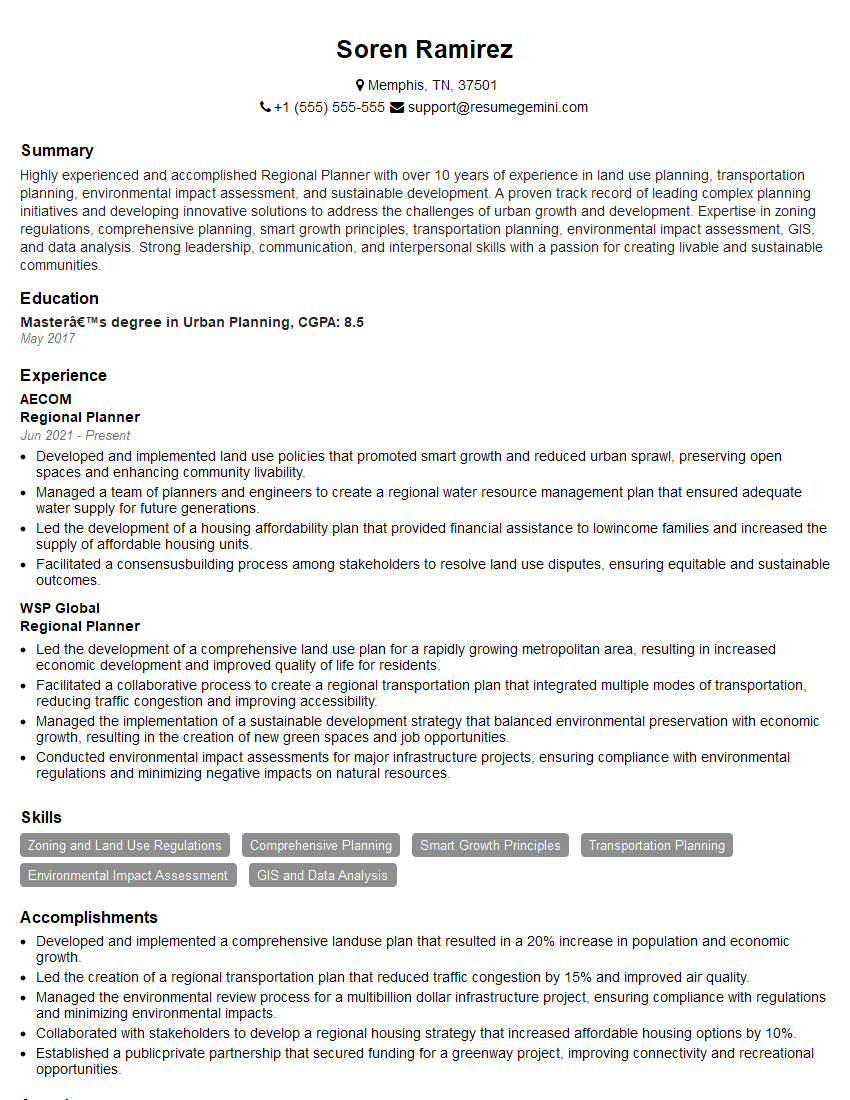
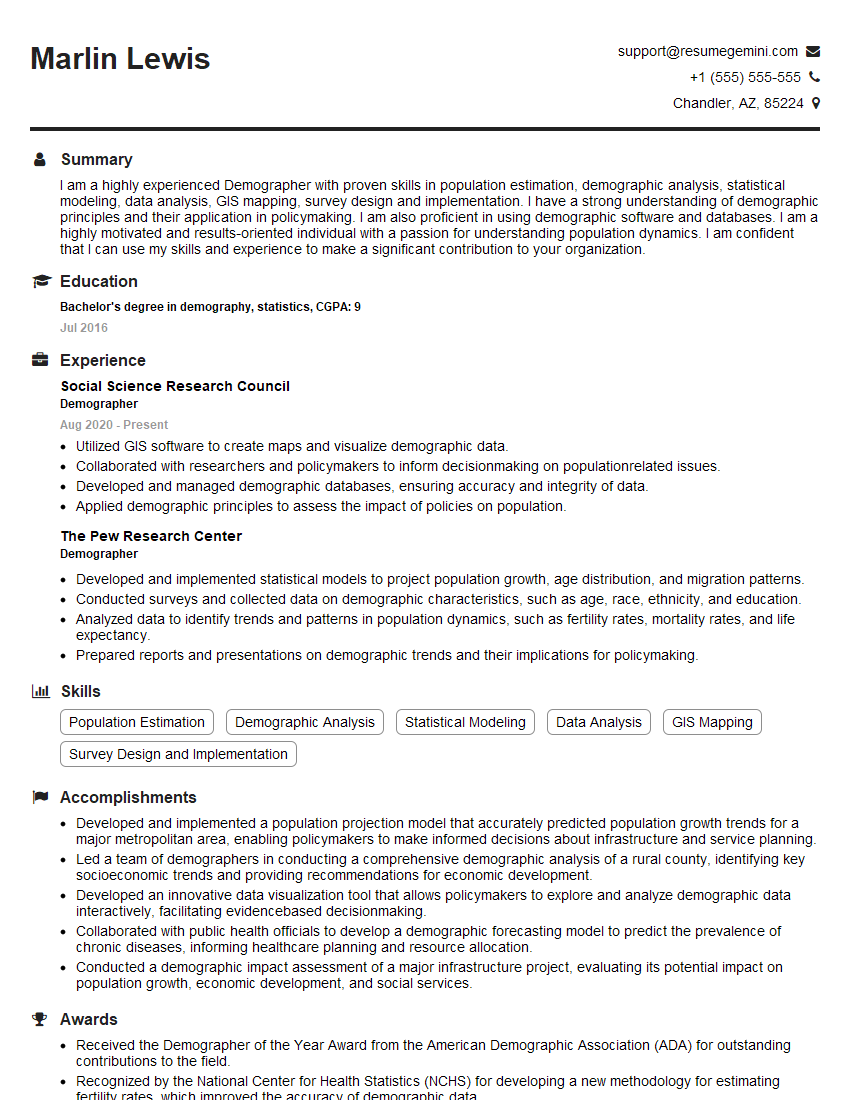
Mastering Knowledge of Demographic Theories is crucial for career advancement in fields like urban planning, public health, sociology, and economics. A strong understanding of these theories allows you to analyze complex societal challenges and propose data-driven solutions. To significantly enhance your job prospects, crafting an ATS-friendly resume is vital. ResumeGemini is a trusted resource that can help you build a professional resume showcasing your skills and experience effectively. Examples of resumes tailored to highlight expertise in Knowledge of Demographic Theories are available through ResumeGemini to help guide your creation.


Explore more articles
Users Rating of Our Blogs
Share Your Experience
We value your feedback! Please rate our content and share your thoughts (optional).
What Readers Say About Our Blog
To the interviewgemini.com Webmaster.
Very helpful and content specific questions to help prepare me for my interview!
Thank you
To the interviewgemini.com Webmaster.
This was kind of a unique content I found around the specialized skills. Very helpful questions and good detailed answers.
Very Helpful blog, thank you Interviewgemini team.