Every successful interview starts with knowing what to expect. In this blog, we’ll take you through the top Temperature Measurement and Analysis interview questions, breaking them down with expert tips to help you deliver impactful answers. Step into your next interview fully prepared and ready to succeed.
Questions Asked in Temperature Measurement and Analysis Interview
Q 1. Explain the different types of temperature sensors and their applications.
Temperature sensors are the backbone of accurate temperature measurement across diverse industries. They convert thermal energy into a measurable signal, typically voltage or resistance. Several types exist, each with unique characteristics and best-suited applications.
- Thermocouples: These are based on the Seebeck effect, generating a voltage proportional to the temperature difference between two dissimilar metals. They’re robust, inexpensive, and operate over a wide temperature range, making them ideal for high-temperature applications like furnaces and kilns. For example, in a steel mill, thermocouples monitor the temperature of molten steel during the refining process.
- Resistance Temperature Detectors (RTDs): RTDs utilize the principle that a material’s electrical resistance changes predictably with temperature. They offer high accuracy and stability, making them suitable for precision measurements in applications like calibration labs or scientific experiments. Imagine using an RTD in a cryogenic system where precise temperature control is vital for maintaining the sample’s integrity.
- Thermistors: These are semiconductor devices whose resistance changes significantly with temperature. They are highly sensitive to temperature changes, making them well-suited for applications requiring fast response times, such as medical thermometers or environmental monitoring systems. Think of a thermistor inside a weather station, quickly registering changes in ambient temperature.
- Infrared (IR) Thermometers: These non-contact sensors measure temperature by detecting the infrared radiation emitted by an object. They are widely used in industrial process monitoring, where touching the object is impossible or dangerous, such as measuring the temperature of a moving conveyor belt.
- Liquid-in-Glass Thermometers: These traditional devices rely on the thermal expansion of a liquid (usually mercury or alcohol) within a glass tube. Though simple, they are limited in accuracy and often lack the range and responsiveness of electronic sensors. They remain useful for basic temperature monitoring where high accuracy isn’t crucial.
Q 2. Describe the principles of thermocouple operation.
Thermocouples operate on the Seebeck effect. When two dissimilar metals are joined to form a junction, a voltage is generated that is directly proportional to the temperature difference between that junction (the measurement junction) and a reference junction (held at a known temperature). This voltage is the electromotive force (EMF) and is unique to the type of thermocouple used (e.g., Type K, Type J, Type T).
Imagine two different metal wires twisted together. When you heat the junction where they are twisted, electrons flow from the hotter to the colder metal, creating a measurable voltage difference. The magnitude of this voltage is directly related to the temperature difference and calibrated using established tables or equations specific to each thermocouple type. The reference junction’s temperature needs to be precisely known, often achieved using an ice bath or a temperature-compensated circuit.
Q 3. What are the advantages and disadvantages of RTDs compared to thermocouples?
Both RTDs and thermocouples are widely used temperature sensors, but they have different strengths and weaknesses.
- RTDs (Advantages): Higher accuracy and precision than thermocouples, better long-term stability, linear response over a wide temperature range, and readily available in various configurations.
- RTDs (Disadvantages): Generally more expensive than thermocouples, slower response time, require more complex signal conditioning circuitry, and are less durable in harsh environments.
- Thermocouples (Advantages): Lower cost, fast response time, robust and durable, wide temperature range, simple to use, and suitable for harsh environments.
- Thermocouples (Disadvantages): Lower accuracy and stability compared to RTDs, non-linear output requiring complex calibration, and susceptible to electromagnetic interference.
Choosing between an RTD and a thermocouple depends on the specific application. If high accuracy and stability are paramount, an RTD is preferred. If cost, speed, and ruggedness are primary concerns, a thermocouple might be the better option. For example, a high-precision industrial oven might employ RTDs, whereas a rapid-response process control system might benefit from a thermocouple.
Q 4. How does a thermistor work, and what are its limitations?
Thermistors are semiconductor devices that exhibit a large change in resistance with a relatively small change in temperature. This change is primarily due to the change in the number of charge carriers available for conduction as temperature varies. They typically have a negative temperature coefficient (NTC), meaning their resistance decreases as temperature increases. The relationship between resistance and temperature is non-linear and described by the Steinhart-Hart equation, which requires specific material constants for accurate temperature calculation.
Limitations: Self-heating can be a significant problem, especially at low currents and high ambient temperatures. Their sensitivity is highly temperature-dependent, which can affect accuracy. The resistance vs. temperature characteristic is highly non-linear, requiring more complex calibration and compensation. They also have a limited temperature range compared to thermocouples or RTDs.
Q 5. Explain the concept of temperature calibration and its importance.
Temperature calibration is the process of comparing the output of a temperature sensor against a known standard to ensure accuracy. This is critical for reliable and trustworthy temperature data. A sensor might drift over time due to aging, wear, or environmental factors, resulting in inaccurate readings. Calibration involves comparing the sensor’s output to a traceable standard, such as a calibrated thermometer or a platinum resistance thermometer (PRT), and adjusting the sensor’s output or creating a correction curve to compensate for any discrepancies. This ensures measurements are repeatable and reliable, avoiding costly errors and misinterpretations in the data.
Imagine a pharmaceutical company relying on accurate temperature monitoring to preserve the integrity of their products. Regular calibration is essential to ensure that the temperature readings are accurate and reliable, preventing potential product degradation and ensuring patient safety.
Q 6. What are the common sources of error in temperature measurement?
Several sources can introduce errors in temperature measurement:
- Sensor inaccuracies: inherent limitations in the sensor’s design and manufacturing process.
- Calibration errors: inaccuracies in the calibration process itself.
- Environmental factors: ambient temperature changes, drafts, radiation, and electromagnetic interference (EMI).
- Lead wire effects: temperature gradients along the connecting wires can affect the reading, particularly with thermocouples and RTDs.
- Self-heating effects: the sensor itself generating heat, which affects the reading, especially with thermistors.
- Installation errors: improper sensor mounting or inadequate thermal contact between the sensor and the measured object.
- Signal conditioning issues: errors in amplification, filtering, or analog-to-digital conversion of the sensor signal.
Understanding these potential error sources is critical for minimizing errors in temperature measurements. Proper sensor selection, careful calibration, and appropriate signal conditioning techniques are essential to mitigate these effects.
Q 7. How do you compensate for thermal drift in temperature measurements?
Thermal drift refers to the gradual change in a sensor’s output over time due to temperature changes within the sensor itself, as opposed to the actual temperature of the object under measurement. This can cause a systematic error in the readings. Several techniques are used to compensate for thermal drift:
- Temperature compensation circuits: These circuits monitor the sensor’s internal temperature and adjust the output signal accordingly, effectively canceling out the drift. These circuits use additional sensors to monitor the internal temperature of the sensor itself.
- Three-wire or four-wire RTD configurations: In these configurations, extra wires are used to compensate for the resistance of the lead wires, minimizing the effect of temperature gradients along the lead wires.
- Software compensation: The drift can be compensated for using software algorithms. Calibration data can be used to establish a correction curve, which is applied to the raw sensor data to correct for the drift. The software adjusts the readings based on a model of the drift behavior.
- Sensor selection: Choosing a sensor with a low thermal drift coefficient is crucial for minimizing the impact of drift.
The best compensation method depends on the application’s requirements and the type of sensor used. A combination of techniques may be necessary to achieve high accuracy in the presence of thermal drift.
Q 8. Describe different methods for data acquisition and logging of temperature data.
Data acquisition and logging in temperature measurement involve capturing temperature readings from sensors and storing them for later analysis. This process can be remarkably simple or incredibly sophisticated, depending on the application.
Data Loggers: These standalone devices directly connect to temperature sensors, record readings at specified intervals, and often store data on internal memory (sometimes with SD card expansion). They’re great for straightforward applications like monitoring a refrigerator’s temperature or a building’s environmental conditions. Many offer features like alarms for exceeding temperature thresholds.
Computer-Based Systems: More complex setups use data acquisition (DAQ) cards plugged into a computer. These cards handle signal conditioning and analog-to-digital conversion, transferring the digitized temperature readings to software for logging and analysis. This approach allows for greater flexibility, more complex data processing, and real-time monitoring and control. LabVIEW or similar software is often employed.
Wireless Sensor Networks (WSNs): These networks use numerous wireless sensors, each transmitting data to a central hub. This is particularly useful for large-scale monitoring, such as environmental monitoring across a vast area or temperature profiles in a large industrial plant. The key advantage here is accessibility and reduced wiring complexity.
Cloud-Based Systems: The readings from sensors (whether wired or wireless) can be transmitted to the cloud for storage, analysis, and remote access. This approach offers scalable storage, sophisticated data analysis capabilities, and anytime, anywhere access to the data. This is increasingly common in industrial IoT (IIoT) applications.
The choice of method depends heavily on factors like the number of sensors, required accuracy, budget, and need for real-time analysis.
Q 9. How do you select the appropriate temperature sensor for a given application?
Selecting the right temperature sensor is crucial for accurate and reliable measurements. The choice depends on several factors, including the temperature range, required accuracy, response time, environmental conditions, and budget.
Thermocouples: These are robust and suitable for a wide temperature range (-200°C to +1800°C), making them ideal for high-temperature applications like furnaces or ovens. However, they’re less accurate than some other types.
Resistance Temperature Detectors (RTDs): RTDs offer high accuracy and stability, making them suitable for precise measurements in calibration labs or industrial processes. Platinum RTDs (Pt100) are commonly used due to their excellent linearity and stability.
Thermistors: These are less expensive and exhibit high sensitivity over a smaller temperature range. Their sensitivity makes them a great choice for applications requiring the detection of small temperature changes, like in medical devices or environmental monitoring.
Infrared (IR) Thermometers: Non-contact measurement is possible with IR sensors, ideal for measuring the temperature of moving objects or hazardous environments. However, emissivity adjustments are needed for accurate readings.
For example, if you’re measuring the temperature of a high-speed process, a fast-response thermocouple might be preferred. If you need highly accurate measurements in a stable environment, an RTD would be a better choice. A thorough understanding of the application requirements is fundamental.
Q 10. Explain the importance of proper sensor placement and mounting.
Proper sensor placement and mounting are critical for obtaining accurate and representative temperature readings. Incorrect placement can lead to significant errors and misinterpretations of the data.
Environmental Factors: Sensors should be shielded from direct sunlight, drafts, and other sources of heat or cold that could affect the measurement. Think of placing a thermometer in direct sunlight – it will read higher than the actual ambient temperature.
Thermal Mass: The sensor’s physical characteristics and mounting method influence the response time. A large sensor with poor thermal contact to its surroundings will take longer to reach thermal equilibrium with the measured medium. Consider using thermal paste or appropriate mounting hardware to improve contact.
Location: The location should be representative of the temperature you want to measure. For example, measuring the temperature of a fluid in a pipe requires proper insertion to avoid wall effects or stagnant zones.
Sensor Stability: Make sure that the mounting method ensures the sensor is stable and doesn’t move during the measurement. Vibration can create false readings.
Imagine measuring the temperature inside an oven. If you place the sensor against the oven’s wall, it will read much higher than the actual temperature inside the baking chamber.
Q 11. What is the difference between accuracy and precision in temperature measurement?
Accuracy and precision are crucial aspects of measurement quality but are distinct concepts.
Accuracy refers to how close a measured value is to the true or accepted value. A highly accurate measurement will be very near the actual temperature. Think of it as hitting the bullseye on a target.
Precision refers to how close repeated measurements of the same quantity are to each other. High precision means measurements are consistent, even if they’re not necessarily close to the true value. This is like consistently hitting the same spot on the target, but maybe not the bullseye.
A thermometer can be precise (giving consistent readings) but inaccurate (readings are consistently off by a few degrees). Ideally, we want both high accuracy and high precision.
Q 12. How do you interpret a temperature calibration certificate?
A temperature calibration certificate provides documented evidence of a sensor’s accuracy. It’s essential for ensuring reliable measurements, particularly in regulated industries.
The certificate usually includes:
Sensor Identification: A unique identifier for the specific sensor that was calibrated.
Calibration Date: The date when the calibration was performed.
Calibration Method: The procedure used for calibration, typically referencing a traceable standard.
Calibration Points: The temperatures at which the sensor was tested, usually covering its operational range.
Measured Values: The readings obtained from the sensor at each calibration point.
Uncertainty: The range of possible error associated with each measurement.
Calibration Laboratory Accreditation: Information on the accreditations and certifications of the lab that performed the calibration.
By reviewing this information, you can determine the sensor’s accuracy and suitability for the intended application. Out-of-specification readings indicate a need for recalibration or sensor replacement.
Q 13. Describe the concept of temperature uniformity and its measurement.
Temperature uniformity refers to the consistency of temperature across a specified area or volume. In industrial processes like ovens or incubators, maintaining uniform temperature is crucial for consistent product quality.
Measurement typically involves:
Mapping: Multiple temperature sensors are strategically placed throughout the area of interest. The readings are recorded simultaneously to create a temperature map.
Data Analysis: Statistical analysis is used to determine the degree of uniformity, often expressed as the standard deviation or maximum temperature difference across the mapped area.
Uniformity Standards: Specific uniformity standards (for example, +/- 1°C across a given area) might be established based on process requirements.
For example, in semiconductor manufacturing, maintaining precise temperature uniformity during wafer processing is critical. A non-uniform temperature profile can lead to defects in the final product.
Q 14. What are the common methods for temperature control in industrial processes?
Industrial processes often require precise temperature control to ensure product quality, safety, and efficiency.
Heating and Cooling Systems: These systems employ various technologies, including electric heaters, steam heating, gas burners, and refrigeration cycles. They’re controlled through feedback loops that constantly adjust the heating or cooling power based on the measured temperature.
PID Controllers: Proportional-Integral-Derivative (PID) controllers are widely used to maintain a desired temperature. They continuously adjust the heating or cooling elements based on the difference between the set point (desired temperature) and the measured temperature.
Heat Exchangers: These devices transfer heat between two fluids, allowing for efficient heating or cooling of processes. They are often used in conjunction with other control systems.
Insulation: Proper insulation minimizes heat loss or gain, simplifying temperature control and energy efficiency.
Fluid Circulation: Mixing or circulating the process fluid helps to ensure uniform temperature distribution. This is particularly important in larger containers or reactors.
For instance, in a chemical reactor, a PID controller might be used in conjunction with a heat exchanger and an electric heater to maintain a precise reaction temperature.
Q 15. Explain the principles of PID control for temperature regulation.
PID control, or Proportional-Integral-Derivative control, is a widely used feedback control loop mechanism employed in temperature regulation. Imagine it as a thermostat on steroids. It aims to maintain a desired temperature (setpoint) by constantly adjusting a heating or cooling element.
Proportional (P): This component responds directly to the error—the difference between the setpoint and the current temperature. A larger error results in a stronger corrective action. Think of it as a quick reaction to temperature changes.
Integral (I): This component addresses persistent errors. If the temperature consistently drifts, the integral term builds up over time, providing a sustained corrective action until the error is eliminated. This corrects slow drifts or offsets.
Derivative (D): This component anticipates future temperature changes based on the rate of change of the error. It dampens rapid oscillations, preventing overshoot and ensuring smoother temperature control. Imagine it as predicting how the temperature will change next.
Example: In an industrial oven, a PID controller monitors the oven’s temperature. If the temperature falls below the setpoint, the controller increases the heating element’s power proportionally to the error. The integral component addresses any slow drift, while the derivative component prevents overshooting the setpoint by anticipating the temperature’s rise.
Career Expert Tips:
- Ace those interviews! Prepare effectively by reviewing the Top 50 Most Common Interview Questions on ResumeGemini.
- Navigate your job search with confidence! Explore a wide range of Career Tips on ResumeGemini. Learn about common challenges and recommendations to overcome them.
- Craft the perfect resume! Master the Art of Resume Writing with ResumeGemini’s guide. Showcase your unique qualifications and achievements effectively.
- Don’t miss out on holiday savings! Build your dream resume with ResumeGemini’s ATS optimized templates.
Q 16. How do you troubleshoot a faulty temperature sensor?
Troubleshooting a faulty temperature sensor involves a systematic approach. First, I’d visually inspect the sensor for any physical damage—broken wires, loose connections, or contamination. Then, I’d check the sensor’s calibration against a known accurate standard, like a calibrated thermometer or reference bath.
Next, I’d examine the sensor’s output signal using a multimeter or data acquisition system. A faulty sensor might exhibit an erratic signal, a consistently incorrect reading, or no output at all. If the sensor is part of a larger system, I would then check the signal integrity from the sensor to the readout device. Look for signal degradation or noise along the cable.
Lastly, consider the sensor’s operating range. If the temperature is outside the sensor’s specified range, an inaccurate reading may result. Sensor failure could also be due to long-term drift or environmental factors such as vibration, shock or corrosion. Document all observations and test results.
Q 17. Describe different methods for temperature data analysis and interpretation.
Temperature data analysis often employs statistical methods to identify trends, patterns, and anomalies. Simple techniques include calculating averages, standard deviations, and ranges to summarize the data. More advanced methods involve time-series analysis to spot trends and periodic patterns.
Data Visualization: Graphs are crucial. Line graphs display temperature changes over time, while histograms show the distribution of temperature readings. Scatter plots can reveal relationships between temperature and other variables.
Statistical Process Control (SPC): In industrial settings, SPC charts (e.g., control charts) monitor temperature variation and identify potential causes of out-of-control conditions. This allows for preventative maintenance.
Regression analysis: Used to establish relationships between temperature and other variables, allowing us to create predictive models.
Example: In a climate study, regression analysis could show the relationship between greenhouse gas concentrations and average global temperatures.
Q 18. Explain the concept of thermal conductivity and its relevance to temperature measurement.
Thermal conductivity is a material’s ability to conduct heat. It’s a critical factor in temperature measurement because it dictates how quickly heat transfers through a material, impacting the accuracy and response time of the sensor. A sensor embedded in a material with high thermal conductivity will quickly reach thermal equilibrium with the surroundings, providing fast and accurate readings. Conversely, a material with low thermal conductivity will lead to slower response times and potential inaccuracies.
Relevance to Temperature Measurement: The choice of sensor material and its contact with the measured substance directly influences the accuracy of the temperature reading. For instance, a thermocouple used to measure the temperature of a high-conductivity metal will respond faster than when used on a low-conductivity material like wood. The sensor’s design must account for thermal conductivity to ensure accurate and reliable readings.
Example: In cryogenics, where temperature gradients are significant, sensors with high thermal conductivity are used to minimize temperature lag and achieve rapid and accurate temperature measurements.
Q 19. What is thermal shock, and how does it affect temperature sensors?
Thermal shock is the rapid change in temperature that a material experiences, causing significant stress and potential damage. This is particularly relevant for temperature sensors, as it can lead to sensor failure, reduced accuracy, or even breakage.
Effects on Temperature Sensors: Thermal shock can cause cracks or other structural damage within the sensor itself, especially if the sensor material has a low thermal shock resistance. Repeated thermal shock cycles can lead to sensor drift – a slow change in calibration over time – and ultimately sensor failure. The type of sensor used also impacts its susceptibility to thermal shock.
Example: A temperature sensor used in a metal-casting process where molten metal is frequently poured is subject to significant thermal shock. Sensors with rugged construction and materials capable of withstanding these rapid temperature changes are required. This often includes sensors with robust housing and thermally-matched components.
Q 20. How do you ensure the accuracy and reliability of temperature measurements in harsh environments?
Ensuring accurate and reliable temperature measurements in harsh environments demands careful sensor selection and system design. Factors to consider include the temperature range, pressure, humidity, vibration, and presence of corrosive or electrically conductive materials. Robust sensors with appropriate enclosures are essential. Calibration and verification against traceable standards are critical, especially in regulated industries.
Techniques: Using sensors with high thermal shock resistance and corrosion resistance materials is crucial. Shielding and enclosures are needed to protect sensors from physical damage, external interference and environmental factors. Regular calibration and maintenance are also vital to maintain accuracy.
Example: Temperature measurements in oil wells require sensors capable of withstanding high pressures and temperatures. These sensors are often made from specialized materials, and their signal transmission may require redundant circuitry or robust fiber optics for reliable data acquisition.
Q 21. Describe your experience with different temperature measurement software and data analysis tools.
Throughout my career, I’ve used several temperature measurement software and data analysis tools. These include LabVIEW for data acquisition and custom application development, providing flexible interfaces and data processing capabilities. I’ve also extensively used commercially available data logging software, like Omega’s data acquisition software or similar offerings from National Instruments, that allow for data collection from various sensor types and data visualization.
For data analysis, I frequently utilize statistical packages like R and Python with libraries such as Pandas and SciPy. These provide powerful tools for data manipulation, statistical analysis, and the generation of insightful visualizations. Furthermore, my experience includes using specialized software for specific applications such as process control systems, often integrated with SCADA systems, for real-time monitoring and data logging. Selecting the right tools depends heavily on the specific application and data volume.
Q 22. Explain the different types of temperature scales and their conversions.
Temperature scales are systems used to quantify the degree of hotness or coldness of an object or environment. The three most common scales are Celsius (°C), Fahrenheit (°F), and Kelvin (K).
- Celsius (°C): Based on the freezing and boiling points of water at standard atmospheric pressure (0°C and 100°C, respectively). Widely used globally.
- Fahrenheit (°F): Primarily used in the United States. Water freezes at 32°F and boils at 212°F.
- Kelvin (K): The absolute temperature scale, where 0 K represents absolute zero – the theoretical point where all molecular motion ceases. Used extensively in scientific applications.
Conversions between these scales are crucial for accurate data interpretation and comparison. Here are the formulas:
- Celsius to Fahrenheit: °F = (°C × 9/5) + 32
- Fahrenheit to Celsius: °C = (°F – 32) × 5/9
- Celsius to Kelvin: K = °C + 273.15
- Kelvin to Celsius: °C = K – 273.15
For instance, converting 25°C to Fahrenheit: °F = (25 × 9/5) + 32 = 77°F. Understanding these conversions is fundamental for accurate temperature data analysis and avoids misinterpretations.
Q 23. What are the safety precautions associated with handling temperature measurement equipment?
Safety is paramount when handling temperature measurement equipment. Precautions vary depending on the type of equipment and the application but generally include:
- Proper Handling: Avoid dropping or impacting temperature sensors, as this can damage the sensitive elements within.
- Protective Gear: High-temperature applications might require heat-resistant gloves and protective eyewear to prevent burns.
- Calibration and Maintenance: Regular calibration ensures accuracy, preventing potential errors that could lead to safety hazards (e.g., overheating in industrial processes).
- Electrical Safety: When using electrical temperature sensors, ensure proper grounding and insulation to prevent electrical shocks.
- Hazardous Materials: Be aware of any hazardous materials involved in the temperature measurement process (e.g., cryogenic liquids) and adhere to appropriate safety protocols.
- Environmental Considerations: Be mindful of the environment. For example, when measuring temperatures in confined spaces, ensure adequate ventilation to avoid exposure to hazardous fumes.
In my experience, a proactive approach to safety, including regular safety training and adherence to established safety procedures, is crucial to preventing accidents.
Q 24. How do you maintain and calibrate temperature sensors to ensure accuracy?
Maintaining and calibrating temperature sensors is critical for ensuring accurate measurements. This process usually involves:
- Regular Cleaning: Sensors should be cleaned regularly to remove dust, debris, and other contaminants that can affect readings. The cleaning method depends on the sensor type and material.
- Calibration: Calibration involves comparing the sensor’s readings against a known standard (e.g., a traceable calibration bath). This process identifies any offsets or drifts and allows for adjustments to be made.
- Storage: Proper storage helps prolong the sensor’s lifespan and accuracy. This often includes protecting the sensor from physical damage and extreme temperatures.
- Documentation: Keeping detailed records of calibration procedures, including dates, results, and any corrective actions, is essential for quality control and traceability.
For example, in a pharmaceutical setting, improper calibration could lead to medication spoilage or inaccurate drug dosages. A well-maintained calibration schedule and meticulous record-keeping are crucial for regulatory compliance and patient safety.
Q 25. Describe your experience with different types of temperature data acquisition systems.
I have extensive experience with various temperature data acquisition systems (DAS), including:
- Standalone Data Loggers: These are self-contained units that measure and store temperature data, often used for simple applications like monitoring storage conditions.
- Computer-Based Systems: These systems use data acquisition cards or interfaces to connect sensors to a computer for data logging and analysis, providing more complex data processing capabilities.
- SCADA (Supervisory Control and Data Acquisition) Systems: Used in larger industrial processes, SCADA systems monitor and control various parameters, including temperature, across an extensive network of sensors and actuators.
- Wireless Sensor Networks (WSNs): These systems use wireless communication to transmit temperature data from multiple sensors to a central location, providing flexibility in deployment and monitoring.
In one project, we used a SCADA system to monitor temperature across a large chemical plant. The system’s real-time data visualization and alarming capabilities were crucial for ensuring optimal process conditions and preventing potential safety hazards.
Q 26. Explain the difference between contact and non-contact temperature measurement methods.
The key difference between contact and non-contact temperature measurement lies in how the temperature is sensed:
- Contact Methods: These methods involve direct physical contact between the sensor and the object being measured. Examples include thermocouples, resistance temperature detectors (RTDs), and thermistors. They generally provide high accuracy but can affect the object’s temperature and are not suitable for moving objects or high-temperature applications that may damage the sensor.
- Non-Contact Methods: These methods measure temperature without physical contact. Examples include infrared (IR) thermometers and pyrometers. They are ideal for high-temperature applications, moving objects, and situations where physical contact is impossible or undesirable. However, they can be affected by surface emissivity and ambient conditions.
Choosing between contact and non-contact methods depends on the specific application. For example, measuring the temperature of a flowing liquid might require a contact method like an RTD, while determining the temperature of a furnace might necessitate a non-contact method like a pyrometer.
Q 27. How would you design a temperature monitoring system for a specific industrial process?
Designing a temperature monitoring system for a specific industrial process involves a structured approach:
- Process Understanding: Thorough understanding of the process, including temperature ranges, critical points, and potential hazards.
- Sensor Selection: Choosing appropriate sensors based on temperature range, accuracy requirements, response time, and environmental conditions. Consider factors such as sensor material compatibility and chemical resistance.
- Sensor Placement: Strategic placement of sensors to accurately capture the temperature profile of the process. This requires considering factors such as heat transfer, potential dead zones, and accessibility for maintenance.
- Data Acquisition System: Selection of a data acquisition system capable of handling the required number of sensors, data logging rate, and communication protocols. This includes data storage and analysis capabilities.
- Alarm and Control Systems: Implementing alarm systems to alert operators to deviations from setpoints and integrating the system with process control systems where appropriate.
- Data Analysis and Reporting: Development of procedures for data analysis, trend identification, and report generation to support process optimization and troubleshooting.
For example, designing a system for a food processing plant requires compliance with stringent food safety regulations, necessitating specific sensor selection, cleaning procedures, and data logging practices.
Q 28. Discuss your experience with troubleshooting and resolving temperature measurement issues in a production environment.
Troubleshooting temperature measurement issues requires a systematic approach:
- Identify the Problem: Clearly define the issue—inaccurate readings, sensor failure, or system malfunction.
- Data Review: Examine historical data to identify trends and potential causes.
- Sensor Verification: Check the sensor’s calibration and condition. Look for physical damage or contamination.
- Wiring and Connections: Inspect wiring and connections for faults, breaks, or loose contacts.
- System Diagnostics: Utilize the system’s built-in diagnostic tools or perform checks to identify hardware or software issues.
- Environmental Factors: Consider environmental factors such as ambient temperature, drafts, and electromagnetic interference.
In one instance, a production line experienced inconsistent temperature readings. After thorough investigation, we identified a loose connection in the wiring harness, which was causing intermittent signals. Replacing the connector resolved the issue.
Key Topics to Learn for Temperature Measurement and Analysis Interview
- Thermometry Fundamentals: Understanding different temperature scales (Celsius, Fahrenheit, Kelvin), their conversions, and the principles behind various thermometric methods.
- Temperature Sensors and Transducers: Explore the working principles, applications, and limitations of various sensors like thermocouples, RTDs, thermistors, and infrared thermometers. Consider calibration techniques and accuracy.
- Data Acquisition and Signal Conditioning: Learn about signal amplification, filtering, and analog-to-digital conversion (ADC) techniques used in temperature measurement systems. Understand the importance of noise reduction and data integrity.
- Calibration and Uncertainty Analysis: Master the methods for calibrating temperature sensors and understanding the sources of measurement uncertainty. Be prepared to discuss error propagation and its impact on results.
- Practical Applications: Discuss real-world applications of temperature measurement and analysis in various industries, such as process control, environmental monitoring, medical diagnostics, and materials science. Prepare examples from your experience.
- Data Analysis and Interpretation: Familiarize yourself with statistical methods for analyzing temperature data, including identifying trends, anomalies, and potential sources of error. Practice interpreting graphical representations of temperature data.
- Troubleshooting and Problem Solving: Be ready to discuss common problems encountered in temperature measurement systems and how to troubleshoot and resolve them. Consider sensor failure, signal noise, and calibration issues.
- Advanced Topics (Optional): Depending on the role, you might explore advanced concepts like thermal imaging, heat transfer calculations, or specific software packages used in temperature data analysis.
Next Steps
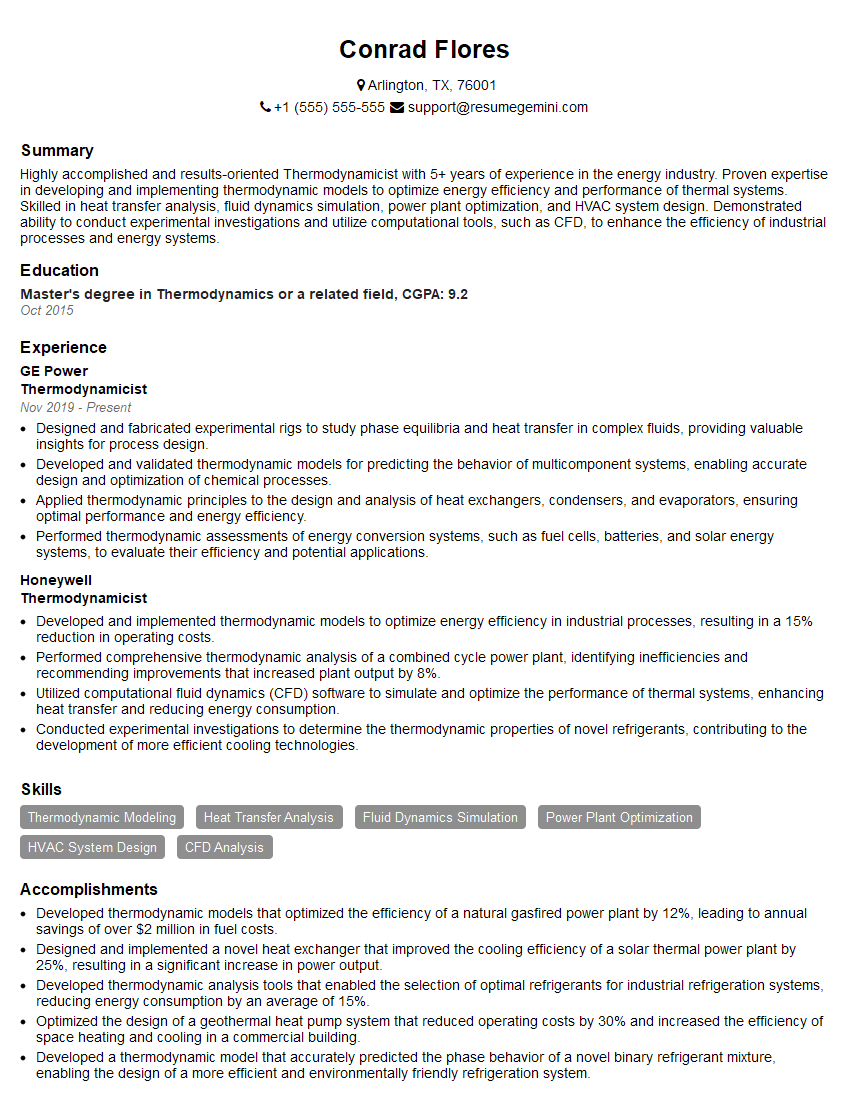
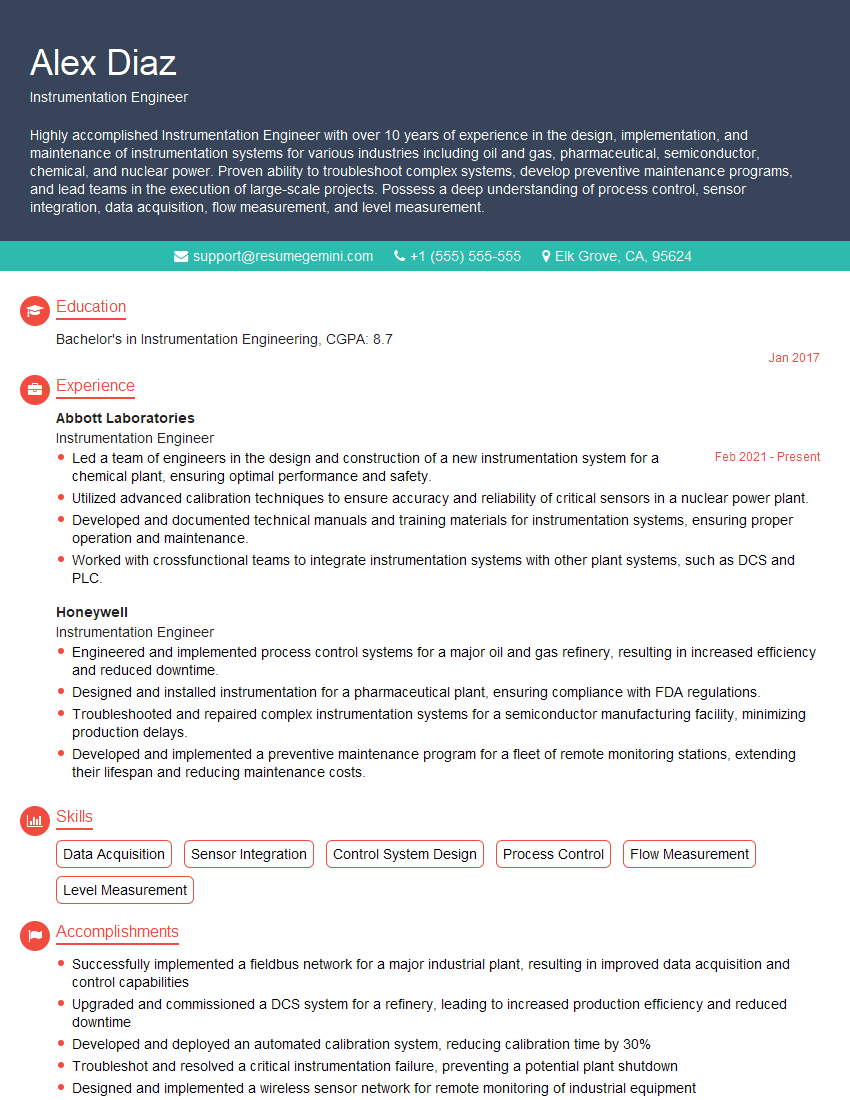
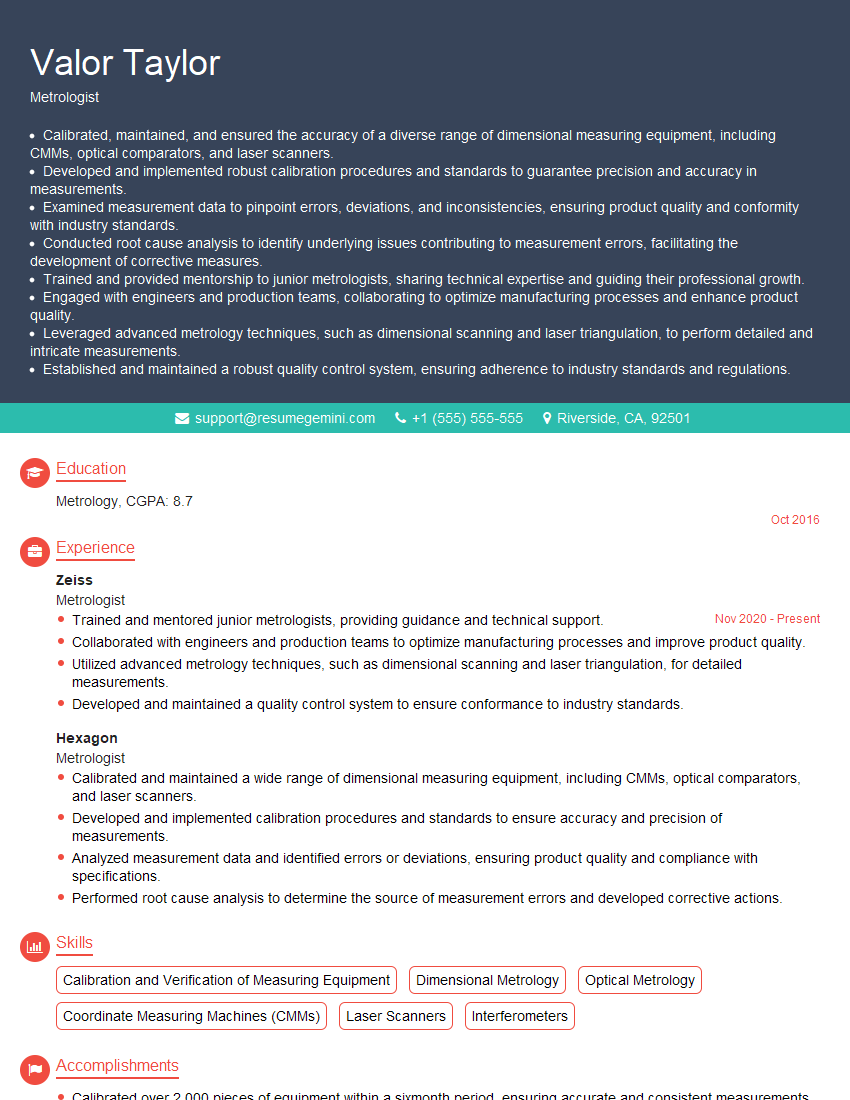
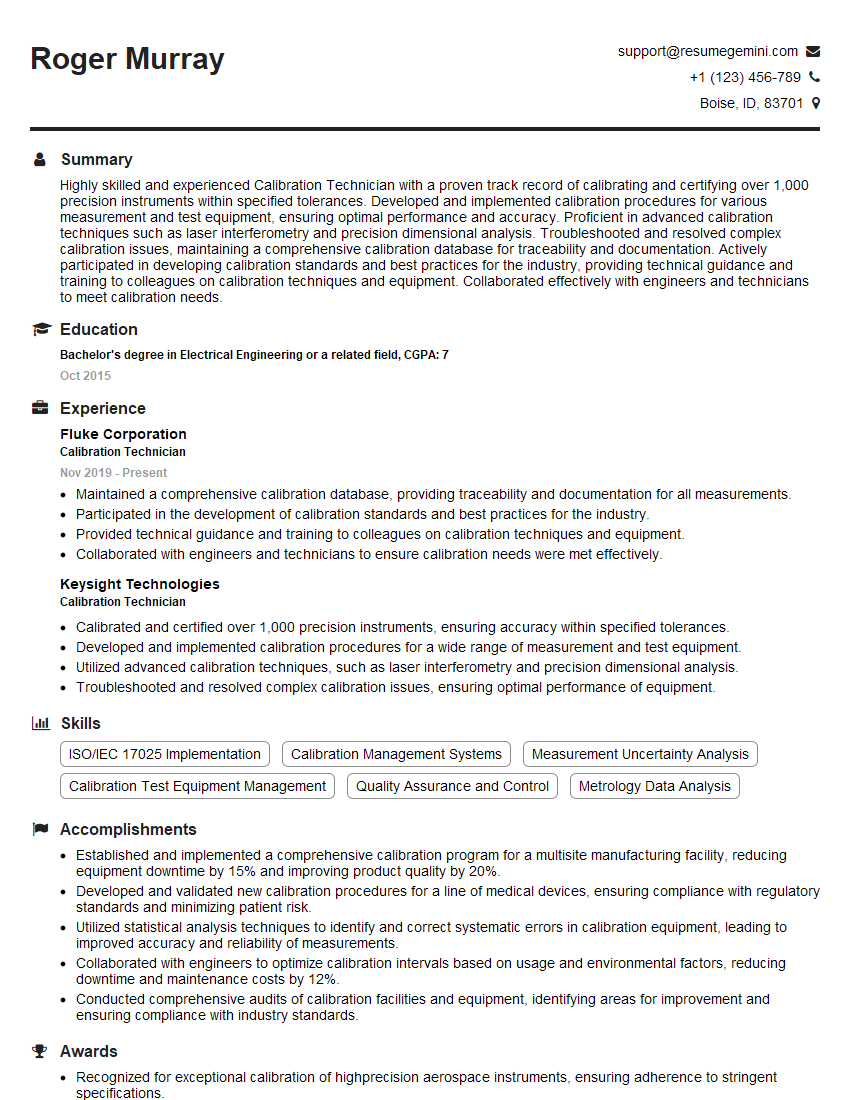
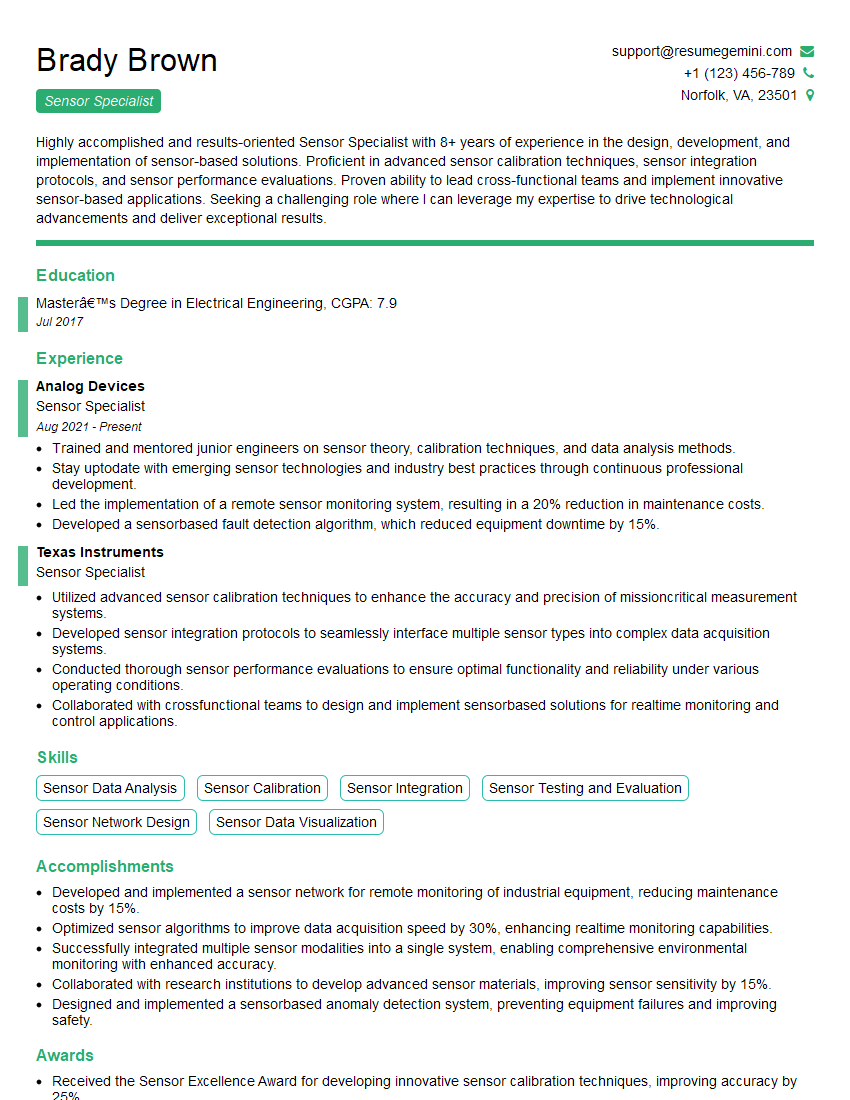
Mastering Temperature Measurement and Analysis opens doors to exciting career opportunities in various high-demand industries. A strong understanding of these principles is crucial for career advancement and demonstrates a commitment to technical excellence. To significantly increase your chances of landing your dream role, focus on crafting a compelling and ATS-friendly resume that showcases your skills and experience effectively. ResumeGemini is a trusted resource to help you build a professional resume that highlights your unique qualifications. Examples of resumes tailored to Temperature Measurement and Analysis are available to guide you through the process.
Explore more articles
Users Rating of Our Blogs
Share Your Experience
We value your feedback! Please rate our content and share your thoughts (optional).
What Readers Say About Our Blog
To the interviewgemini.com Webmaster.
Very helpful and content specific questions to help prepare me for my interview!
Thank you
To the interviewgemini.com Webmaster.
This was kind of a unique content I found around the specialized skills. Very helpful questions and good detailed answers.
Very Helpful blog, thank you Interviewgemini team.