The thought of an interview can be nerve-wracking, but the right preparation can make all the difference. Explore this comprehensive guide to Traffic Engineering Techniques interview questions and gain the confidence you need to showcase your abilities and secure the role.
Questions Asked in Traffic Engineering Techniques Interview
Q 1. Explain the concept of traffic flow theory and its application in traffic engineering.
Traffic flow theory is the foundation of traffic engineering, providing a framework for understanding and predicting traffic movement. It uses mathematical models to describe the behavior of vehicles on roadways, considering factors like speed, density, and flow. These models help us understand how traffic behaves under various conditions and allow us to design and manage transportation systems more efficiently. For example, the fundamental diagram of traffic flow illustrates the relationship between speed, density, and flow, showing how traffic transitions from free-flow to congested conditions. This understanding is crucial for optimizing signal timing, designing highway capacity, and mitigating congestion.
In practice, traffic flow theory helps us:
- Determine road capacity: Understanding the relationship between flow and density allows us to determine the maximum number of vehicles a road section can handle per hour.
- Design traffic signals: Models help optimize signal timing to minimize delays and maximize throughput.
- Plan highway expansions: Traffic flow models help predict future traffic demand and determine the necessity and scale of highway upgrades.
- Assess the impact of traffic management strategies: We use these models to simulate the effects of different strategies (e.g., ramp metering, variable speed limits) before implementation.
Q 2. Describe different types of traffic signal control strategies and their advantages/disadvantages.
Traffic signal control strategies are designed to optimize traffic flow and safety at intersections. Different strategies cater to varying traffic conditions and priorities. Some common types include:
- Fixed-time control: Signals operate on a predetermined cycle length and green splits, regardless of traffic demand. This is simple and inexpensive, but can be inefficient during periods of varying traffic volume.
- Actuated control: Sensors detect vehicles approaching the intersection, adjusting cycle lengths and green splits based on real-time demand. This is more efficient than fixed-time control but requires more complex equipment and programming.
- Adaptive control: This advanced system uses algorithms to continuously monitor traffic conditions and adjust signal timing in real-time, optimizing for various performance measures. This approach is highly efficient but requires sophisticated software and hardware.
- Traffic responsive control: Similar to adaptive control but typically incorporates more sophisticated prediction algorithms to adjust signal timing based on anticipated future traffic conditions.
Advantages and Disadvantages Summary:
| Strategy | Advantages | Disadvantages |
|---|---|---|
| Fixed-time | Simple, inexpensive | Inefficient during varying demand |
| Actuated | More efficient than fixed-time | More complex, requires sensors |
| Adaptive/Traffic Responsive | Highly efficient, optimized for multiple objectives | Expensive, requires sophisticated software and hardware |
The choice of strategy depends on factors like traffic volume, intersection complexity, budget, and desired level of efficiency.
Q 3. How do you analyze traffic data to identify congestion hotspots and bottlenecks?
Analyzing traffic data to pinpoint congestion hotspots and bottlenecks involves a systematic approach. We begin by collecting data from various sources such as:
- Loop detectors: Embedded in the roadway, these sensors provide data on vehicle speed, flow, and occupancy.
- Video cameras: Provide visual information for qualitative assessment and can be integrated with automated vehicle detection systems.
- GPS data from smartphones and connected vehicles: Offer large-scale, real-time traffic information, often used for navigation apps.
Once data is collected, we use various techniques for analysis:
- Speed-flow-density analysis: Examining the relationship between these parameters helps identify sections experiencing low speeds and high density, indicative of congestion.
- Delay analysis: Assessing travel times helps quantify congestion and pinpoint areas with excessive delays.
- Queue length analysis: Measuring the length of queues at intersections or bottlenecks provides direct evidence of congestion levels.
- GIS mapping: Visualizing traffic data on a geographical map helps identify spatial patterns and pinpoint congestion hotspots.
By combining these techniques, we can identify specific locations causing significant congestion and then focus our mitigation strategies, such as improving signal timing, adding lanes, or implementing ramp metering.
Q 4. What are the key performance indicators (KPIs) used to evaluate the effectiveness of traffic management strategies?
Key Performance Indicators (KPIs) are essential for evaluating the effectiveness of traffic management strategies. Some critical KPIs include:
- Average travel time: The average time taken by vehicles to travel a specific route.
- Travel time reliability: Measures the consistency of travel times, indicating the predictability of travel times.
- Speed: Average speed of vehicles on a specific roadway segment or network.
- Volume to capacity ratio (V/C ratio): Compares traffic volume to the road’s capacity, indicating the level of congestion. A V/C ratio greater than 1 indicates congestion.
- Delay: Total time vehicles spend stopped or traveling slower than their desired speed.
- Queue length: Length of vehicles waiting at intersections or bottlenecks.
- Number of accidents: A measure of safety performance.
- Level of service (LOS): A qualitative measure describing operating conditions on a roadway, typically ranging from A (free-flow) to F (extremely congested).
By tracking these KPIs before and after implementing a traffic management strategy, we can quantitatively assess its effectiveness in improving traffic flow, reducing congestion, and enhancing safety.
Q 5. Explain your experience with traffic simulation software (e.g., VISSIM, CORSIM).
I have extensive experience using VISSIM, a microscopic traffic simulation software. I’ve utilized it in numerous projects, ranging from signal timing optimization at complex intersections to evaluating the impact of highway widening projects. VISSIM allows us to model individual vehicles and their interactions, providing a detailed and realistic simulation of traffic flow. For example, in one project, we used VISSIM to model the impact of adding a new bus lane on a congested corridor. The simulation helped us to quantify the improvement in bus travel times and the overall impact on traffic flow, supporting our recommendations for the project.
My experience encompasses:
- Model calibration and validation: Ensuring the model accurately represents real-world traffic conditions.
- Scenario development and analysis: Evaluating various traffic management strategies using ‘what-if’ scenarios.
- Data analysis and reporting: Interpreting simulation results and presenting findings to clients and stakeholders.
While I’m proficient with VISSIM, I also possess familiarity with other simulation tools, and I choose the most appropriate software based on project requirements and data availability.
Q 6. How do you apply principles of traffic safety in your design and analysis?
Traffic safety is paramount in all my design and analysis work. I incorporate safety principles throughout the entire process, from initial design concept to final implementation. This includes:
- Geometric design: Ensuring adequate sight distances, appropriate curve radii, and safe lane widths to minimize crash risks.
- Signal timing optimization: Designing signal timings to reduce conflicts and enhance safety at intersections.
- Pedestrian and bicycle safety considerations: Incorporating dedicated pedestrian and bicycle facilities, and designing intersections to prioritize pedestrian safety.
- Crash data analysis: Identifying high-crash locations to pinpoint areas needing improvement.
- Safety audits: Conducting comprehensive reviews of design plans to identify potential safety hazards.
For example, during a recent highway design project, we conducted a detailed safety analysis using crash modification factors to evaluate the safety impact of different design alternatives. This analysis helped us to select a design that minimized the predicted number of crashes.
Q 7. Describe your experience with different types of traffic models (e.g., macroscopic, microscopic).
I have experience with both macroscopic and microscopic traffic models. Macroscopic models aggregate traffic flow into larger units, focusing on aggregate measures like flow, speed, and density. They are computationally efficient and suitable for large-scale network analysis. Microscopic models, on the other hand, simulate the behavior of individual vehicles, providing a more detailed and realistic representation of traffic flow. They are ideal for analyzing complex interactions between vehicles and for evaluating specific strategies at smaller scales.
Macroscopic Models: These are useful for strategic planning, network-level analysis, and forecasting traffic conditions over large areas. Examples include LWR (Lighthill-Whitham-Richards) model and Cell Transmission Model (CTM).
Microscopic Models: These offer greater detail and realism but require more computational resources. Examples include VISSIM and CORSIM, which I have experience using.
The choice between macroscopic and microscopic models depends on the project’s specific objectives, the scale of the network being analyzed, and the level of detail required. In practice, I often use a combination of both approaches, leveraging the strengths of each model for comprehensive analysis.
Q 8. How do you handle conflicting objectives in traffic engineering projects?
Traffic engineering projects often involve competing objectives. For example, increasing capacity might conflict with improving safety or minimizing environmental impact. Handling these conflicts requires a multi-faceted approach involving stakeholder engagement, robust data analysis, and optimization techniques.
My approach involves:
- Identifying all objectives and stakeholders: This ensures everyone’s concerns are considered, from residents to businesses to environmental agencies.
- Quantifying objectives: Converting qualitative goals (e.g., ‘improve safety’) into measurable metrics (e.g., ‘reduce accidents by 20%’) allows for objective comparison and prioritization.
- Utilizing multi-criteria decision analysis (MCDA): MCDA techniques, such as weighted scoring, allow us to rank different alternatives based on how well they satisfy various objectives. Each objective receives a weight reflecting its relative importance.
- Developing and evaluating alternative solutions: We explore a range of solutions, simulating their impact on each objective using traffic modeling software. This provides a clear comparison to support informed decision-making.
- Compromise and negotiation: Sometimes, perfect solutions aren’t achievable. Facilitating discussion and compromise among stakeholders ensures everyone feels heard and that the final solution represents a balance of interests.
For example, in a recent project, we had to balance improving traffic flow on a highway with minimizing noise pollution for nearby residents. Through MCDA and stakeholder meetings, we chose a solution that involved widening the highway in specific sections, implementing noise barriers, and adjusting speed limits – a compromise that addressed both concerns, albeit imperfectly.
Q 9. What are the limitations of using traffic count data for traffic analysis?
While traffic count data is essential for traffic analysis, it has limitations. It provides a snapshot of traffic volume at specific locations and times but doesn’t capture the full picture of traffic behavior.
- Limited information on vehicle types: Simple counts don’t differentiate between cars, trucks, buses, etc., impacting capacity calculations and safety analysis.
- Spatial limitations: Data is only collected at specific points, not across the entire network. This can lead to inaccurate conclusions about overall network performance.
- Temporal limitations: Counts are often taken for short periods, failing to capture daily, weekly, or seasonal variations.
- Lack of behavioral data: Counts don’t provide insights into driver behavior, such as speed, acceleration, or lane changing, which are crucial for safety and operational efficiency analysis.
- Data inaccuracy due to equipment malfunction or human error: The accuracy of traffic counts depends on the quality of the equipment used and the expertise of the personnel involved.
To overcome these limitations, we often supplement traffic counts with other data sources, such as origin-destination studies, speed studies, and video analysis, to obtain a more complete understanding of traffic conditions.
Q 10. Explain the different types of traffic surveys and their applications.
Several traffic surveys provide different perspectives on traffic characteristics. The choice of survey depends on the project’s specific needs.
- Manual Counts: Involves human observers manually recording vehicle and pedestrian counts at specified locations and times. This is relatively inexpensive but labor-intensive and subject to human error. Useful for short-term, low-volume situations.
- Automatic Traffic Recorders (ATR): Electronic devices that automatically record traffic volume, speed, and occupancy. More accurate and efficient than manual counts for long-term monitoring and high-volume locations.
- Origin-Destination (O-D) Studies: Determine where traffic originates and terminates. This information is vital for network-level planning and analysis, often using techniques such as license plate surveys or roadside interviews.
- Speed Studies: Measure the speed of vehicles at various locations. These are crucial for identifying speed-related safety issues and evaluating the effectiveness of speed management strategies. Radar guns and video detection are commonly used.
- Intersection Gap Studies: Analyze the gaps between vehicles at intersections to evaluate pedestrian crossing safety and signal timing efficiency.
- Turning Movement Counts (TMC): These detailed counts identify the number of vehicles turning left, right, or going straight at an intersection, providing critical data for signal design and intersection improvements. Often used in conjunction with video cameras.
For instance, when designing a new roundabout, we’d use TMCs to understand turning movements, speed studies to assess speeds approaching the roundabout, and gap studies to ensure adequate time for pedestrians to cross.
Q 11. Describe your experience with geometric design of roadways and intersections.
My experience in geometric design encompasses both roadways and intersections, focusing on safety and efficiency. I’m proficient in using design software like AutoCAD Civil 3D to create plans and assess designs against design standards (AASHTO, etc.).
Roadway design: This includes determining appropriate lane widths, shoulder widths, horizontal and vertical alignment (curves, grades), sight distances, and drainage systems. Safety features such as rumble strips and median barriers are also integral to my design process.
Intersection design: This involves selecting the appropriate intersection type (e.g., signalized, roundabout, all-way stop), optimizing signal timing, designing appropriate geometrics for turning movements, and incorporating pedestrian and bicycle facilities. I consider sight distance, turning radii, and conflict points to ensure safety and efficiency.
In one project, we redesigned a dangerous intersection that had a high accident rate. By incorporating a roundabout and improving pedestrian crossings, we significantly reduced accidents and improved traffic flow.
I also have experience using simulation software to model traffic flow under various scenarios, allowing us to test different design options before construction and optimize designs for safety and efficiency.
Q 12. How do you incorporate Intelligent Transportation Systems (ITS) technologies into traffic management?
Intelligent Transportation Systems (ITS) are crucial for modern traffic management. I integrate them into my projects to optimize traffic flow, enhance safety, and improve the overall transportation experience.
- Adaptive Traffic Control Systems (ATCS): These systems use real-time data from sensors to adjust signal timings dynamically, optimizing traffic flow based on current conditions. I have experience implementing and calibrating ATCS to minimize delays and improve throughput.
- Advanced Traveler Information Systems (ATIS): Providing drivers with real-time information on traffic conditions, incidents, and alternative routes through technologies such as variable message signs, mobile apps, and GPS navigation systems.
- Closed-Circuit Television (CCTV): Using cameras to monitor traffic conditions, identify incidents, and provide visual data for analysis. CCTV footage can be valuable for post-incident investigations and performance evaluation.
- Incident Management Systems: Integrating technologies to improve response times to incidents, minimizing disruption to traffic flow. This can involve connected vehicle technology, which allows for quicker detection and notification of incidents.
- Data Analytics and Predictive Modeling: Utilizing data from various ITS sources to analyze traffic patterns, predict future congestion, and proactively adjust traffic management strategies.
For example, in a recent project, we implemented an ATCS system on a congested corridor, significantly reducing delays during peak hours. The system uses data from detectors embedded in the roadway to dynamically adjust signal timing based on real-time traffic demand.
Q 13. Explain the concept of capacity and level of service in traffic engineering.
Capacity refers to the maximum hourly rate at which vehicles can reasonably be expected to traverse a point or a segment of a lane or roadway during a given time period under prevailing roadway, traffic, and control conditions. It’s essentially the maximum flow rate a roadway section can handle.
Level of Service (LOS) is a qualitative measure describing operational conditions within a traffic stream and their perception by drivers. LOS is typically graded from A (free flow) to F (extremely congested), with each level corresponding to specific performance measures like speed, density, and delay. LOS helps quantify the experience of drivers and evaluate the effectiveness of traffic management strategies. AASHTO guidelines provide specific criteria for determining LOS for various roadway types and conditions.
Understanding capacity and LOS is critical for designing and operating efficient transportation systems. For example, if a roadway segment’s traffic volume exceeds its capacity, the LOS will likely be poor (e.g., LOS E or F), resulting in significant delays and congestion. Traffic engineers utilize capacity and LOS analyses to identify bottlenecks, justify improvements (such as adding lanes), and evaluate the effectiveness of proposed solutions.
Q 14. How do you perform a traffic impact study for a new development project?
A Traffic Impact Study (TIS) assesses the impact of a new development (e.g., shopping mall, residential complex) on the surrounding transportation network. It’s crucial for ensuring the development doesn’t unduly worsen existing traffic conditions.
My approach to a TIS typically involves:
- Existing conditions analysis: Gathering data on existing traffic volumes, speeds, delays, and LOS through traffic counts, speed studies, and other data sources.
- Trip generation estimation: Predicting the number of vehicle trips generated by the new development based on factors like land use, building size, and occupancy rates. We use accepted methodologies and software tools for these estimations.
- Trip distribution and assignment: Determining how those trips will distribute throughout the network and which routes they’ll take using traffic modeling software.
- Future conditions simulation: Modeling the traffic conditions with the development in place. This involves incorporating the predicted trips into the network model and assessing the resulting changes in traffic flow, delays, and LOS.
- Mitigation measures: Identifying and proposing measures to mitigate any adverse impacts identified in the simulation. This could involve intersection improvements, additional lanes, adjustments to signal timings, or even alternative transportation options.
- Reporting and Recommendations: Documenting the findings, including analysis of peak-hour conditions and potential bottlenecks, and presenting detailed recommendations for mitigating traffic impacts.
A TIS isn’t just about numbers; it’s about proactively addressing potential negative impacts on residents, businesses, and emergency services. A well-conducted TIS ensures the development can integrate smoothly into the existing transportation network, minimizing disruption and enhancing overall mobility.
Q 15. Describe your experience with traffic calming measures and their effectiveness.
Traffic calming measures are implemented to reduce vehicle speeds and improve safety in residential areas or near schools. Their effectiveness is judged by a multifaceted approach, not solely on speed reduction. I’ve been involved in numerous projects employing various techniques. For instance, one project involved installing speed humps in a neighborhood with a high volume of speeding vehicles. Pre-implementation speed studies showed an average speed exceeding the 25 mph limit. Post-implementation, we saw a significant drop to below the limit, alongside a notable reduction in reported near-misses and accidents. However, we also monitored for potential negative consequences, like increased congestion on adjacent streets.
Other measures I’ve worked with include narrowed roadways, raised crosswalks, roundabouts, and chicanes. The effectiveness of each depends on the specific context – street geometry, traffic volume, pedestrian activity, and the community’s needs. A key aspect is community engagement; involving residents ensures buy-in and helps tailor solutions for optimal results. For example, in one project, initial proposals for speed bumps were met with resistance; after community consultations, we adapted the design and selected locations collaboratively, leading to a much smoother implementation.
- Speed Humps: Effective at reducing speeds, but can cause minor discomfort to drivers and potentially increase noise.
- Roundabouts: Force drivers to slow down and yield, improving safety, but require careful design and consideration of traffic volume.
- Chicanes: Narrowed road sections forcing drivers to slow down, but require sufficient space to implement effectively.
Career Expert Tips:
- Ace those interviews! Prepare effectively by reviewing the Top 50 Most Common Interview Questions on ResumeGemini.
- Navigate your job search with confidence! Explore a wide range of Career Tips on ResumeGemini. Learn about common challenges and recommendations to overcome them.
- Craft the perfect resume! Master the Art of Resume Writing with ResumeGemini’s guide. Showcase your unique qualifications and achievements effectively.
- Don’t miss out on holiday savings! Build your dream resume with ResumeGemini’s ATS optimized templates.
Q 16. Explain your understanding of queueing theory and its application to traffic analysis.
Queueing theory is a mathematical tool used to model and analyze waiting lines – in our case, lines of vehicles at intersections or on roadways. Understanding queueing theory helps predict delays, optimize signal timings, and design efficient traffic systems. The theory involves concepts like arrival rates (how often cars arrive), service rates (how quickly they can pass through an intersection), and queue length. It uses various models (e.g., M/M/1, D/D/1) depending on the characteristics of the arrival and service processes. For example, an M/M/1 model assumes Poisson arrivals (random) and exponentially distributed service times (also random).
In practical traffic analysis, we might use queueing theory to determine the optimal cycle length for traffic signals at an intersection experiencing significant congestion. By modelling the arrival rates of vehicles on each approach and the saturation flow rates (maximum number of vehicles that can pass through the intersection per unit of time), we can predict queue lengths and delays under different signal timings. This allows us to find signal timings that minimize delays and improve overall efficiency. We may also simulate different scenarios (e.g., adding a lane, adjusting signal timing) to evaluate their impact on queue lengths and delays, enabling data-driven decision-making.
//Simplified example: Calculating average queue length (very basic) let arrivalRate = 10; // vehicles per minute let serviceRate = 12; // vehicles per minute let averageQueueLength = arrivalRate / (serviceRate - arrivalRate); console.log('Average Queue Length: ' + averageQueueLength); Q 17. What are the common causes of traffic accidents and how can they be mitigated?
Traffic accidents stem from a complex interplay of factors, rarely attributable to a single cause. Common contributing factors include:
- Human error: This is the most significant factor, encompassing speeding, distracted driving (cell phones, drowsiness), impaired driving (alcohol or drugs), aggressive driving, and failure to yield.
- Roadway design deficiencies: Poor visibility, inadequate signage, lack of proper lighting, sharp curves, and insufficient shoulders all contribute to increased risk.
- Environmental factors: Adverse weather conditions like rain, snow, or fog significantly reduce visibility and traction, increasing accident likelihood.
- Vehicle malfunctions: Brake failure, tire blowouts, and other mechanical issues can lead to accidents.
Mitigation strategies involve a multi-pronged approach. Addressing human error requires public awareness campaigns, stricter enforcement of traffic laws, and driver education programs focusing on safe driving practices. Improving road design involves implementing safety features like improved lighting, clear signage, rumble strips, and median barriers. Environmental factors can be mitigated through improved weather forecasting and warnings, while vehicle safety is addressed through mandatory vehicle inspections and advancements in vehicle safety technology.
For example, I worked on a project where a high accident rate at a particular intersection was primarily due to poor visibility. By installing improved lighting and strategically placing reflective signage, we saw a significant drop in accidents within a year.
Q 18. How do you evaluate the effectiveness of different traffic management strategies?
Evaluating traffic management strategies necessitates a comprehensive approach that goes beyond anecdotal evidence. Several key metrics and methods are employed:
- Accident data analysis: Comparing pre- and post-implementation accident rates, severity, and location. Statistical methods help determine if the observed changes are statistically significant.
- Speed studies: Measuring average speeds and speed distributions before and after implementation. Speed reductions are a key indicator of success for calming measures.
- Delay studies: Measuring travel times and queue lengths to assess the impact on traffic flow. These are crucial for evaluating signal timing changes.
- Level of service (LOS) analysis: Using established standards (e.g., Highway Capacity Manual) to assess the operational efficiency of a roadway or intersection.
- Community feedback: Surveys and feedback sessions help gauge public perception and satisfaction with the implemented strategies. This is crucial for gauging the overall effectiveness, especially for traffic calming measures.
Data is often analyzed using statistical software packages and sometimes involves the use of simulation models to predict performance before and after implementation of a strategy. A successful evaluation involves a thorough comparison of performance metrics before and after, complemented by community feedback, to provide a holistic picture of the strategy’s impact.
Q 19. Describe your experience with transportation planning models (e.g., four-step model).
The four-step model is a classic transportation planning model used to forecast future travel demand. It involves these steps:
- Trip generation: Estimating the number of trips originating and ending in different zones based on socioeconomic factors (population, employment, income).
- Trip distribution: Assigning trip origins to destinations using gravity models or other techniques that consider travel time and cost.
- Mode choice: Determining the mode of transportation (car, transit, bike, walk) for each trip based on factors like travel time, cost, and convenience.
- Trip assignment: Assigning trips to the specific roadway network, considering factors like capacity, congestion, and route choice behavior.
I’ve extensively used these models, often incorporating more sophisticated techniques within each step (e.g., using logit models for mode choice, or traffic assignment models considering route choice dynamics). Modern iterations often leverage GIS data, allowing for a more spatially explicit analysis. For example, in a recent project, we used the four-step model to project future traffic volumes in a rapidly developing area. This informed the design of new roadways, improvements to existing infrastructure, and the overall transportation network planning.
The results of the modeling helped justify the need for investments in road widening projects and public transit expansion. It is important to note that model outputs are sensitive to the input data and the model’s underlying assumptions. Therefore, thorough data validation and sensitivity analysis are crucial for reliable results.
Q 20. Explain the principles of signal timing optimization.
Signal timing optimization aims to minimize delay, maximize throughput, and enhance safety at signalized intersections. The principles involve:
- Cycle length determination: Finding the appropriate cycle length to accommodate the demand on all approaches while minimizing delays. This often involves balancing the needs of different movements.
- Green split allocation: Determining the duration of green time for each approach based on traffic volume, saturation flow rate, and desired level of service.
- Offset optimization: Coordinating the timing of signals at multiple intersections to create green waves and improve traffic flow along corridors. This minimizes stopping and starting.
- Actuated control: Using detectors to adjust signal timings in real-time based on actual traffic conditions. This adapts to varying demands throughout the day.
Optimization techniques can be manual or involve software packages that use algorithms to find optimal signal timings. Factors like pedestrian crossing times, turning movements, and traffic safety must be carefully considered. For instance, I was involved in optimizing signal timings along a major arterial route. We used a simulation model to test different timings, considering traffic volumes at various times of the day. This resulted in a 15% reduction in average delay and a slight improvement in safety.
Q 21. How do you use GIS in traffic engineering projects?
GIS (Geographic Information System) is indispensable in traffic engineering projects. It provides a powerful platform for visualizing, analyzing, and managing spatial data. Its applications include:
- Data visualization: Mapping traffic accidents, congestion hotspots, road networks, and other relevant spatial data. This helps identify problem areas and trends.
- Network analysis: Determining shortest paths, travel times, and network connectivity. This is crucial for route planning and traffic simulation.
- Data integration: Integrating traffic data from various sources (e.g., detectors, cameras, GPS) with other geographic data (e.g., land use, demographics). This provides a comprehensive understanding of the transportation system.
- Spatial analysis: Performing spatial queries, buffering, and overlay operations to analyze relationships between traffic patterns and other geographic features. This can help identify areas needing safety improvements.
- Project planning and design: Visualizing proposed road projects, traffic calming measures, and signal locations. This helps stakeholders understand the impact of design decisions.
In a recent project, we used GIS to create interactive maps showing real-time traffic conditions, accident locations, and public transportation routes. This improved situational awareness for both traffic managers and the public. GIS is not just for visualization; the analytical capabilities empower us to extract insights and make data-driven decisions to improve the efficiency and safety of the transportation system.
Q 22. Describe your experience with data analysis tools and techniques relevant to traffic engineering.
My experience with data analysis in traffic engineering is extensive, encompassing both traditional and cutting-edge techniques. I’m proficient in using software like ArcGIS, TransCAD, and various programming languages such as Python with libraries like Pandas and NumPy for data manipulation and analysis. I’ve used these tools to analyze large datasets from various sources, including loop detectors, GPS trackers, and traffic cameras. For instance, I once used Python to analyze loop detector data to identify recurring congestion patterns on a major highway, leading to the implementation of optimized traffic signal timings. My analysis often involves statistical methods like regression analysis to model traffic flow and forecasting techniques like time series analysis to predict future traffic conditions. I’m also experienced in visualizing data using tools like Tableau and Power BI to communicate findings effectively to both technical and non-technical stakeholders.
Specifically, I have expertise in:
- Descriptive Statistics: Calculating measures of central tendency and dispersion to understand traffic characteristics.
- Regression Analysis: Building models to predict traffic flow based on factors like time of day, day of week, and weather.
- Time Series Analysis: Forecasting future traffic patterns to anticipate and mitigate congestion.
- Spatial Analysis: Using GIS software to analyze traffic patterns geographically and identify hotspots.
Q 23. How do you address the challenges of managing traffic in urban areas?
Managing urban traffic presents unique challenges, primarily due to high traffic density, limited space, and diverse transportation modes. My approach involves a multi-faceted strategy incorporating several key elements:
- Integrated Traffic Management Systems (ITMS): Implementing and optimizing ITMS to coordinate signals, manage incidents, and improve overall traffic flow. This often involves adaptive signal control systems that adjust timings in real-time based on traffic conditions.
- Data-Driven Decision Making: Leveraging data analysis to identify congestion hotspots, understand traffic patterns, and evaluate the effectiveness of implemented measures. This might involve analyzing traffic count data, GPS trajectories, or social media posts to understand real-time conditions.
- Intelligent Transportation Systems (ITS): Utilizing technologies such as adaptive traffic control, ramp metering, and variable speed limits to improve traffic efficiency and safety. For example, implementing ramp metering can effectively regulate the flow of vehicles entering a highway, preventing bottlenecks.
- Public Transportation Improvements: Enhancing public transportation options through increased frequency, improved accessibility, and the integration of various modes. This reduces reliance on private vehicles, thus easing congestion.
- Demand Management Strategies: Implementing strategies such as congestion pricing, parking management, and promoting alternative modes of transportation (cycling, walking) to influence travel behavior and reduce peak-hour congestion.
For example, in a previous project, we implemented an adaptive traffic signal system that reduced average travel times by 15% during peak hours by dynamically adjusting signal timings based on real-time traffic data.
Q 24. Explain your experience with public transportation planning and analysis.
My experience in public transportation planning and analysis includes various aspects, from route optimization and scheduling to demand forecasting and service evaluation. I’ve worked on projects involving different modes of public transport, including buses, light rail, and subways. My work often involves using specialized software for transit planning and simulation, such as TRANSIT and Aimsun. I use various techniques to analyze ridership data, travel time, and service reliability. For example, I’ve used simulation models to evaluate the impact of proposed service changes, such as increased frequency or new routes, on overall system performance and passenger experience.
A specific example involved optimizing bus routes in a rapidly growing suburban area. We used a combination of geographic information systems (GIS), ridership data analysis, and optimization algorithms to design a new bus network that improved service coverage, reduced travel times, and increased ridership by 18%.
Q 25. What are the latest trends and technologies in traffic engineering?
The field of traffic engineering is constantly evolving, with several key trends and technologies shaping its future. Some of the most significant include:
- Connected and Autonomous Vehicles (CAVs): CAVs promise to revolutionize traffic management through enhanced communication and coordination. This requires developing new traffic control strategies that can effectively manage mixed traffic flows of autonomous and human-driven vehicles.
- Artificial Intelligence (AI) and Machine Learning (ML): AI and ML are being increasingly utilized for traffic forecasting, incident detection, and optimization of traffic control systems. ML algorithms can analyze large datasets to identify patterns and predict future traffic conditions with greater accuracy than traditional methods.
- Big Data Analytics: The ability to collect and analyze massive amounts of traffic data from various sources is crucial for improving traffic management. This involves developing efficient data storage and processing techniques and leveraging advanced analytics to extract meaningful insights.
- Smart City Initiatives: The integration of traffic management systems into broader smart city initiatives is improving urban mobility. This includes the use of sensors, data platforms, and communication networks to create more efficient and sustainable transportation systems.
- Micromobility Integration: The rise of micromobility options (e-scooters, bikes) requires integrating these into traffic management strategies. This includes understanding their impact on traffic flow and developing strategies to ensure safe and efficient coexistence with other modes of transportation.
Q 26. How do you communicate complex technical information to non-technical audiences?
Communicating complex technical information to non-technical audiences requires a clear and concise approach, avoiding jargon and using relatable analogies. I utilize several techniques:
- Visual Aids: Charts, graphs, and maps are invaluable tools for presenting complex data in a readily understandable format. I carefully select visuals that highlight key findings without overwhelming the audience with unnecessary detail.
- Simple Language: I avoid technical jargon and use plain language, explaining any necessary terms clearly and concisely. Analogies can help bridge the gap between technical concepts and everyday experience.
- Storytelling: Framing technical information within a narrative makes it more engaging and memorable. This helps to illustrate the relevance and impact of the information presented.
- Interactive Presentations: Utilizing interactive elements in presentations can increase engagement and allow for a more dynamic exchange of information.
- Tailored Messaging: Adjusting the level of detail and complexity to match the audience’s understanding is crucial for effective communication. I tailor my message to resonate with the specific knowledge and interests of the audience.
For instance, when explaining the concept of adaptive traffic signal control to a city council, I would focus on the benefits (reduced congestion, improved safety) rather than delving into the technical details of the algorithms involved.
Q 27. Describe your experience working on a large-scale traffic engineering project.
I was involved in a large-scale project to redesign the traffic management system for a major metropolitan area. The project encompassed several phases, starting with a comprehensive traffic data analysis to identify bottlenecks and congestion hotspots. We used a combination of loop detector data, GPS traces, and traffic camera footage to build a detailed traffic model of the city. Based on this analysis, we proposed a range of interventions, including the implementation of adaptive traffic signal control at key intersections, the introduction of bus rapid transit (BRT) lanes, and improvements to public transportation infrastructure.
The project required significant coordination with multiple stakeholders, including city officials, transportation agencies, and community groups. A crucial aspect was effective communication to keep stakeholders informed and address their concerns. The successful implementation of the redesigned system resulted in a significant reduction in congestion, improved travel times, and an increase in public transportation ridership. This project showcased my ability to manage complex, large-scale projects, collaborate effectively with diverse teams, and deliver impactful results.
Q 28. How do you stay current with the latest developments in traffic engineering?
Staying current in the rapidly evolving field of traffic engineering requires a multifaceted approach:
- Professional Organizations: I actively participate in professional organizations like the Institute of Transportation Engineers (ITE), attending conferences, workshops, and webinars to learn about the latest research and best practices.
- Academic Journals and Publications: I regularly read peer-reviewed journals and publications in transportation engineering to keep abreast of the latest advancements in the field.
- Industry Conferences and Events: Attending industry conferences and events allows for networking and learning from experts in the field. These events often feature presentations on cutting-edge technologies and research findings.
- Online Resources and Webinars: I utilize online resources and participate in webinars to learn about new tools, techniques, and emerging trends. This allows for continuous learning and professional development.
- Mentorship and Collaboration: Engaging with colleagues and mentors in the field provides opportunities for knowledge sharing and collaborative learning. This helps me stay informed about practical applications and emerging trends.
Key Topics to Learn for Traffic Engineering Techniques Interview
- Traffic Flow Theory: Understanding fundamental concepts like traffic density, speed, flow relationships, and their impact on network performance. Practical application includes analyzing existing traffic data to identify bottlenecks.
- Traffic Signal Control and Optimization: Mastering signal timing design, coordination strategies (e.g., actuated, pre-timed), and performance evaluation metrics. Practical application involves proposing improvements to existing signal timings to reduce congestion.
- Microscopic and Macroscopic Simulation Modeling: Familiarize yourself with different simulation software and their application in analyzing traffic behavior under various scenarios. Practical application includes predicting the impact of proposed infrastructure changes.
- Geometric Design of Highways and Streets: Understanding design elements like horizontal and vertical alignments, intersection design, and their impact on safety and efficiency. Practical application involves evaluating the safety of existing road sections and proposing design improvements.
- Transportation Planning and Demand Forecasting: Understanding travel demand modeling techniques and their use in long-term transportation planning. Practical application involves forecasting future traffic demand to inform infrastructure investment decisions.
- Data Analysis and Visualization: Proficiency in analyzing traffic data using statistical methods and visualizing results effectively using appropriate tools. Practical application includes identifying trends and patterns in traffic data to support decision-making.
- Intelligent Transportation Systems (ITS): Understanding the application of technology like adaptive traffic control, advanced traveler information systems, and connected vehicles in improving traffic efficiency and safety. Practical application includes evaluating the potential benefits of implementing ITS technologies.
Next Steps
Mastering Traffic Engineering Techniques is crucial for career advancement in this dynamic field. A strong understanding of these concepts will significantly enhance your problem-solving abilities and open doors to exciting opportunities. To maximize your job prospects, creating an ATS-friendly resume is essential. ResumeGemini can help you build a professional and impactful resume that highlights your skills and experience effectively. Examples of resumes tailored to Traffic Engineering Techniques are available within ResumeGemini to guide you. Take the next step towards your dream career today!
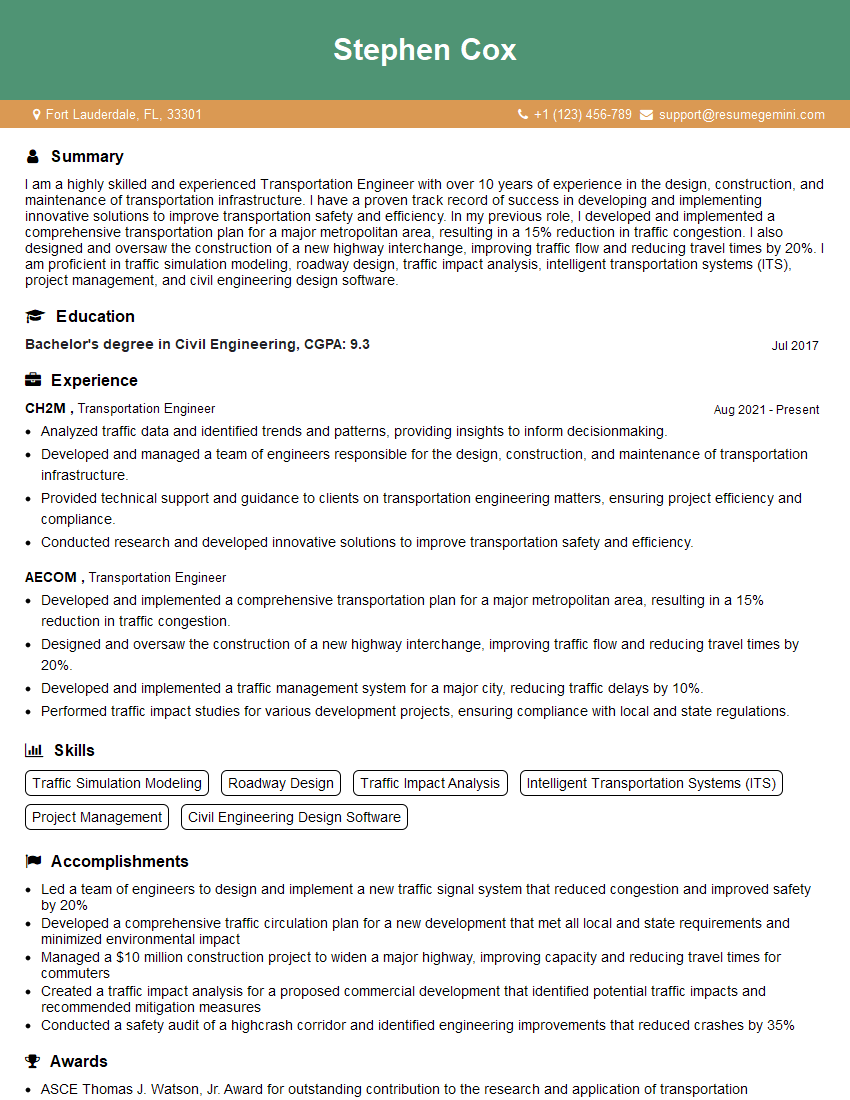
Transportation Engineer Resume Sample
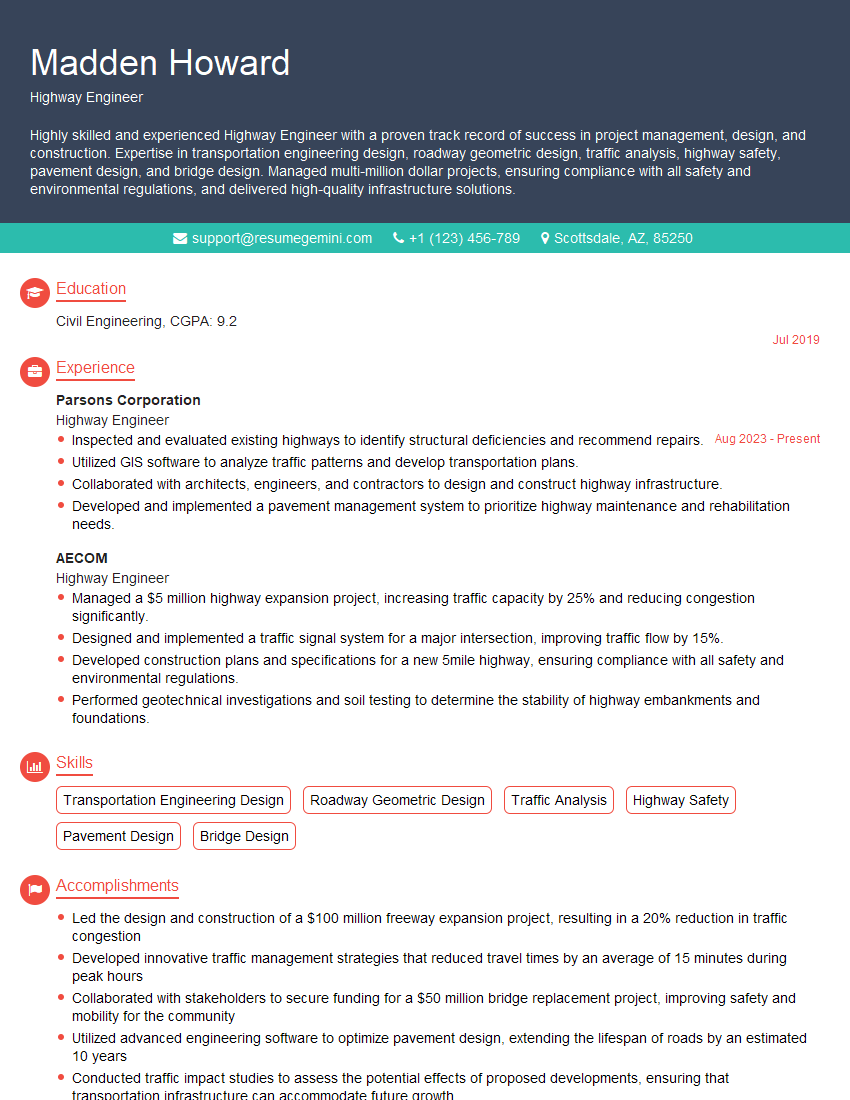
Highway Engineer Resume Sample

Traffic Engineer Resume Sample
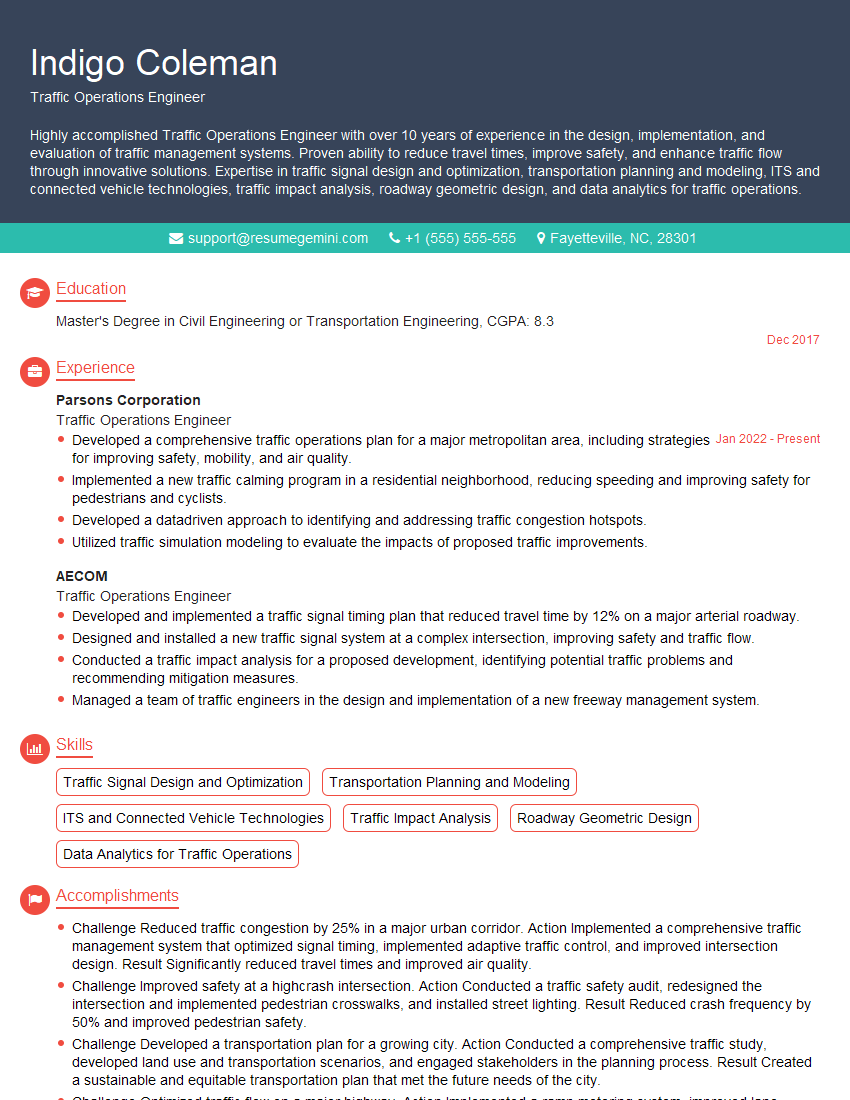
Traffic Operations Engineer Resume Sample
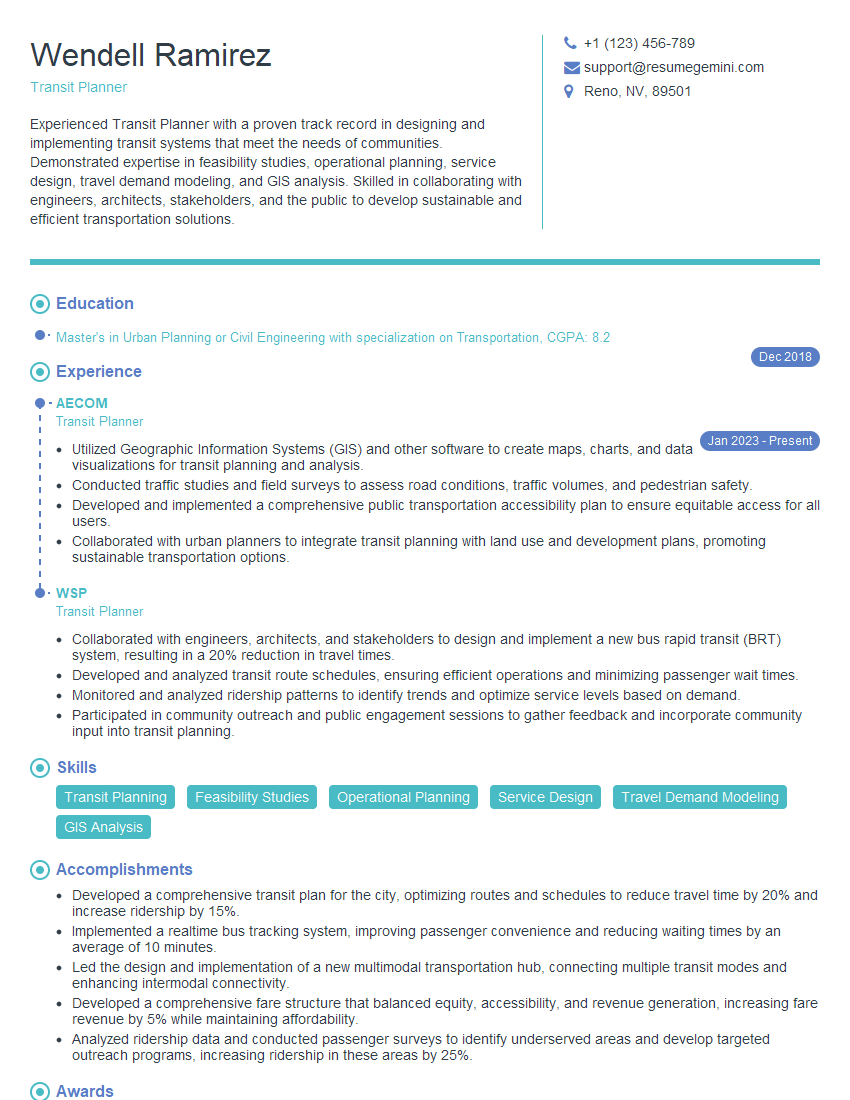
Transit Planner Resume Sample
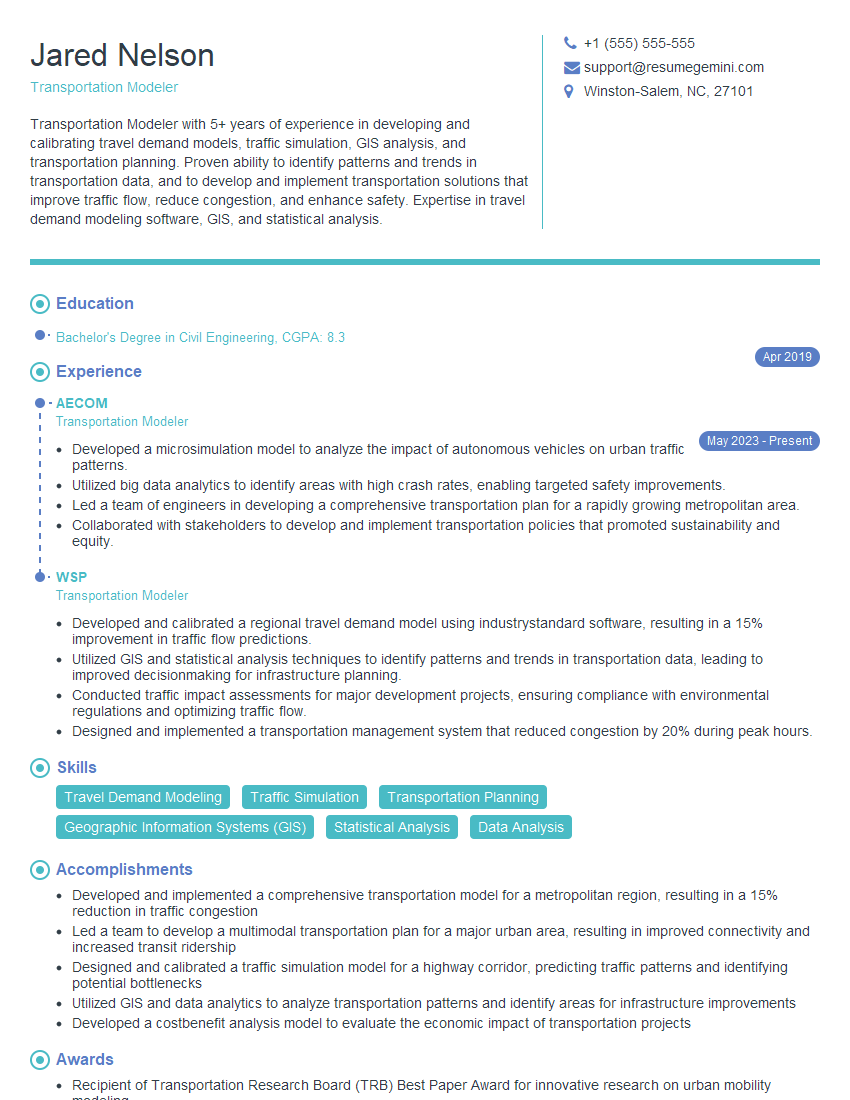
Transportation Modeler Resume Sample
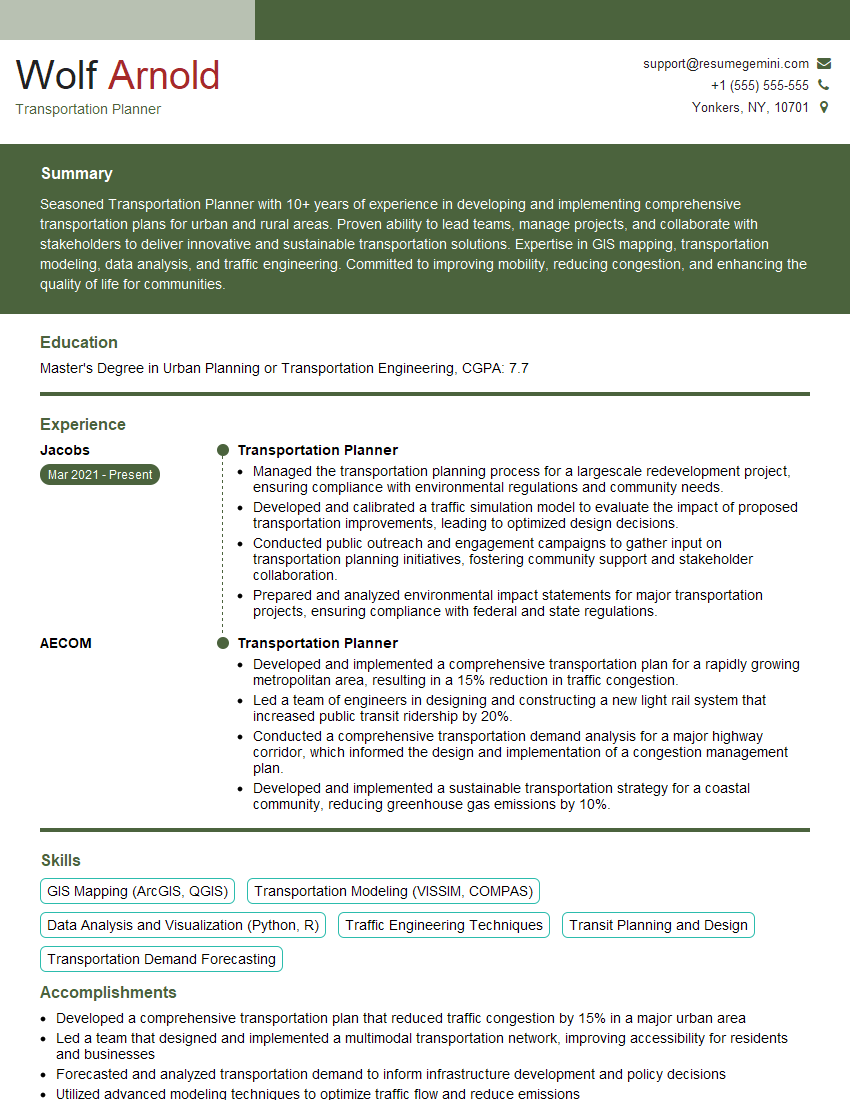
Transportation Planner Resume Sample
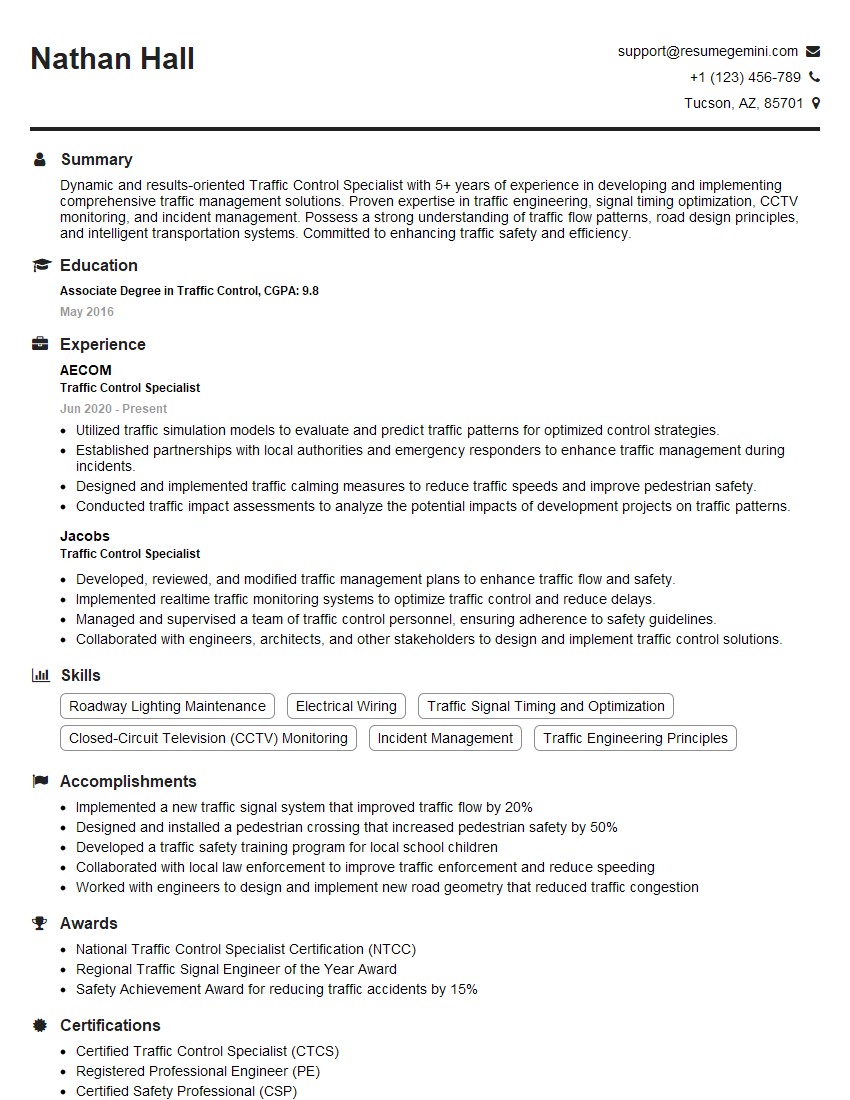
Traffic Control Specialist Resume Sample
Explore more articles
Users Rating of Our Blogs
Share Your Experience
We value your feedback! Please rate our content and share your thoughts (optional).
What Readers Say About Our Blog
To the interviewgemini.com Webmaster.
Very helpful and content specific questions to help prepare me for my interview!
Thank you
To the interviewgemini.com Webmaster.
This was kind of a unique content I found around the specialized skills. Very helpful questions and good detailed answers.
Very Helpful blog, thank you Interviewgemini team.