Interviews are more than just a Q&A session—they’re a chance to prove your worth. This blog dives into essential Transit Planning Software interview questions and expert tips to help you align your answers with what hiring managers are looking for. Start preparing to shine!
Questions Asked in Transit Planning Software Interview
Q 1. Describe your experience with different transit planning software packages (e.g., TransCAD, VISUM, Cube).
My experience encompasses a range of transit planning software packages, each with its strengths and weaknesses. I’ve extensively used TransCAD for its powerful network modeling capabilities and its robust optimization algorithms, particularly useful for large-scale network design and scenario planning. For example, in a recent project optimizing bus routes in a rapidly growing city, TransCAD’s ability to handle complex constraints and integrate with GIS data was crucial in finding the most efficient solutions. VISUM, on the other hand, is excellent for its detailed microscopic simulation capabilities, allowing for a deep dive into individual vehicle movements and passenger behaviors. I’ve leveraged VISUM to analyze the impact of signal timing changes on bus bunching and passenger wait times. Finally, Cube is a strong contender, especially for its user-friendly interface and suitability for quick scenario analysis and what-if explorations. In a project assessing the impact of a new light rail line, Cube’s rapid modeling capabilities allowed us to efficiently test different operational strategies. Each software offers unique tools; the choice often depends on the specific project requirements and available data.
Q 2. Explain the process of building a transit network model.
Building a transit network model involves several key steps. First, you need to gather and prepare the necessary data, including network geometry (roads, transit lines), transit schedules, and potentially origin-destination (OD) matrices representing passenger travel demand. This often involves cleaning and pre-processing data to ensure consistency and accuracy. Then, you import this data into your chosen software package (e.g., TransCAD, VISUM). The next step is to build the network representation within the software, defining nodes (intersections, stops) and links (road segments, transit routes). Then you input the transit schedules, specifying frequencies, headways, and dwell times at each stop. Once the network is built, you’ll define the demand, either using an existing OD matrix or estimating it through various techniques. Finally, you can run the model to simulate passenger flows and assess performance metrics such as travel times, passenger loads, and service reliability. Think of it like building a detailed map of a city’s transportation system, with each road and bus route precisely laid out, and then simulating how people move across this map.
Q 3. How do you calibrate and validate a transit demand model?
Calibration and validation are critical steps in ensuring the model’s accuracy and reliability. Calibration involves adjusting model parameters to match observed data. For instance, we might adjust parameters related to walking speeds or in-vehicle transfer times to match observed travel times. This iterative process involves comparing model outputs (e.g., predicted passenger volumes) with real-world observations (e.g., passenger counts from automatic passenger counters). Validation involves testing the calibrated model’s ability to predict outcomes under different scenarios. We might compare the model’s predictions for a specific period with actual data from that period to assess its predictive power. Statistical measures, such as root mean squared error (RMSE), are frequently used to quantify the goodness of fit. If discrepancies are significant, we may need to revisit the data collection, model assumptions, or calibration process. A well-calibrated and validated model is essential for reliable forecasting and decision-making.
Q 4. What are the common limitations of transit simulation software?
Transit simulation software, while powerful, has inherent limitations. One common limitation is the simplification of human behavior. Models often rely on aggregate representations of passenger choices, ignoring individual preferences and unpredictable factors. For example, a model might accurately predict average travel times, but it may struggle to capture the impact of unexpected delays or passenger diversions. Another limitation is the computational demands associated with detailed simulations, especially for large networks. Simplified models might be necessary to manage computational feasibility. Furthermore, the quality of the model outputs is heavily dependent on the quality and completeness of the input data. Missing or inaccurate data can lead to biased or unreliable results. Finally, the models generally assume a static network and demand, which is often unrealistic in a dynamic urban environment.
Q 5. How do you handle data inconsistencies when working with transit data?
Handling data inconsistencies is a significant challenge in transit planning. I typically address this through a multi-step process. First, I thoroughly investigate the source of the inconsistencies. This may involve checking data formats, validating data ranges, and comparing data from different sources. For example, I might find discrepancies between scheduled bus arrival times and observed arrival times. Once the source of inconsistencies is identified, I apply appropriate data cleaning techniques. This might involve data imputation (filling in missing values using statistical methods), data reconciliation (matching data from different sources), or error correction (correcting known errors). In some cases, inconsistent data may need to be flagged and excluded from the analysis, particularly if the inconsistencies cannot be resolved with reasonable confidence. Data validation throughout this process is critical to ensure data quality and minimize biases in the analysis.
Q 6. Describe your experience with GIS software and its integration with transit planning software.
My experience with GIS software, such as ArcGIS, is extensive, and I regularly integrate it with transit planning software. GIS provides crucial spatial data, such as road networks, land use, and demographic information, which are essential inputs for transit models. I often use GIS to pre-process and visualize network data, creating shapefiles representing roads, transit lines, and stops that can be directly imported into transit planning software. Further, GIS is instrumental in spatial analysis, helping to identify areas with high transit demand, assess accessibility, and visualize model outputs. For example, in a recent project, I used GIS to create accessibility maps showing travel times to various destinations by transit, aiding in the identification of transit deserts and informing service planning decisions. The seamless integration of GIS and transit planning software significantly enhances the accuracy and utility of the modeling process.
Q 7. Explain different transit assignment models and their applications.
Several transit assignment models exist, each with unique applications. All-or-nothing assignment is a simple model where all passengers choose the shortest path. This is useful for initial analysis but doesn’t accurately reflect reality, where passengers may choose slightly longer routes for various reasons. The logit-based assignment model considers stochasticity; passengers may choose paths with slightly longer travel times with some probability. This better captures real-world behavior. Furthermore, capacity-constrained assignment models account for the limited carrying capacity of transit vehicles, a vital element for accurate simulation during peak hours. The choice of model depends on the specific project goals and the level of detail required. For example, an all-or-nothing assignment might suffice for a quick assessment of a new transit route, while a capacity-constrained logit assignment would be more appropriate for a detailed analysis of network performance under peak conditions.
Q 8. How do you assess the effectiveness of different transit strategies using software?
Assessing the effectiveness of different transit strategies relies heavily on sophisticated transit planning software. We don’t just look at one metric; instead, we employ a multi-faceted approach. The software allows us to simulate various scenarios – for example, introducing a new bus route, changing frequencies, or implementing a bus rapid transit system – and then analyze their impact across several key areas.
First, we input data representing the existing transit network, including routes, schedules, and passenger counts. Then, we use the software to model the proposed strategy. This involves feeding the software details about the changes, like altered routes or increased service frequency. The software then uses algorithms to predict ridership, travel times, and operational costs under the new scenario. We compare these results to the baseline (the current system) to determine the effectiveness of the strategy.
For instance, if we are evaluating a new light rail line, we might compare the number of car trips replaced by transit, the reduction in commute times for affected areas, and the overall increase in ridership across the entire system. We also analyze the cost-effectiveness by comparing the operational costs of the new line to the benefits in terms of reduced congestion and improved accessibility. The software’s ability to model these factors comprehensively allows for a more informed decision-making process.
Q 9. Describe your experience with optimization algorithms in transit planning software.
My experience with optimization algorithms in transit planning software is extensive. I’ve worked with a variety of algorithms, including linear programming, integer programming, and metaheuristics like genetic algorithms and simulated annealing. These algorithms are crucial for solving complex problems, such as route optimization, scheduling, and fleet sizing.
For example, in route optimization, we use algorithms to find the most efficient routes for buses or trains, minimizing travel time, operational costs, and maximizing coverage. This often involves solving large-scale mathematical programming problems. Integer programming is particularly useful here because we are dealing with discrete variables (e.g., the number of buses, the number of stops).
In scheduling, algorithms help determine optimal departure and arrival times for vehicles to maximize efficiency and minimize waiting times for passengers. This often involves considering factors like driver work rules and vehicle maintenance schedules. In fleet sizing, algorithms assist in determining the optimal number of vehicles needed to meet the demand, balancing the cost of owning and operating vehicles with the need to provide adequate service.
I’m proficient in using software packages that incorporate these algorithms, ensuring the selection of the most appropriate algorithm for a specific problem. This involves considering factors such as the size of the problem, the computational resources available, and the desired level of accuracy.
Q 10. How do you interpret the results of a transit demand model?
Interpreting the results of a transit demand model requires a nuanced understanding of both the model’s limitations and its strengths. The output typically includes predicted ridership for various routes and times of day, origin-destination matrices (showing passenger flows between different zones), and other relevant statistics.
I start by validating the model’s output against existing data. Are the predicted ridership levels reasonably close to the actual ridership figures? Any significant discrepancies warrant further investigation. This might involve checking data accuracy, refining model parameters, or reassessing the underlying assumptions.
Once I’m reasonably satisfied with the model’s accuracy, I analyze the results to understand trends and patterns. Are certain routes significantly overloaded? Are there areas with low ridership that could be improved? I might use visualization tools to create maps or charts showing predicted ridership densities, helping to identify areas needing improvement. This visual representation makes it easier to spot trends and present the data clearly to stakeholders.
Crucially, I recognize that a demand model provides a projection, not a certainty. Uncertainty is inherent in forecasting future behavior. I always account for this uncertainty by performing sensitivity analysis to see how the results change based on changes in key parameters. This helps me identify areas of significant uncertainty and plan for potential deviations from the predictions.
Q 11. What are the key performance indicators (KPIs) you would use to evaluate a transit system?
Evaluating a transit system requires a comprehensive set of Key Performance Indicators (KPIs), focusing on efficiency, effectiveness, and customer satisfaction. Some key KPIs I regularly use include:
- Ridership: Total number of passengers carried, broken down by route, time of day, and other relevant factors. This indicates the overall demand and success of the system.
- On-Time Performance: Percentage of trips that arrive within a specified timeframe. This reflects reliability and efficiency of the service.
- Speed and Travel Time: Average travel time between origins and destinations. This helps to gauge efficiency and user experience.
- Headway: Average time between successive vehicles on a route. A consistent headway signifies reliable service frequency.
- Accessibility: Percentage of the population within a reasonable walking distance of a transit stop or station. This measures the system’s reach and inclusivity.
- Customer Satisfaction: Measured through surveys, social media monitoring, or other feedback mechanisms. This indicates user experience and perceptions of the system.
- Cost-Effectiveness: Operating costs per passenger-km or passenger-mile. This helps assess the efficiency of resource allocation.
- Safety: Number of accidents or incidents per passenger-km. This ensures the system is safe for both passengers and staff.
The specific KPIs chosen will depend on the context and goals of the evaluation. For example, in a city focused on reducing traffic congestion, the reduction in vehicle kilometers traveled might be a critical KPI.
Q 12. Explain your experience with scenario planning in transit planning software.
Scenario planning is a cornerstone of effective transit planning. It allows us to explore the potential impacts of different future conditions and policy decisions on the transit system. I use transit planning software to create and compare various scenarios, each representing a plausible future state.
For example, we might create a scenario exploring the impact of increased urbanization on transit demand. This would involve projecting future population growth, employment patterns, and land use changes within the software. The software then models the resulting changes in travel demand, and subsequently simulates the needed changes to the transit system (e.g., increased frequency, new routes) to maintain service levels.
Another example would be evaluating the impact of different policy choices, such as implementing congestion pricing or investing in new transit infrastructure. The software allows us to model each of these policies independently and assess their impact on ridership, travel times, and operational costs, ultimately allowing policymakers to make informed decisions.
This process goes beyond simple ‘what-if’ analysis. It involves building a robust model, incorporating various uncertainties, and systematically evaluating the different scenarios using a range of KPIs. The outcome is a more robust and adaptable transit plan, less vulnerable to unforeseen changes.
Q 13. How do you handle uncertainty in transit demand forecasting?
Uncertainty in transit demand forecasting is inevitable. Several techniques help us manage this uncertainty. We don’t just rely on a single point forecast; instead, we use probabilistic forecasting methods to generate a range of possible outcomes.
One approach is to incorporate stochasticity into the demand model itself. This involves using statistical distributions to represent uncertain parameters, such as population growth rates or economic conditions. The software can then run numerous simulations, each with slightly different inputs, generating a distribution of potential future demands instead of a single prediction.
Another technique involves using sensitivity analysis. By systematically changing key parameters (such as income elasticity of demand, or modal split) within a defined range, we can assess how sensitive the forecast is to variations in these inputs. This highlights areas where uncertainty is most significant, guiding us to focus our efforts on gathering better data or refining our assumptions.
Furthermore, we often employ scenario planning to explore a range of possible futures, each characterized by different assumptions about future demographics, economic conditions, and technological advancements. For instance, one scenario might assume rapid technological advancement leading to greater adoption of ride-sharing services, influencing transit ridership.
By combining these techniques, we develop a more robust understanding of the range of possible future demands and can make more resilient transit plans that are less vulnerable to unforeseen circumstances.
Q 14. Describe your experience with sensitivity analysis in transit modeling.
Sensitivity analysis is essential in transit modeling because it helps us understand how changes in model parameters affect the results. This is crucial for making robust decisions, as input data and model assumptions are inherently uncertain.
In practice, I use a variety of sensitivity analysis techniques. One common approach is to systematically vary individual parameters, one at a time, while holding others constant. This helps identify which parameters have the largest impact on the key outputs, such as ridership or travel time. For instance, we might vary the cost of parking to see its effect on the mode share between driving and transit.
Another technique is to use scenario analysis. We could create scenarios representing different potential futures (e.g., high economic growth vs. low economic growth), systematically changing several parameters simultaneously to assess their combined impact. This is especially relevant in cases where parameters might be correlated.
The software tools I use automate these analyses, often generating plots and tables that visually represent the sensitivity of outputs to changes in inputs. This visual representation makes it easier to communicate the findings to non-technical stakeholders and aids in decision-making. For example, a sensitivity analysis could reveal that a transit project is highly sensitive to changes in fuel prices, suggesting a need for further investigation and potentially contingency planning.
The results of a sensitivity analysis help us prioritize data collection efforts, refine model assumptions, and develop more robust plans that are less vulnerable to uncertainties.
Q 15. How do you communicate complex technical information about transit plans to non-technical stakeholders?
Communicating complex transit plans to non-technical stakeholders requires a shift from technical jargon to clear, concise language and compelling visuals. I employ a multi-pronged approach:
- Analogies and Real-world Examples: Instead of discussing ‘network optimization algorithms,’ I might explain how changes will reduce travel time, similar to taking a shortcut on your commute. I use relatable scenarios to illustrate the impact of changes on daily lives.
- Visualizations: Maps, charts, and interactive dashboards are crucial. For instance, a before-and-after comparison of bus routes visually demonstrates the improvements. Color-coded maps highlighting changes in travel times or service frequency are incredibly effective.
- Storytelling: Framing the plan as a narrative, focusing on the benefits to the community (e.g., increased accessibility for seniors, reduced commute times for workers), makes it more engaging and memorable.
- Interactive Demonstrations: Using interactive tools, such as simulations, allows stakeholders to experience the proposed changes virtually, leading to a deeper understanding and increased buy-in.
- Targeted Communication: I tailor the message to the audience. A presentation to city council members will differ significantly from a community forum presentation. I ensure the language and level of detail are appropriate for each group.
For example, when presenting a light rail expansion plan, instead of discussing capacity modeling, I’d show a graph illustrating the projected increase in ridership and reduction in congestion on parallel roads.
Career Expert Tips:
- Ace those interviews! Prepare effectively by reviewing the Top 50 Most Common Interview Questions on ResumeGemini.
- Navigate your job search with confidence! Explore a wide range of Career Tips on ResumeGemini. Learn about common challenges and recommendations to overcome them.
- Craft the perfect resume! Master the Art of Resume Writing with ResumeGemini’s guide. Showcase your unique qualifications and achievements effectively.
- Don’t miss out on holiday savings! Build your dream resume with ResumeGemini’s ATS optimized templates.
Q 16. What experience do you have with transit schedule optimization software?
I have extensive experience with transit schedule optimization software, including both commercial packages like HASTUS and open-source tools. My experience spans various aspects of schedule design, from initial route planning and frequency setting to the intricate details of headway optimization and crew scheduling. I’ve worked with software that incorporates various optimization algorithms, including genetic algorithms and integer programming, to create efficient and cost-effective schedules. In one project, I used HASTUS to optimize the bus schedule for a rapidly growing suburban area, resulting in a 15% reduction in operational costs while maintaining service quality and even improving on-time performance. This involved balancing competing objectives such as minimizing operating costs, maximizing coverage, and adhering to service standards. I’m also proficient in using software to analyze the impact of schedule changes on various performance metrics like passenger waiting times and vehicle utilization.
Q 17. How would you use transit planning software to evaluate the impact of a new bus rapid transit system?
To evaluate the impact of a new bus rapid transit (BRT) system using transit planning software, I’d follow a multi-step process:
- Data Input: I’d begin by importing existing transit network data (likely in GTFS format) and incorporating data about the proposed BRT system, including routes, stops, frequencies, and operating hours. This would also include demographic data to model expected ridership.
- Demand Modeling: I’d use the software’s demand modeling capabilities to predict ridership on the BRT system and the existing transit network. This might involve using trip generation models to estimate the number of trips originating and ending in various zones.
- Network Simulation: The software would simulate the operation of the new BRT system, including interactions with existing transit services. This would help determine headways, passenger wait times, and travel times.
- Performance Analysis: The software would then generate key performance indicators (KPIs) such as ridership, travel times, operating costs, and environmental impact. This allows for a comprehensive comparison between the current transit network and the network after the BRT implementation.
- Scenario Planning: I’d run multiple scenarios (e.g., different frequencies, routes, or pricing strategies) to identify the optimal configuration of the BRT system.
- Sensitivity Analysis: Finally, I’d conduct sensitivity analyses to understand how the results change under various assumptions and uncertainties.
The results would then be presented to stakeholders using clear visualizations and reports, highlighting both the benefits (reduced travel times, increased ridership) and potential drawbacks (disruption during construction, potential impacts on other modes) of the proposed system.
Q 18. How familiar are you with different data formats used in transit planning (e.g., GTFS)?
I am very familiar with various data formats used in transit planning. GTFS (General Transit Feed Specification) is a cornerstone format, allowing for the standardized exchange of transit schedule and route data. I’m proficient in working with GTFS, including GTFS-realtime, which provides real-time updates on vehicle locations and service disruptions. Beyond GTFS, I’m experienced with shapefiles for geographic data, CSV and other spreadsheet formats for tabular data, and various database formats for storing and managing large datasets. I understand the nuances of data cleaning and pre-processing required to ensure compatibility and accuracy within the transit planning software. This includes handling missing data, correcting inconsistencies, and transforming data into the appropriate formats for specific modeling tasks. For instance, I know how to use GTFS data to create a network representation suitable for different simulation models.
Q 19. Describe your experience with data visualization techniques for transit planning data.
Data visualization is paramount in transit planning. I leverage various techniques to present complex data in an easily understandable manner. My experience includes:
- Interactive Maps: Using GIS software and online mapping platforms (e.g., Leaflet, Google Maps), I create interactive maps showing routes, stops, and ridership patterns. These maps can also show heatmaps representing passenger density or travel times.
- Charts and Graphs: I use various chart types such as bar charts, line graphs, and pie charts to present key performance indicators (KPIs), such as ridership, travel times, and operating costs. These are crucial for comparing different scenarios and highlighting trends.
- Dashboards: I develop interactive dashboards combining maps, charts, and other visualizations to give stakeholders a comprehensive overview of the transit system’s performance and the impact of proposed changes.
- 3D Visualization: For complex scenarios, I can utilize 3D visualization tools to model and visualize the transit network and its interactions with the surrounding environment.
For example, I once used a custom dashboard to show the impact of a proposed bus lane addition on travel times and passenger wait times, enabling stakeholders to understand the improvements in a more intuitive way than simply looking at tables of numbers.
Q 20. How do you ensure the accuracy and reliability of the data used in your models?
Data accuracy and reliability are critical in transit planning. I employ several strategies to ensure this:
- Data Validation: Rigorous data validation techniques, including automated checks and manual reviews, are essential. This involves checking for inconsistencies, outliers, and missing data. I use scripting languages such as Python to automate the validation process.
- Data Sources: I prioritize using multiple, reputable data sources to cross-validate information. This includes data from transit agencies, GPS tracking systems, and other relevant sources.
- Data Cleaning: I dedicate significant effort to cleaning and pre-processing the data. This might involve handling missing values, correcting errors, and transforming data into a consistent format.
- Quality Control: Implementing robust quality control procedures throughout the data lifecycle helps to minimize errors and maintain accuracy. This includes regular data audits and version control.
- Uncertainty Analysis: I acknowledge that some data contains inherent uncertainty. I incorporate techniques such as sensitivity analysis to understand how uncertainty in input data affects the model’s outputs. This allows for a more realistic evaluation of the plan.
For instance, I’ve used automated scripts to compare GTFS data against GPS tracking data to identify discrepancies in schedule adherence and address potential data quality issues.
Q 21. Explain your experience with different types of transit network representations.
Transit networks can be represented in various ways, each with its strengths and weaknesses:
- Node-Link Diagrams: This is a fundamental representation where nodes represent stops or stations and links represent the routes connecting them. This is straightforward for visualization and easy to implement in algorithms.
- Network Matrices: Matrices representing connectivity between nodes are valuable for computational purposes, often used in shortest path algorithms or network flow calculations. These matrices, like adjacency matrices, efficiently store connection information.
- Geographic Information Systems (GIS): GIS data, usually in shapefile format, provide a spatial representation of the network. This is essential for visualizing routes on maps, analyzing geographic accessibility, and integrating with other geographic data.
- Transit Network Graphs: More advanced representations model the transit network as a directed graph, which can incorporate various attributes like travel times, frequencies, and transfer penalties. These are ideal for complex simulations and optimization algorithms.
My experience includes working with all these representations. The choice of representation depends on the specific application. For example, a simple node-link diagram might suffice for a basic route visualization, while a complex graph representation would be necessary for simulating a large, multi-modal transit network using advanced software.
Q 22. How do you incorporate user behavior into your transit models?
Incorporating user behavior into transit models is crucial for creating accurate and effective transit plans. We achieve this by integrating various data sources and using sophisticated modeling techniques. For example, smart card data provides detailed information on passenger routes, boarding and alighting locations, and trip frequencies. This data is invaluable in understanding actual passenger flow and identifying areas with high demand or underserved routes.
Furthermore, we utilize surveys, mobile phone location data (with appropriate privacy considerations), and social media analytics to capture broader travel patterns and preferences. These data sources allow us to identify patterns that traditional data might miss, such as understanding the effect of special events on ridership or discovering the influence of socioeconomic factors on transit choices.
This data is then integrated into models, often using agent-based modeling or discrete choice models. Agent-based models simulate individual passenger behavior, allowing us to predict how changes to the transit system (such as new routes or schedules) will affect passenger choices and overall system performance. Discrete choice models, on the other hand, quantify the probability of a passenger choosing one transit option over another based on factors like travel time, cost, and convenience.
Q 23. What are the challenges of using large-scale datasets in transit planning software?
Working with large-scale datasets in transit planning presents several significant challenges. The sheer volume of data requires robust infrastructure and efficient processing capabilities. Storage and retrieval of data, particularly real-time data streams from GPS trackers and smart cards, demand powerful databases and optimized query mechanisms. This can be computationally expensive and require specialized hardware.
Data quality is another major issue. Large datasets often contain inconsistencies, errors, and missing values which can significantly impact model accuracy. Thorough data cleaning and validation procedures are absolutely necessary. This can be a time-consuming process requiring dedicated personnel and sophisticated data quality tools.
Finally, ensuring data privacy and security is paramount, especially when dealing with personal travel information. Compliance with relevant regulations (like GDPR or CCPA) requires careful consideration of data anonymization and security protocols. We employ techniques like differential privacy and data masking to protect sensitive information.
Q 24. Describe your experience with integrating transit planning software with other systems.
I have extensive experience integrating transit planning software with other systems. For example, I’ve worked on projects where we integrated our transit model with Geographic Information Systems (GIS) to visualize network performance and potential service improvements geographically. This allows for a powerful visual representation of network analysis outputs, readily understandable to both technical and non-technical stakeholders.
Another key integration was with fare collection systems. By linking our models to fare data, we can directly assess the financial implications of different service scenarios and optimize revenue generation. We’ve also integrated with real-time traffic data feeds to dynamically adjust our models and provide more accurate predictions, factoring in real-world traffic congestion and its impact on transit schedules.
In one project, we linked our system to a city’s traffic management center. This integration allowed for real-time updates of transit performance, enabling immediate responses to unforeseen events like accidents, which could then be used to adjust transit routing and inform passengers of any changes. Successful integration usually requires careful consideration of data formats, APIs, and data security protocols.
Q 25. How do you stay up-to-date with the latest advancements in transit planning software and technology?
Staying current in this rapidly evolving field requires a multifaceted approach. I actively participate in professional organizations like the Transportation Research Board (TRB) and attend conferences and workshops to learn about new methodologies and software developments. This keeps me connected to the latest advancements in the field.
I subscribe to relevant journals and online publications, keeping track of published research and industry news. Furthermore, I engage with online communities and forums focused on transit planning, where I can access peer-reviewed articles, industry case studies and discussion of best practices. This helps me learn about new algorithms, model enhancements, and software updates from multiple perspectives.
Finally, continuous professional development is key. I regularly undertake online courses and training programs focusing on new technologies and techniques within transit planning software. This ensures that I stay proficient in the newest tools and capabilities available.
Q 26. What are some best practices for managing and maintaining transit planning data?
Effective management and maintenance of transit planning data are crucial for accurate modeling and efficient decision-making. We begin by establishing a clear data governance framework. This includes defining data standards, establishing data ownership and accountability, and implementing robust data quality control procedures.
A well-structured data warehouse is essential for storing and organizing the massive amounts of data involved. This allows for efficient data retrieval and analysis. We employ relational databases with efficient indexing and query optimization techniques. We also utilize version control to track changes and maintain data integrity.
Data backup and disaster recovery plans are crucial to protect against data loss. Regular backups to a secure location ensure business continuity in case of system failures or natural disasters. Moreover, we utilize data validation tools and techniques to identify and correct inconsistencies and errors, ensuring data quality throughout the lifecycle.
Q 27. Describe a time you had to troubleshoot a problem in transit planning software. What was the issue, and how did you resolve it?
In one project, we experienced unexpected spikes in model runtime. Our initial investigation pointed to a database query that was performing poorly. The transit network dataset had grown significantly, causing the query to take an excessive amount of time to complete. This impacted the overall model’s performance and made real-time simulations impractical.
To resolve this, we first performed a thorough analysis of the query, identifying the bottlenecks. We then implemented several optimization techniques. This included optimizing the database indexes, refactoring the query to reduce its complexity and making effective use of database caching. We also considered alternative database technologies better suited for handling large datasets.
Finally, we worked closely with the database administrators to improve overall server performance. After implementing these changes, the model runtime was significantly reduced, allowing us to resume real-time simulations and maintain project timelines.
Q 28. How would you explain the concept of transit supply and demand to a non-technical audience?
Think of transit supply as the number of buses, trains, or other vehicles available to transport people, and their schedules. Demand is the number of people who want to use that transit system at any given time. If the supply (available seats) is less than the demand (number of people wanting to travel), you have overcrowding, long wait times, and an unhappy public.
For instance, imagine a rush hour where many people need to commute to work. This is high demand. If there aren’t enough buses or trains running, the demand will exceed the supply. Conversely, if there are plenty of empty seats on buses at 3 am, the supply exceeds the demand. Transit planning aims to match supply and demand as effectively as possible, providing efficient and reliable service while minimizing wasted resources.
The goal is to find the right balance: enough service to meet the needs of riders without providing too much service that is underutilized. This involves careful analysis of ridership patterns, population growth predictions, and evaluating the efficiency of current services. Finding this balance optimizes resources and creates a more sustainable and satisfying transit experience for everyone.
Key Topics to Learn for Transit Planning Software Interview
- Network Modeling & Simulation: Understanding how software simulates transit networks, including route optimization and passenger flow analysis. Practical application: Analyzing the impact of a new bus route on overall network efficiency.
- Schedule Optimization: Mastering the principles and techniques used to create efficient and effective transit schedules, considering factors like headways, dwell times, and crew scheduling. Practical application: Developing a schedule that minimizes passenger wait times while maximizing vehicle utilization.
- Data Analysis & Visualization: Proficiency in using software to analyze large datasets related to ridership, travel patterns, and service performance. Practical application: Identifying areas with low ridership and proposing solutions based on data-driven insights.
- Scenario Planning & Forecasting: Utilizing software to model different scenarios (e.g., increased ridership, service disruptions) and predict future transit needs. Practical application: Evaluating the impact of population growth on transit demand and proposing infrastructure improvements.
- GIS Integration & Mapping: Understanding how transit planning software interacts with geographic information systems (GIS) for visualization and analysis. Practical application: Creating maps showing bus routes, stops, and service areas.
- Software-Specific Features: Familiarizing yourself with the specific features and functionalities of the transit planning software mentioned in the job description. Practical application: Demonstrating your ability to use the software’s tools to solve real-world problems.
- Problem-Solving & Analytical Skills: Highlighting your ability to identify, analyze, and solve complex problems related to transit planning using the software. Practical application: Presenting a clear and concise solution to a hypothetical transit planning challenge.
Next Steps
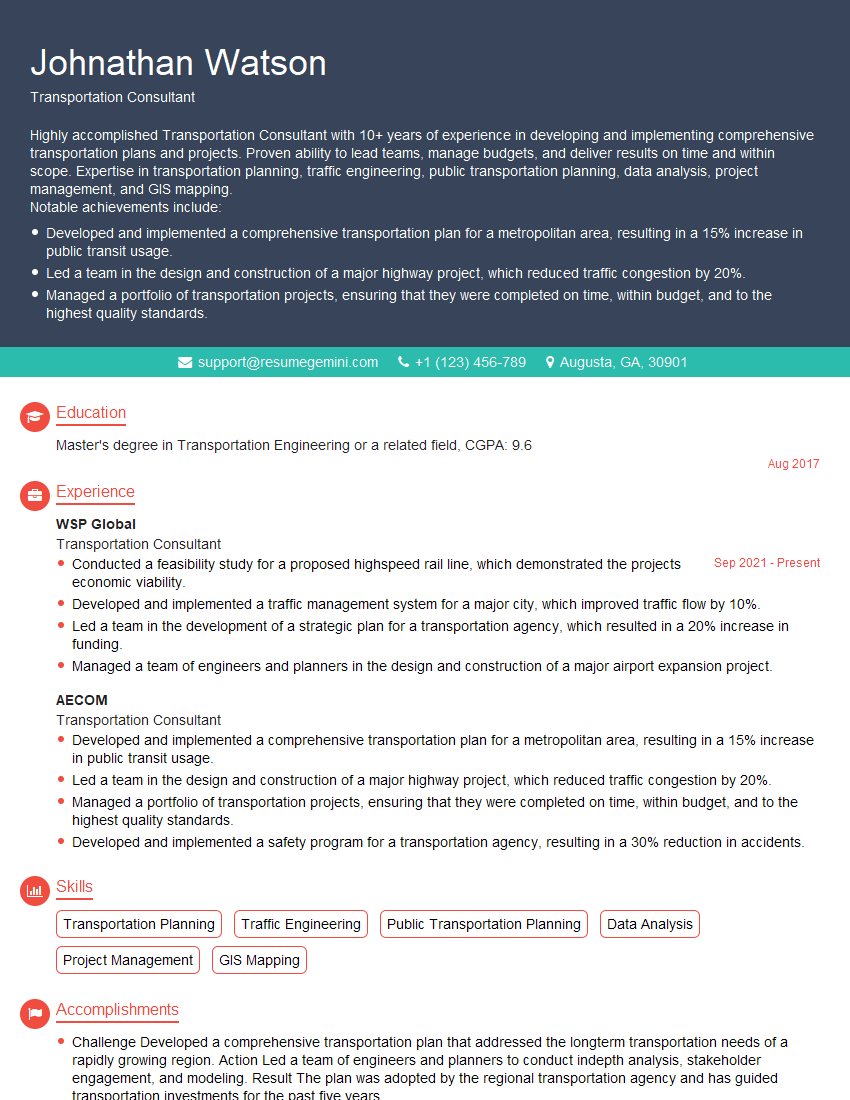
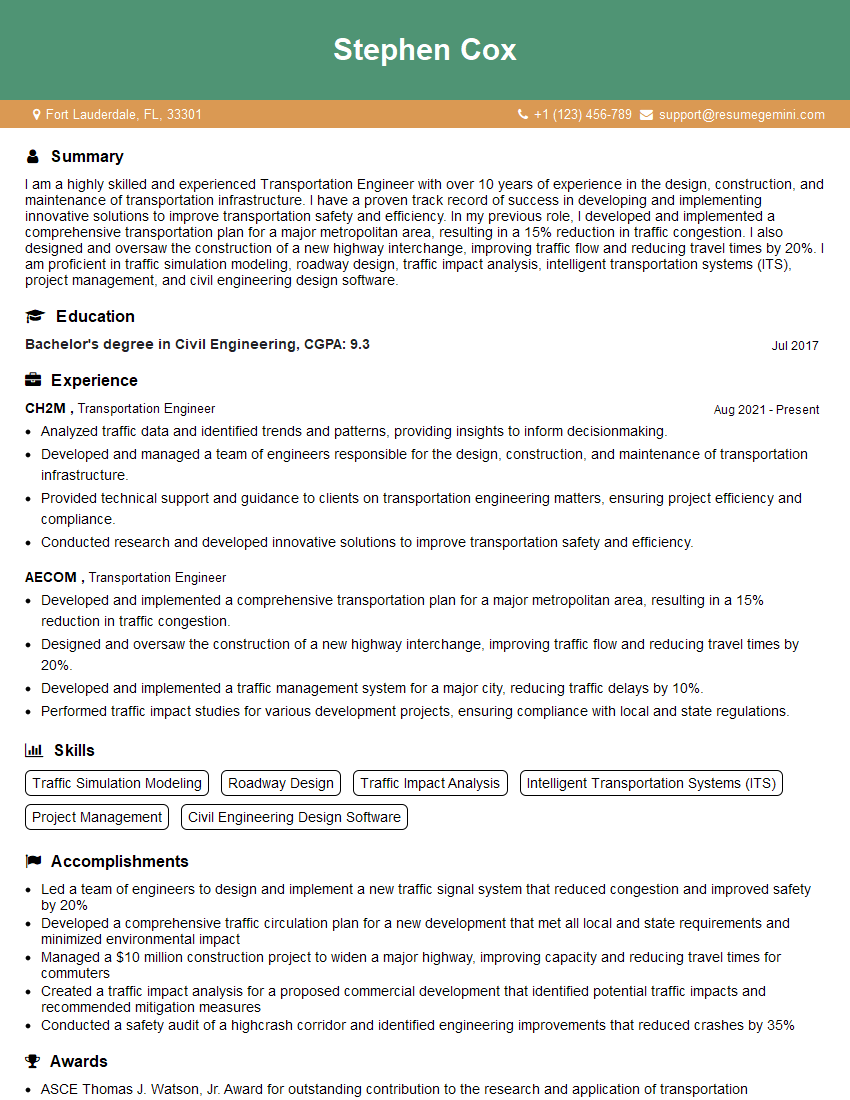
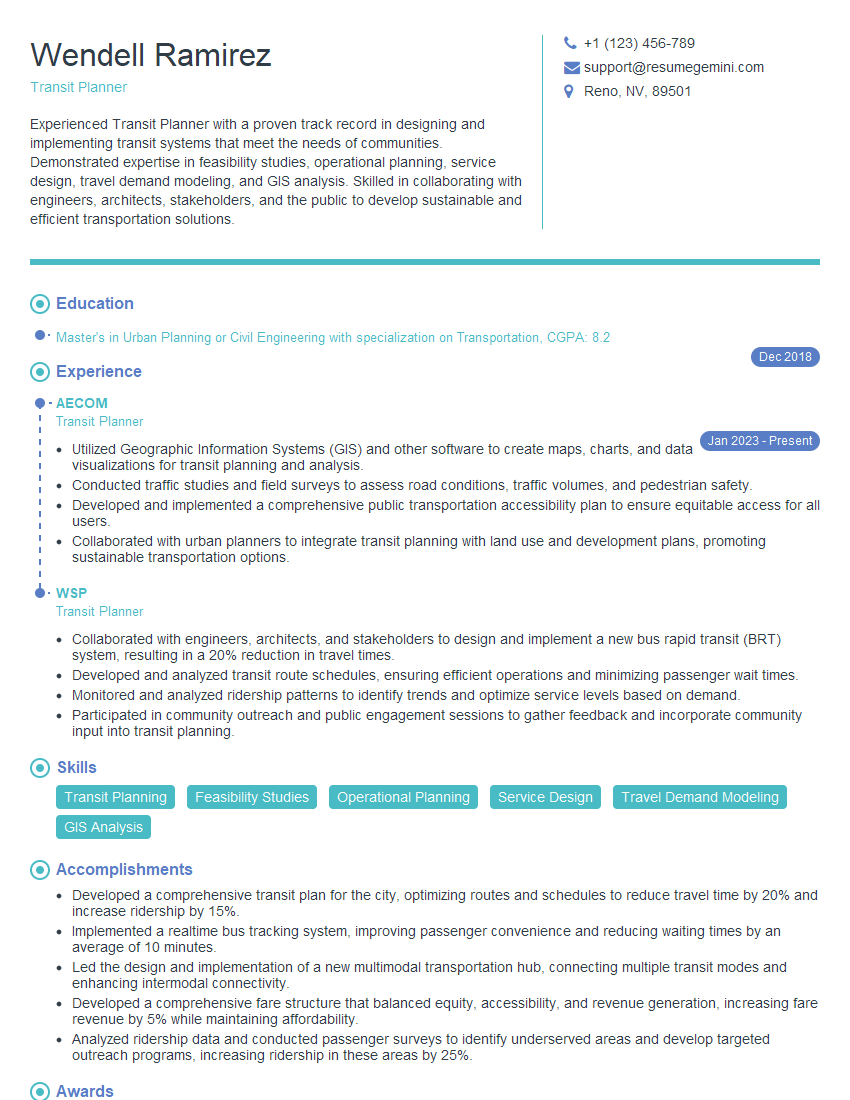
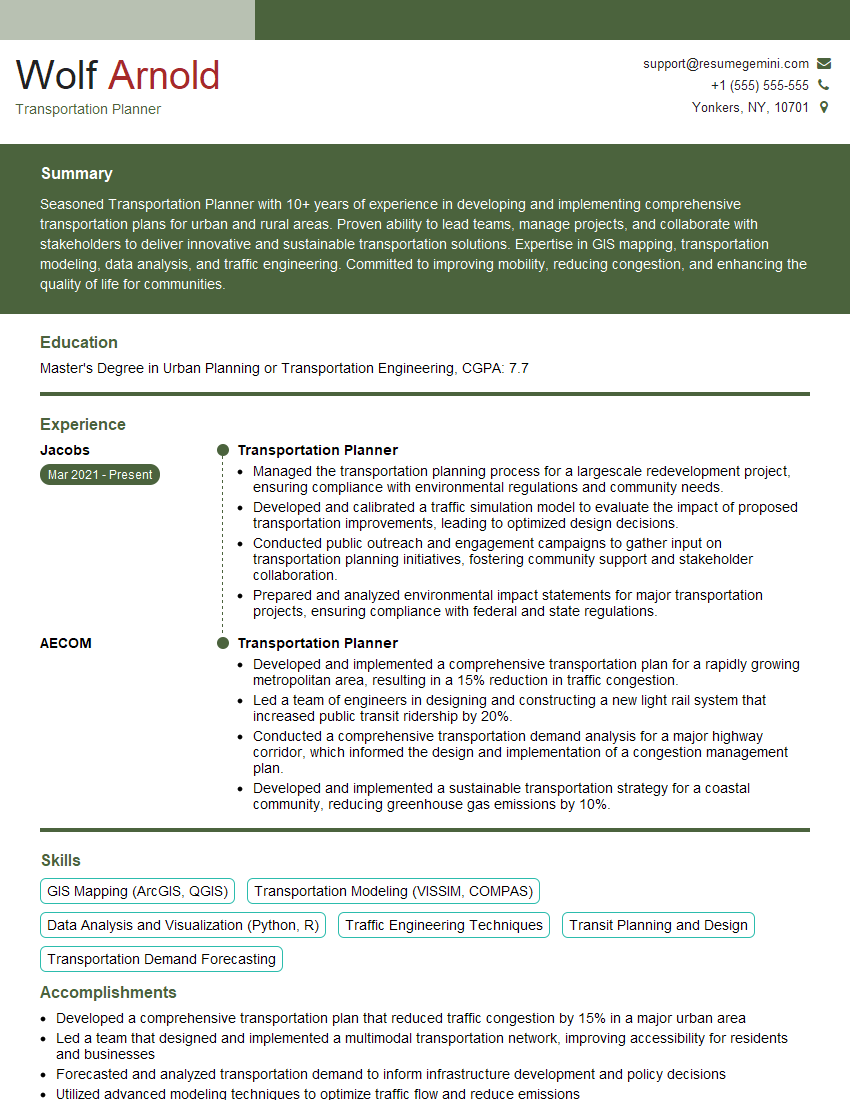
Mastering transit planning software is crucial for a successful career in transportation. It demonstrates your technical skills and your ability to contribute meaningfully to efficient and effective transit systems. To significantly boost your job prospects, focus on creating an ATS-friendly resume that highlights your relevant skills and experience. ResumeGemini is a trusted resource that can help you craft a compelling resume that showcases your qualifications effectively. Examples of resumes tailored to Transit Planning Software are available to guide you.
Explore more articles
Users Rating of Our Blogs
Share Your Experience
We value your feedback! Please rate our content and share your thoughts (optional).
What Readers Say About Our Blog
To the interviewgemini.com Webmaster.
Very helpful and content specific questions to help prepare me for my interview!
Thank you
To the interviewgemini.com Webmaster.
This was kind of a unique content I found around the specialized skills. Very helpful questions and good detailed answers.
Very Helpful blog, thank you Interviewgemini team.